OBI EE, Time Dimensions and Time-Series Calculations
I’m currently working on a paper on Oracle BI Suite Enterprise Edition (OBI EE) for Discoverer users, for the upcoming ODTUG conference at Daytona Beach, and a tricky area that I’ve come up against recently is getting the metadata layer in a state suitable for performing time-series queries. One of the strengths of Discoverer is it’s support for analytic and time-series (lag, lead, window etc) queries and any customer looking to migrate to Answers and Interactive Dashboards would want to make these new tools have similar capabilities.
Taking a look through the OBI EE documentation, it appears there is some basic support for time-series queries, in the form of AGO and TODATE. AGO gives you, for example, the value of sales one month ago or one quarter ago, whilst TODATE gives you the total of sales month-to-date, or quarter-to-date, or year-to-date. Both of these time-series functions rely on the existence of a time dimension in your business model and mapping layer, with the period you can refer to in the AGO and TODATE functions being determined by what levels you have in this time dimension. I found, however, the time dimension a bit tricky to set up, but now I’ve got it working, I thought I’d jot down some notes on how the process works.
As a quick recap: dimensions in OBI EE define drill paths in your data, and are a prerequisite if you want uses to be able to drill down from say all customers, to region, then warehouse and finally ship to.
Each level has at least one logical key, the top level is marked as the “grand total” level, and you can drag other attributes in to each level and have OBI EE display those, rather than the level key, when users drill down in reports. At present, you have to create these dimensions manually when setting up your business model and mapping layer, although there is talk about automatically creating these when importing Oracle dimensions or OLAP structures, or when using the soon-to-be-delivered Discoverer migration utility. In my case though, I create them all manually which is usually a five or ten minute job at most.
For the migration paper I’m working on for the ODTUG event, I’m bringing across the Videostore example dataset that comes with Discoverer Administrator, on the basis that everyone running Discoverer has got it and most people are familiar with its contents. To keep things simple, I’m initially working with the main sales fact table, SALES_FACT and the three dimension tables it links to, TIMES, PRODUCT and STORE. One additional step I had to carry out though to get everything working was to create two additional views in the VIDEO5 schema:
A view over the TIMES table to add additional month and quarter attributes that are used to display month and quarter names, and to permit their sorting (like alternate sorts in Discoverer)
create or replace view times_view
       (time_key
,      transaction_date
,      day_of_week
,      holiday_flag
,      month_mon_yyyy
,      month_id_yyyy_mm
,      year_yyyy
,      quarter_q_yyyy
,      quarter_id_yyyyq)
AS
       select time_key
,      transaction_date
,      day_of_week
,      holiday_flag
,      substr(to_char(transaction_date,'MON'),1,1)
       ||lower(substr(to_char(transaction_date,'MON-YYYY'),2))
       as month_mon_yyyy
,      to_char(transaction_date,'YYYYMM') as month_id_yyyy_mm
,      to_char(transaction_date,'YYYY') as year_yyyy
,      'Q'||to_char(transaction_date,'Q-YYYY')
       as quarter_q_yyyy
,      to_char(transaction_date,'YYYY')
       ||to_char(transaction_date,'Q') as quarter_id_yyyyq
from   times;
And a view over the SALES_FACT table to allow it to be joined to the TIMES_VIEW view on the transaction_date column (a date datatype) rather than the TIME_KEY column (a number datatype) – this is because I found I needed to make the primary key for the logical TIMES table a date, rather than a number, to get the time-series offset calculations working:
create or replace view sales_fact_view
      (cost
,      customer_count
,      product_key
,      profit
,      sales
,      store_key
,      transaction_date
,      unit_sales)
as
select cost
,      customer_count
,      product_key
,      profit
,      sales
,      store_key
,      transaction_date
,      unit_sales
from   sales_fact, times
where  sales_fact.time_key = times.time_key;
Theoretically, at least the view over the time dimension shouldn’t be necessary, as you can create virtual (calculated) columns within OBI EE, but when I tried to do this, although the columns created OK I had trouble using them with the AGO and TODATE functions; it may also be the case that you can use non-date columns for the time dimension primary key, but again I had problems getting this working. What I’m showing here is what eventually worked for me, but feel free obviously to try and build things without these views, and let me know if you get it working.
Anyway, once the views are created, I then imported them in to the physical layer of the common enterprise information mode, created a primary key key on the TIMES_VIEW.TRANSACTION_DATE column, and foreign keys on the SALES_FACT_VIEW.PRODUCT_KEY, TRANSACTION_DATE and STORE_KEY columns, linking back to the relevant tables/views. Once this was done, I dragged the whole set of Videostore tables and views over to the business model and mapping view to create a set of logical tables, like this:
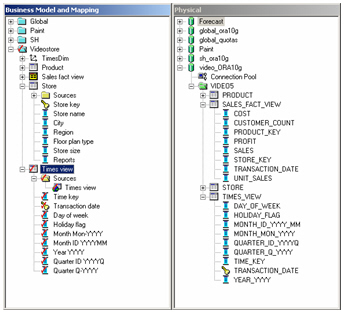
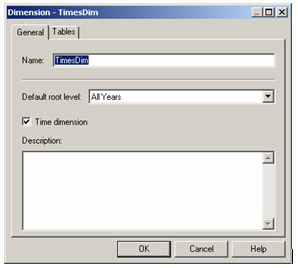
After running the rename utility to put all the column and tables names in to sentence case, remove the underscores and so on, it was time to create the time dimension, which I called TimesDim.
Creating a time dimension is initially the same as creating a regular dimension, except on the dimension properties dialog you tick the “Time dimension” tickbox, like this:
Then, I created five levels for the dimension:
- All Years
- Year
- Quarter
- Month
- Day
and then dragged the TRANSACTION_DATE column from the TIMES_VIEW logical table on to the day level, the MONTH_IDYYYYMM column on to the month level, the QUARTER_ID_YYYYQ on to the quarter level, and left the year level empty as it’s a grand total level. For the day, month and quarter levels, the columns dragged on to them were registered as logical level keys and also as the primary key for each level – the rationale here being that in DATE, YYYYMM and YYYYQ format, column values were sortable which is a requirement for performing rolling-window time-series calculations.
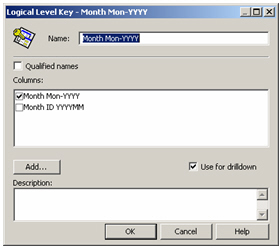
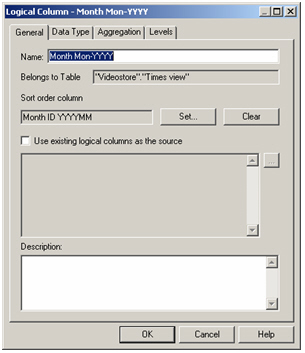
Next, to finish off the dimension, I dragged the MONTH_MON_YYYY column on to the month level, added it as a level key but kept the previous value as the primary key, like this:
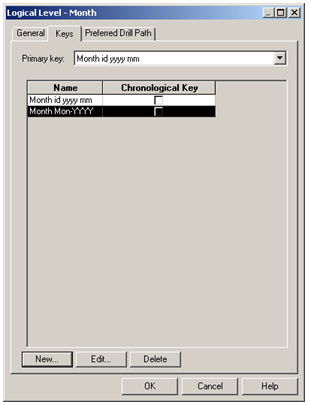
I then edited each level key and ensured the “Use for drilldown” checkbox was unchecked for the YYYYMM value, but checked for the second, MON-YYYY value, so that the correct column was used for organizing the level values but users saw friendly looking month names when they drilled into time dimension values.
After doing the same for the Quarter dimension, I then went back to the day, detail level and carried out one more task, and the one that’s essential for a time dimension – marking one of the logical keys as being the Chronological Key. In my case, I marked the key created using the TRANSACTION_DATE column as being the Chronological key, which worked for me.
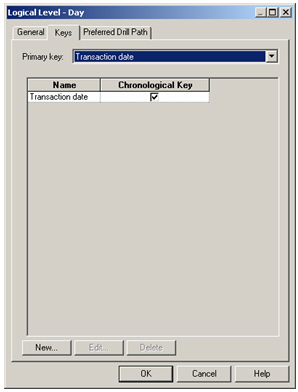
According to the docs, the chronological key has to be a “monotonically increasing value” which stumped me a bit; I tried using just a number field but I couldn’t get the time-series queries to output the correct values for month ago sales and so on, but this could more be down to my unfamiliarity with the feature – again, if you know better, let me know.
Once everything was done, and I added the other detail day-level attributes into the day level, my dimension looked like this:
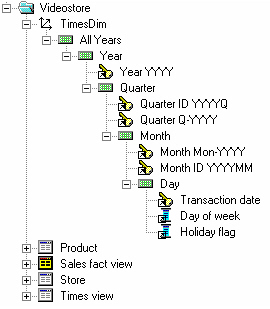
with each level containing the following columns:
- All Years Level (grand total level) – no keys or columns added
- Year Level – YEAR_YYYY column, set as primary key, set as logical key
- Quarter Level – QUARTER_ID_YYYYQ set as primary key and logical key but with “use for drilldown” disabled, together with QUARTER_Q_YYYY set as a logical key and enabled for drilldown
- Month Level –
MONTH_ID_YYYYMMset as primary key and logical key but with “use for drilldown” disabled, together withMONTH_MON_YYYYset as a logical key and enabled for drilldown - Day Level –
TRANSACTION_DATEset as primary key and logical key and enabled for drilldown,DAY_OF_WEEKandHOLIDAY_FLAGset as attributes and not used for drilldown.
The next step was to tell OBI EE to sort the MONTH_MON_YYYY column by the MONTH_ID_YYYYMM column, and the QUARTER_Q_YYYY column by the QUARTER_ID_YYYYQ column, as whilst the latter columns were more readable (“Q3 2000”,”Jun-1999” and so on) they don’t sort properly by default (the year would start “Apr-1998”, followed by “Aug-1998” and so on). To do this, I double-clicked on the columns to be sorted and picked the other columns as the one to sort them by, like this:
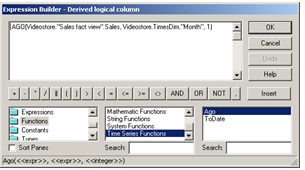
Now the time dimension and logical table were set up, I could create my time-series functions. To start off, I used the AGO function to calculate the sum of sales one month ago, based on the SALES_FACT.SALES column, using the following formula:
AGO(Videostore."Sales fact view".Sales, Videostore.TimesDim."Month", 1)
...with "Sales Fact View".Sales being the base measure, Videostore.TimesDim.Month indicating that within our time dimension, we're going to use months as the offset, and 1 indicating that we're going back 1 month.
So, now it’s time to test it out. After dragging all the logical columns to the presentation layer and saving the changes to the repository, I started up Oracle BI Answers and ran a query showing sales month-by-month with last months sales next to them, like this:
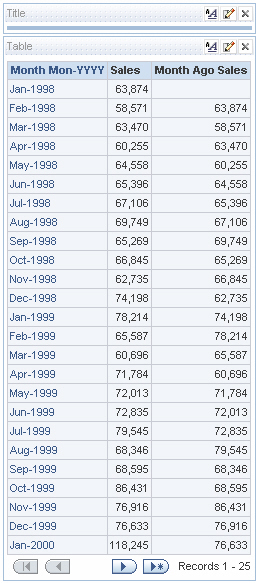
Not bad. Running it at the day level gave similar results.
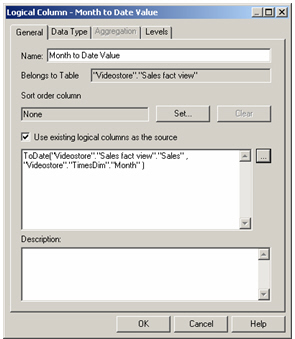
Using the expression editor, I created another logical column, this time using the TODATE function to create month-to-date values, using the expression:
ToDate("Videostore"."Sales fact view"."Sales" , "Videostore"."TimesDim"."Month" )
with "Sales fact view"."Sales" being the base measure, and "Videostore"."TimesDim","Month" indicating we're going a month-to-date (as opposed to, say, year-to-date) total.
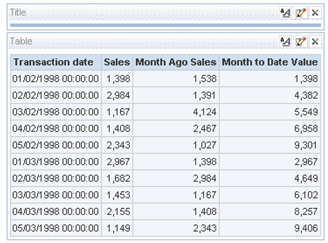
Then, running the day-level report created a moment ago, along with this new month-to-date attribute, gave the following results:
Looking back, the tricky bits were firstly, adding all the derived month and quarter values for the times logical table, which I tried doing using the EXTRACT and CAST features of BI Server SQL, but in the end found much easier just deriving as part of an Oracle view. The second tricky part was working out that the chronological key was only defined at the bottom (day) level, and that it should be a date datatype – this might be wrong, but it’s the only way I got it working. The final tricky bit was sorting the month and quarter descriptive columns by the YYYYMM and YYYYQ columns – without these, either the months and quarters were listed in the wrong order, or worse, they were in the right order but the time-series calculations were sometimes wrong. Going down the route I’ve outlined in this article made it work for me, but as I say if there’s a simpler way just let me know.