OBIEE Data Modeling Tips #3: Ragged Hierarchies
In this third "design tip", I'm going to look at creating ragged hierarchies in Oracle BI Suite Enterprise Edition.
Ragged Hierarchies are hierarchies where some routes down the hierarchy are longer than others; for example, you may have an organizational hierarchy for salespeople where the overall boss has two assistant managers, one of them works on their own and another has three sales managers under them; some of those sales manager may have sales staff under them, and some sales staff may have trainees under them, like this diagram from this Joe Celko article.
In OLAP tools such as Discoverer for OLAP these sorts of hierarchies are simple to display, but in relational query tools such as Oracle BI Answers they're more tricky, as the underlying logical model expects dimension hierarchies to have a fixed depth and leaf levels to be common for each branch. So how do you handle ragged hierarchies with Oracle BI Suite Enterprise Edition?
Well I can't claim the credit for this one as it's actually based on a tip provided by Kurt Wolff; what I have done however is convert the original T-SQL code used to create the supporting metadata to Oracle PL/SQL. Anyway, here's how it goes.
We have a data source of salesperson details, where each salesperson has a name, an ID and a manager ID as shown below:
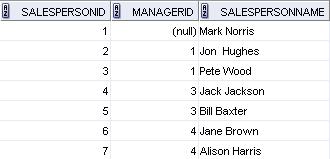
with the following table DDL:
create table salesperson_tree (
		salespersonid   number(9)
,		managerid       number(9)
,               salespersonname varchar2(40));
we have seven salespeople arranged in the following ragged hierarchy:
(1)Mark Norris
--(2)Jon Hughes
--(3)Pete Wood
-----(4)Jack Jackson
--------(6)Jane Brown
--------(7)Alison Harris
-----(5)Bill Jameson
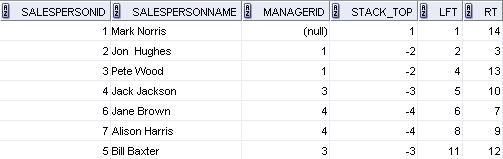
The way the technique works is to create another table (the "Stack" table) to hold salesperson details, but this time to add two new columns, as suggested by the Joe Celko article mentioned above, which are populated in such a way that the value of the Left column in any row is between the Left and Right values of any of its ancestors.
create table salesperson (
		salespersonid   number(9)
,               salespersonid   number(9)
,               managerid       number(9)
,               stack_top       number(9)
,               lft             number(9)
,               rt              number(9));
The Left and Right values thus define a way of obtaining the set of nodes that are descendants of any other node. Since the set of descendants of any node are included in the set of descendants of that node's ancestors, the Left and Right values actually define "nested sets". As I said, I can't claim credit for this, but it works and it's fairly easy to populate these additional columns, together with an additional column to indicate the distance from the start of the tree for each hierarchy node, using this PL/SQL procedure:
CREATE OR REPLACE PROCEDURE Pop_SalesPerson_Hier AS Counter NUMBER(9); Max_Counter NUMBER(9); Current_Top NUMBER(9); Tree_Count NUMBER(9); Exists_Test NUMBER(9); Max_SalesPersonId NUMBER(9); BEGIN Counter := 2;SELECT COUNT(* )
INTO Tree_Count
FROM SalesPerson_Tree;Max_Counter := 2 * Tree_Count;
Current_Top := 1;
-- clear the stack
DELETE FROM SalesPerson;
COMMIT;
-- push the rootINSERT INTO SalesPerson
(Stack_Top,
SalesPersonId,
ManagerId,
SalesPersonName,
lft,
rt)
SELECT 1,
SalesPersonId,
NULL,
SalesPersonName,
1,
Max_Counter
FROM SalesPerson_Tree
WHERE ManagerId IS NULL ;
-- delete rows from tree as they are usedDELETE FROM SalesPerson_Tree
WHERE ManagerId IS NULL ;WHILE Counter <= Max_Counter - 1 LOOP
BEGIN
SELECT COUNT(* )
INTO Exists_Test
FROM SalesPerson s1,
SalesPerson_Tree t1
WHERE s1.SalesPersonId = t1.ManagerId
AND s1.Stack_Top = Current_Top;IF Exists_Test > 0 THEN BEGIN -- push when top has subordinates and set lft value SELECT MIN(t1.SalesPersonId) INTO Max_SalesPersonId FROM SalesPerson s1, SalesPerson_Tree t1 WHERE s1.SalesPersonId = t1.ManagerId AND s1.Stack_Top = Current_Top; INSERT INTO SalesPerson (Stack_Top, SalesPersonId, ManagerId, SalesPersonName, lft, rt) SELECT Current_Top + 1, t1.SalesPersonId, t1.ManagerId, t1.SalesPersonName, Counter, NULL FROM SalesPerson_Tree t1 WHERE t1.SalesPersonId = Max_SalesPersonId; -- delete rows from tree as they are used DELETE FROM SalesPerson_Tree WHERE SalesPersonId = (SELECT SalesPersonId FROM SalesPerson WHERE Stack_Top = Current_Top + 1); -- housekeeping of stack pointers and counter Counter := Counter + 1; Current_Top := Current_Top + 1; END; ELSE BEGIN -- pop the stack and set Rt value UPDATE SalesPerson SET rt = Counter, Stack_Top = - Stack_Top --pops the stack WHERE Stack_Top = Current_Top; Counter := Counter + 1; Current_Top := Current_Top - 1; END; END IF; END;END LOOP;
END Pop_SalesPerson_Hier;
Once you run this code, you end up with a table with contents looking like this:
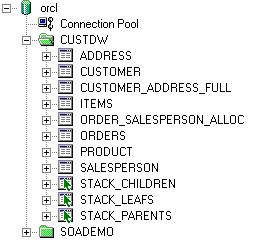
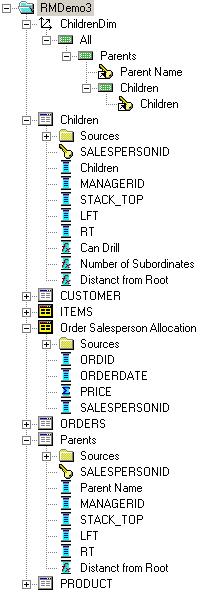
Once the table is defined and the PL/SQL code run, you next need to import the table, together with any table containing data you want to link to, into the physical layer of the semantic model. To get the ragged hierarchy feature to work, you then need to create three aliases for this table, for example called STACK_CHILDREN, STACK_PARENTS and STACK_LEAFS. Finally, you need to bring in any tables that the ragged hierarchy links to (if they're not in the model already), giving you a set of additional physical tables looking like this:
Now, you need to join the three alias tables, using the following join conditions:
STACK_PARENTS.SALESPERSONID = STACK_CHILDREN.MANAGERIDSTACK_LEAFS.LFT BETWEEN STACK_CHILDREN.LFT AND STACK_CHILDREN.RT
giving you the following physical model diagram:
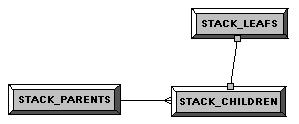
The join from STACK_PARENTS to STACK_CHILDREN is a foreign key join, whilst the join from STACK_CHILDREN to STACK_LEAFs is a complex join. Next, we create a join from the STACK_LEAFS table to the ORDER_SALESPERSON_ALLOC fact table that contains the data we wish to analyze, like this:
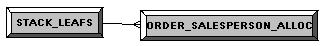
using a foreign key and the join condition:
STACK_LEAFS.SALESPERSONID = ORDER_SALESPERSON_ALLOC.SALESPERSONID
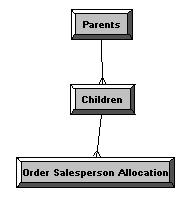
Now it's a case of bringing this into the logical model.
The first job is to import the Leaf, Children, Parents and fact table in to the logical model, and join the Children, Parent and fact table like this, using complex joins:
Now (and be careful on this bit, be sure to follow the steps) map the leafs table on to to the fact table logical mapping using the following steps:
- Double-click on the fact table to bring up the logical table properties.
- Click on the source tab - it should show just a single logical table source corresponding to the fact table physical source.
- Double-click on this logical table source to bring up the logical table source dialog, as shown below:
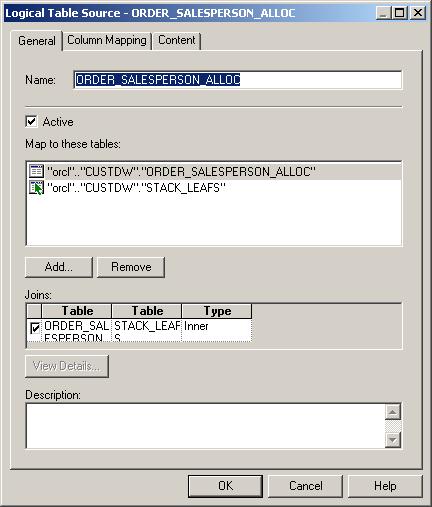
Click on the Add button to add a second mapping, adding the leaf table as shown in the screenshot.
This additional logical table source mapping will only be used when data from the fact table and data from the Parent or Child tables are included in a query, and has the effect of joining the fact table to the leafs table in the physical model.
Now, you can create some additional logical columns to help handle navigation around the hierarchy. In my case, I created two additional columns for the Child and Parent logical tables; "Distance from Root", with the formula:
STACK_LEAFS.SALESPERSONID = ORDER_SALESPERSON_ALLOC.SALESPERSONID
and "Can Drill", with the formula:
CASE  WHEN RMDemo3.Children.LFT + 1 < RMDemo3.Children.RT
THEN 'Yes'
ELSE 'No' END
To indicate when a child is a leaf level.
Next, you create a dimension that has grant total, parent and child levels, with the (in this case) salesperson name from the Parent and Child table dragged on and made in to logical level keys. The logical model in the end looks like this:
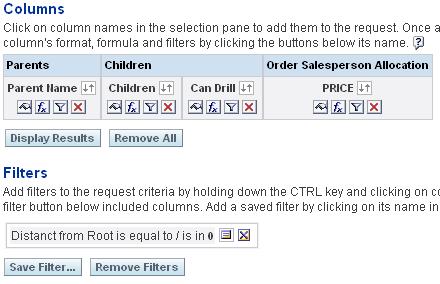
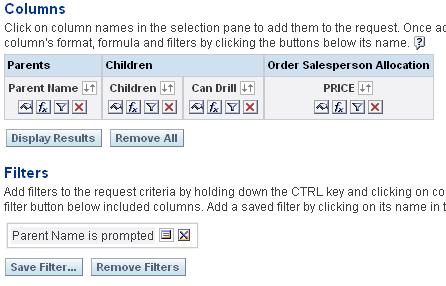
Now on to Oracle BI Answers. The initial query, to show figures for the top level and it's immediate children is straightforward, and involves just dropping on the Parent Name, Child Name and measure, and then putting on a filter of "0" on the Parent's Distance from Root column, like this:
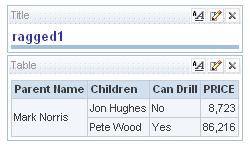
Now, when I run the request, I get the following results:
The limitation now though is that if I just use regular drilling, I'll be able to drill down from parent to child, but that's it. To simulate proper, unlimited ragged hierarchy drilling, we need to use custom navigation and a bit of Javascript that will recursively call a report laid out the same but with another name and without the filter on distance from root, and for both reports, pass across the parent ID as the parameter value.
To do this, save the report (for example, as "ragged1") and then save it again under a different name (for example, "ragged2"). Open up the first report again, then click on the Format icon (the little hand) on the Child name column, click on the Data Format tab, tick the "Override Default Data Format" checkbox, and enter the following text into the "Treat Text As" box (altering it for your particular username, query location and name of the second query you saved (i.e. "ragged2"):
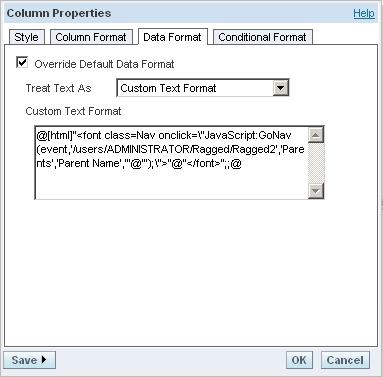
Be sure to alter this to the location you saved the second report, and the table and column names of the Parents table and column.
Open up the second report, add the same column data format, but this time remove the filter on distance from root and instead add an "Is Prompted" filter on the Parent Name, like this:
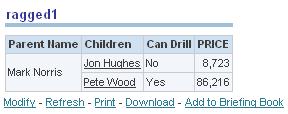
Now, when you run the first report, you are shown the top level and it's children, like this:
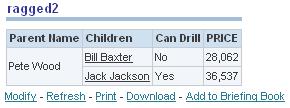
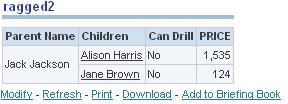
Clicking on any of the children where "Can Drill" is set to yes will recursively call the same, second report again setting the drilled-on child as the report parent, like this and this:
Other things you can do now are to add the reports to a dashboard and create dashboard prompts to filter on parent distance from root and/or parent name, or create additional reports for adding to the dashboard who's initial parent is filtered on the results of the other report. For now though, that's a basic way to model ragged hierarchies in the semantic layer and drill in to them using answers; hopefully later on (around 11g?) we'll see the proper, full OLAP version of Answers that's being referred to as "Answers Plus".
Tomorrow, and to wrap up the series - Aggregate Persistence.