Investigating the Oracle BI Management Pack for OBIEE and DAC
Although I posted the other week about having finished all my presentation writing, in fact I've actually been working on and off on a couple of fairly big demos. One, that I'll try and post about soon, is an attempt to get all of the EPM 11.1.1 (or even, EPM 11.1.1.1) software up and running and integrated with OBIEE; the other is about getting the new BI Management Pack installed and running alongside OBIEE and the Oracle BI Applications.
The basic premise with the BI Management Pack is that it comes with Oracle Grid Control 10.2.0.4 and allows you to manage your BI infrastructure as well. Price-wise I think it adds about $11k to the standard $260k (list price) for OBIEE and it's already pre-installed if you patch Grid Control up to 10.2.0.4, from the standard 10.2.0.1 version that's on OTN. Once you apply the patch you then have to make sure the Usage Tracking and Scheduler tables are installed and configured for OBIEE, there's an additional JMX agent to get running so that OEM can check all the OBIEE counters and so on, and then you can go through the "discovery" process detailed in the docs to register your OBIEE and DAC components.
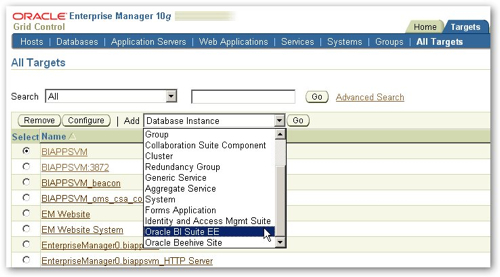
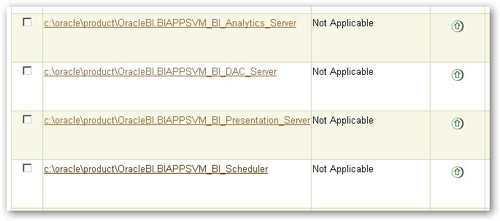
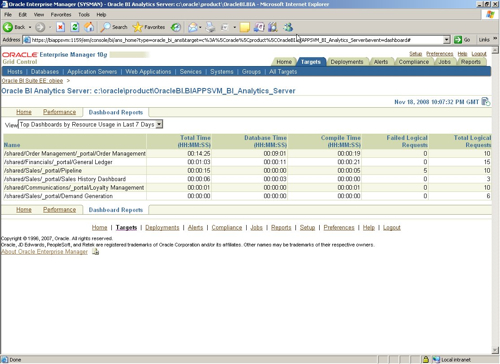
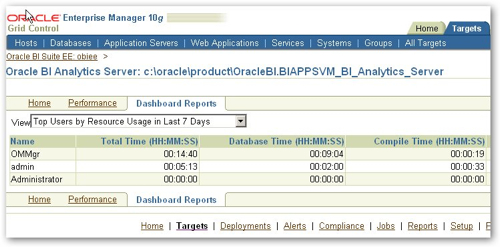
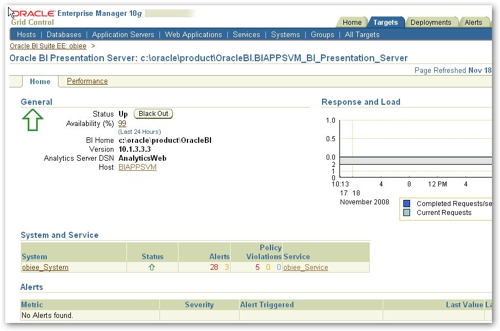
Once you've set everything up, you access the various OBIEE components by initially selecting the host they're on, and then locating the "targets" in the host's list, like this:
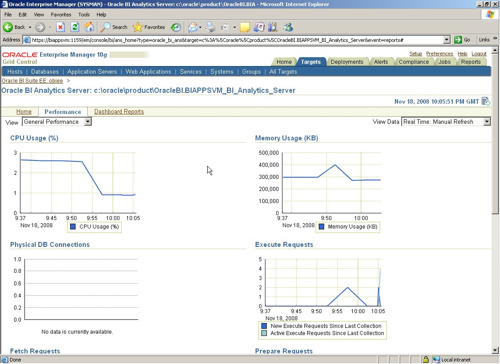
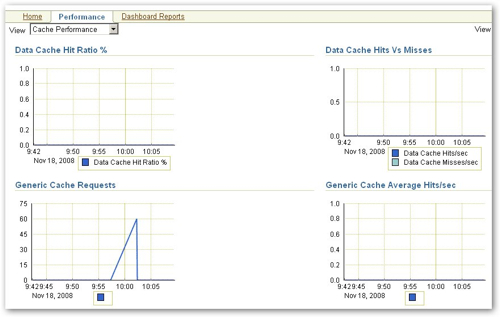
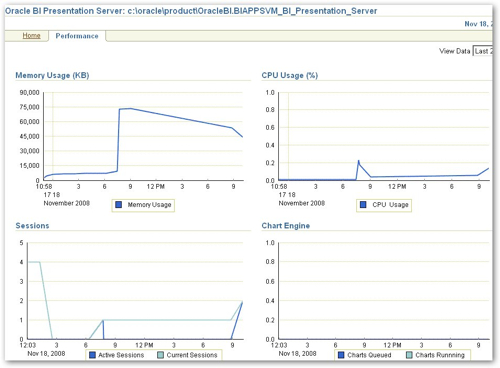
The overview for the BI Server shows the general CPU usage, memory usage and so on of the BI Server process. You can also use this page to get a general overview of how "busy" the BI Server is, either currently in minute or so intervals, or over the past day, seven days or so on.
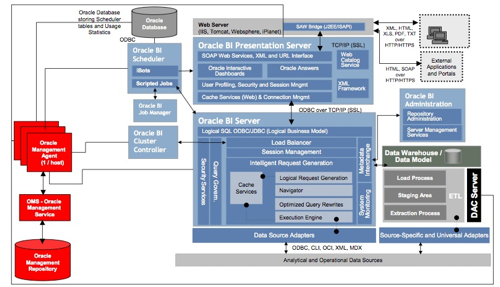
If you think about your complete Oracle BI stack - going from storage, through to the database, application server and then the various OBIEE servers, then you can see how a tool like this can help you manage performance and your architecture from top to bottom. If you get the classic request from users - "the system is running slow, can you take a look and find out what's up?" - well with a system like this, if Grid Control in the future links together the reports that are running, with the application server session that hosted them, with the database query that provided the data, combined with the self-tuning (ASH, AWR etc) bits of the database, plus the diagnostics and so on that are in ASM and the general storage layer, well you can really imagine being able to trace a query through from report through to the underlying server system and understand just exactly where the time is going. I don't think we're quite there yet, the reports that the BI Management Pack produces are a bit simple and somewhat disjointed, but if the product management team start adding in the sort of advisors that we get from the database side - perhaps an "Aggregate Storage Advisor" that recommends aggregate tables or even Essbase cubes, then passes the details through to the Aggregate Persistence Wizard to create the required summaries; maybe a cache advisor that recommends caching, maybe even a request performance wizard that recommends changes to the underlying data structures including the addition of indexes or materialized views, well, that would be very interesting.
Of course this is all potentially quite a while off, so my next task is to come up with some sort of approach where we can use what's currently in the BI Management Pack, along with the various database advisors and application server reports to try and diagnose and improve the performance of queries today. I'm actually writing this up as an article for OTN, so keep an eye out after Christmas and hopefully I'll come up with some good guidelines and a simple methodology so that you can start using this interesting new addition to Grid Control 10gR4.