Thoughts on Optimizing the Oracle BI Apps ETL Process
This week I'm working with one of our customers who are in the first phase of implementing the Oracle BI Applications. We're still in the proof of concept phase, and something we'll need to get sorted out before embarking on the project proper is the time that the ETL process takes to run. At the moment it's taking the best part of 48 hours to do a full load, and whilst in practice we'd mostly refresh the warehouse using incremental loads, if we're going to get our development area up and running and able to refresh the development database within a reasonable time, we need to get this down to something more like 12 hours.
Now I happen to know that around half of this time is taken up by loading a specific subject area (Accounts Payable), and so strictly for development processes we could of course leave this area out and bring the time to refresh down considerably. But setting this option aside for a moment, how do you go about "tuning" the Oracle BI Apps ETL process? Where do you start, what are the most obvious opportunities to bring the time down, and how do you work out what needs tuning in the first place? Setting aside the customer's particular system aside for a moment, I fired up my BI Apps environment on my laptop, loaded up the Order Management subject area and started a full ETL load.
Whilst the load was running, I gave some though as to how I'd approach a BI Apps ETL tuning exercise. Now at the end of the day, whilst there's lots of technology involved in the BI Applications, firstly it's still an ETL process, and secondly it's based around a database, some transactions, some concurrent processes and things that contribute to response time, so it's not going to be too different to tuning any old generic ETL process. Anecdotally, I've heard that there are a fair few specific opportunities to speed up the BI Apps ETL process, including reducing the sample percentage for statistics gathering; removing multi-column key constraints from target fact and dimension tables; "improving" the SQL used to extract from the source tables; ensuring all bitmap indexes are removed from table before they are loaded, and so on. But rather than diving in and trying out lots of options (the old "guess and grimace" approach), its worth taking a more methodological approach to the tuning exercise:
Firstly, we should understand the business context of the ETL process. What subject areas are being loaded (and are they all necessary?). Over how many months and years is the ETL process running (and do we need to go back this far?). Are we doing a full load when it's more realistic to consider incremental loads (i.e. are we worrying unnecessarily?). Which organizational units are being loaded into the warehouse (and do we need to load as many?) ... and so on. Also, let's set the objectives for the tuning exercise - how quickly does it need to load (in hours, minutes); or is the objective to reduce the load time by a certain percentage? Maybe the requirement is not so much around time, maybe it's about reducing the impact of the ETL process on the server, maybe reduce disk I/O or something like that.
Then we need to gather some basic information on the environment. What hardware is the Informatica server running on, in terms of CPUs, RAM, dedicated usage vs. shared with other software. My customer has the Informatica server running on a Unix box, whilst I've got it running along with the rest of the BI Apps stack on a single CPU VMWare virtual machine. How are the source and target databases configured? Are they shared with other applications, how are the disks arranged? Does the target database run in archivelog mode, is it sharing disks with the ERP system and so on? Do we have any statistics or diagnostics for the database (Statspack, AWR etc) or the server hardware to give us a feel for the load generated by the load process. All of these questions may provide more obvious answers on how to speed up the ETL process without having to resort to sifting through Informatica mappings and ETL execution plan timings.
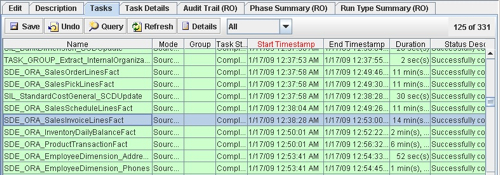
Now for my testing setup, everything's running on a virtual machine on my laptop, so there's not really much point in trying to optimize my environment, but when I work with the client tomorrow, certainly the first thing I'd think about is whether the environment is obviously going to contribute to a slower than expected load time, and whether we can move it to a dedicated server and disks, for example, to reduce the effects of contention. But for now I've got to work with what I've got, and so the first place I'd look for opportunities to speed things up is the timings for the execution plan I just ran. I can get these from the DAC Console, and the first thing I do is bring up the list of ETL steps and sort them in duration order, with the ones taking the longest time shown at the top. These are the obvious candidates to try and optimize as they make the largest contribution to "response time".
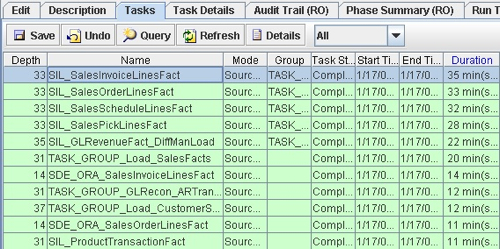
Looking at the list above, there are four SIL (Source-Independent Layer) mappings that took around 30 minutes or so to run. There's another that took 22 minutes, and then two SDE (Source-Dependent Extract) mappings that took 14 and 10 minutes to run. Working down the list, most of the mappings then took 10 minutes or less to run, with the vast majority taking less than a minute. So if I'm looking to make a difference to the total time taken by the ETL process, it'd make sense to focus on the top five or so mappings in this list.
Each one of the entries in this list are actually tasks that can contain a number of different steps, the main one of which is the Informatica mapping of the same (similar) name and the rest being steps to enable and disable indexes. Looking at the SIL_SalesInvoiceLinesFact task, you can see that it breaks down into a number of index drop commands, the SIL mapping itself and a couple of steps to recreate indexes.
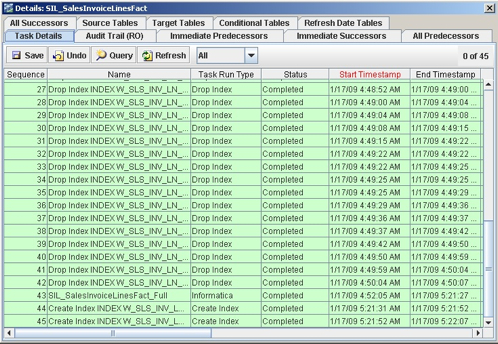
What these index steps do is drop all of the bitmap indexes on the fact table prior to the load, and then recreate just the indexes required for the ETL process after the mapping has executed. So in theory this should mean that the load into the fact table is as efficient as possible, although it's still worth checking to see if constraints are still on the table and enabled through the load process. But in theory, this doesn't look like an unreasonable approach.
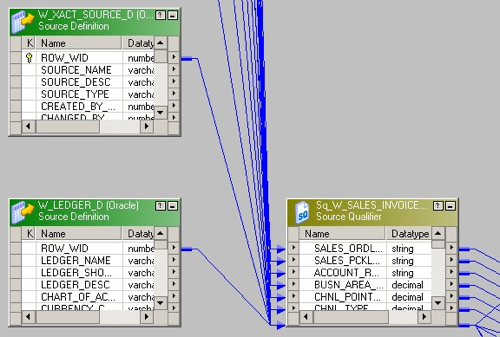
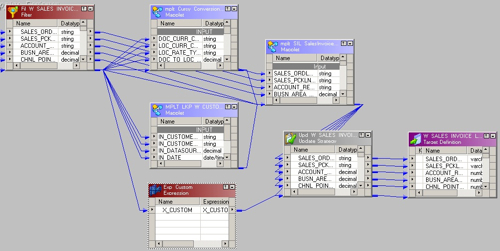
So if we think the handling of the table in terms of indexes and so on is being done correctly, it's worth taking a closer look at the mapping to see what's going on. Opening up the Informatica Designer application, SIL_SalesInvoiceLinesFact_Full is a fairly standard SIL mapping, with a bunch of dimension tables being joined to the fact source (_FS) tables via a Source Qualifier transformation, to retrieve the surrogate keys from the dimensions, like this:
Firstly, run the mapping outside of the DAC execution plan, to see if it takes the same amount of time to run as in the execution plan timings.
If it does, then try and reproduce the main gist of the mapping in a single SQL statement; i.e. join all of the source tables through a SELECT statement, and then INSERT the data into the target table. Doing this should give me an idea as to how much Informatica, and the transformations contained within the mapping, add to the "raw" time needed to extract the data and load it into the target table.
If this doesn't shed any clues, then I could try replacing the source table with a flat file containing all the data, then rerunning the mapping with the file as the source. If there's a huge discrepancy in time, then this probably means that I've got some opportunity to bring the time of "extract" down, perhaps by optimizing the SELECT statement, perhaps adding extra indexes, maybe a materialized view or something like that.
Again if nothing so far has jumped out as being unusual, I could repeat this step with the target table, again replacing the target with a flat file and seeing whether that is much faster to load. This could point to the target database being slow, or perhaps there are constraints or indexes on the table that are slowing things down.
Once I've eliminated the obvious, then it's worth looking at the less obvious. Most of the SDE and SIL mappings provided with the BI Apps follow the same set of steps, so it's unlikely that there's anything particularly slow about the transformations in this mapping compared to any of the others, but its worth checking some of the memory settings used by Informatica to see if these make sense, and you can run mappings with the "Collect Performance Data" option turned on (more on this in a later blog post, and the Informatica memory and parameter settings), but for me, given that this is a standard mapping and the obvious fact that these are the main fact table loads, and that is why they are probably taking the most time, it doesn't seem to me that there's much point in fiddling around with Informatica settings at this point.
Starting with the first step on the list, I copy the mapping to a custom Informatica folder, set up the required parameters file and run the mapping outside of the DAC. Interestingly, run standalone it takes only 3 minutes or so to run (the failed steps before the successful one are where I didn't have the parameters file set up correctly).
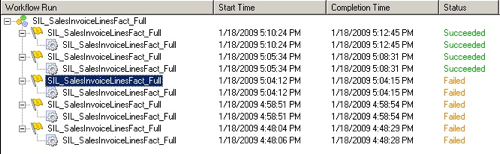
So that's interesting. Run standalone, the mapping only takes three minutes or so to run. Could the problem be contention? Taking a look back at the DAC Execution Plan timings, I can actually see that this mapping ran at the same time as the other fact table mappings, with all of them starting at the same time and taking around 30 minutes to run.
So on the "Occams Razor" principal (the most likely answer is probably the simplest one), my guess at this stage is that the reason these mappings run slow is that (a) they are the fact table mappings, they deal with a lot of data and therefore they take more time, and (b) they're all running at the same time, on a single CPU system, and so they are taking a correspondingly long elapsed time to run. Looking at the SDE mapping that corresponds to this SIL mapping, again we can see that it's taking the longest amount of time for an SDE mapping (14 minutes) but this time only two mappings are running at once.
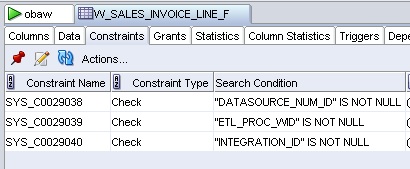
Now don't get me wrong, there could still be some opportunities to speed up these particular mappings. Although indexes are dropped prior to the load, what about constraints? Taking a look at the fact table using SQL*Developer, you can see that the only constraints are NOT NULL ones, so again there's nothing obvious here to cut back on, except perhaps to make these constraints RELY NOVALIDATE, which might shave a bit of time off.
I mentioned earlier on about the anecdotal story around table and index statistics gathering having the sample percentage set too high? Is this is possibility? Well if you look around various tasks in the DAC repository, you'll see that may of them have statistics gathering steps, and the particular SQL used on your particular database platform is determined by a file call "customsql.xml" that's in the $DAC/CustomSQLs directory. In this file are some code templates, one of which is for table statistics gathering on Oracle 8 and higher, another is for indices on Oracle 8 and higher.
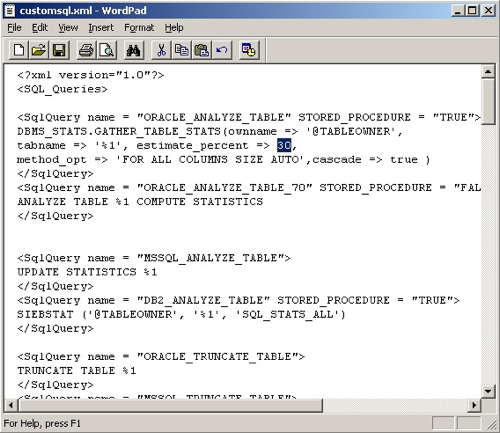
So 30% is the standard sample size for tables (and indexes, later on in the file), so there's a possibility here of taking this down to, say, 10% and cutting the time required to do statistics gathering across the load. Also, as this file also defines the SQL used for create indexes an obvious next step is to tell the DAC to create indexes using NOLOGGING, however this is already how they're specified in the file so that's already taken care of.
To summarize then, from what I can see so far the following appears to be the case:
The DAC process seems to drop indexes before fact table loads as you would expect
There's a possibility of bringing down the sample size for statistics
Smaller servers (database, informatica hosts) can suffer from contention when tasks automatically run in parallel
The seeded mappings appear to be reasonably efficient, though I've not looked at these in particular detail
It's worth running your mappings individually, and with flat files substituting for source and target tables, to get some idea of the baseline time required to move data around
If you're going to run with the mappings "as is", probably your best opportunities to bring down the ETL time are to firstly, ensure your servers can cope with the parallel ETL processes; secondly, make sure you are only loading the data and subject areas you really need to; thirdly, ensure your source and target databases run as fast as possible, and fourthly, perhaps tinker around some of the database elements such as reducing statistics sample size, placing your database in noarchivelog mode and ensuring no other large jobs are going on at the same time.
If this isn't enough though, and you're prepared to roll up your sleeves, pop up the hood and really start getting under the covers of the BI Apps ETL process, there is one other area that I think you could look at to bring the time down further, which is around how the BI Apps handles aggregates.
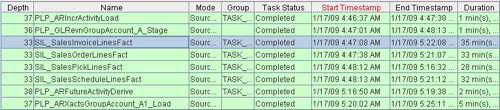
Because the BI Apps are "target database independent", they don't use any Oracle-specific features such as Materialized Views; instead, aggregates are recreated during each ETL run in the PLP (Post-Load Processing) mappings and stored in regular tables with an "_A" suffix. Looking back at our particular execution plan, you can see the steps used to create the aggregates below.
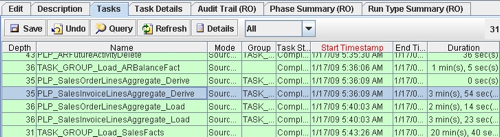
In this particular run, they took up 10 minutes or so of time to run, over an elapsed 2 or 3 minutes. Not much (and certainly not as much times as the original fact tables took to load), but it shouldn't be too tricky to take the SQL out of the Source Qualifier in the relevant PLP mappings and use this to create a fast refresh materialized view of the same name as the aggregate table, which the PLP mapping could then refresh (via a stored procedure transformation) rather than perform it's original aggregate table load. I'll certainly give this one a try if aggregates are a big part of the customer ETL process.
So that's my thoughts for now. I'll do another blog posting in time to talk about the various settings you can use for Informatica, how you can set up clustering, partitioning and so on to take advantage of more server resources if they are available. For next week though, I suspect the major time reductions will come from cutting down the amount of data we load, bringing down the statistics sample size, perhaps replacing the aggregates with fast refresh materialized views, and possibly fiddling around with how many tasks run at the same time if contention appears to be an issue (and serializing the tasks actually makes the overall elapsed time come down). I'll do a follow-up blog post at the end of the week, but in the meantime if anyone else has any tips on making the standard BI Apps ETL process run faster (on an Oracle database), be sure to add them as comments to this post.