Using Perfmon.exe to Monitor OBIEE on Windows
The vast majority of customers I come across that use OBIEE run the platform on Linux or Unix. For those that run it on Windows though, what tools do you have to monitor the performance of the platform? One of our customers is in just this situation as they are running Oracle BI Standard Edition One, which is limited to Windows as a host platform, and so a tool we'd use in this situation is "Perfmon".
Perfmon (short for Performance Monitor) is a utility that's shipped on Windows since the days of NT4.0 and is commonly used by Windows sysadmins to keep an eye on the characteristics of their system. You can use it to monitor hundreds of different metrics, such as processor usage, memory usage and disk usage, and you can connect it to the OBIEE binaries to find out more about your BI system.
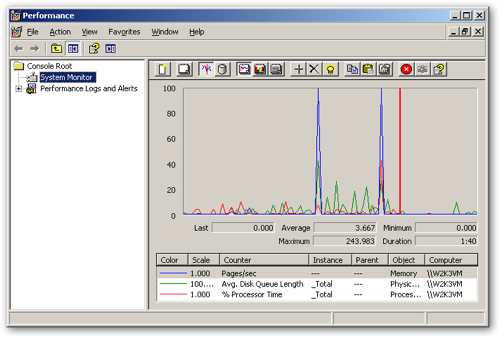
I'm running Oracle BI EE on a Windows 2003 server, and to start taking a look at this feature I start Perfmon from the start menu (Start > Settings > Control Panel > Administrative Tools > Performance), or I can just type in perfmon from the Windows command line. The utility initially comes up like this:
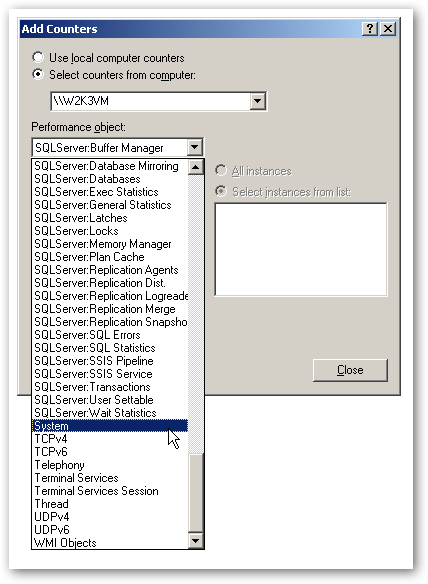
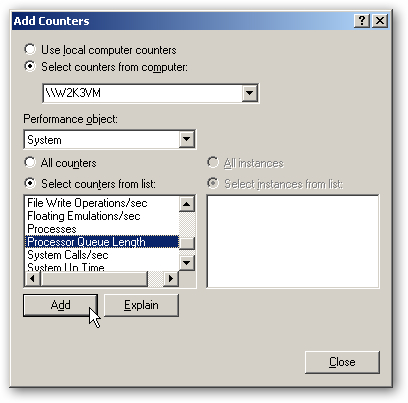
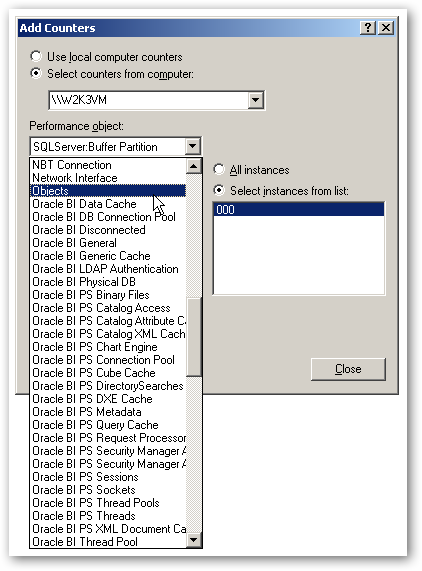
To start with, I"m interested in some more general indicators of the load on my system. Do add more metrics, I click on the "+" button in the middle of the application toolbar to add a new counter. This brings up a dialog that lets me initially select a Performance Object, which is typically a part of an application or a general Windows area such as as System.
- Memory > Pages Input/Sec (a good indicator of whether the system is memory-bound, shows the rate at which pages are read from disk to resolve hard page fault, and should generally settle at zero)
- Physical Disk > Current Disk Queue Length > drive letter (together with the above, a good indicator of excessive disk usage. Single disks should report a figure of 2-3 or lower, divide this by the number of disks if in a RAID array. A high figure for the above metric may indicate swapping due to lack of memory, these two together typically show whether systems are RAM and I/O bound)
- Network Interface > Output Queue Length > nic card name (shows whether the network is overloaded, look for more than 2 packets waiting for transmission to indicate the possibility of a network bottleneck)
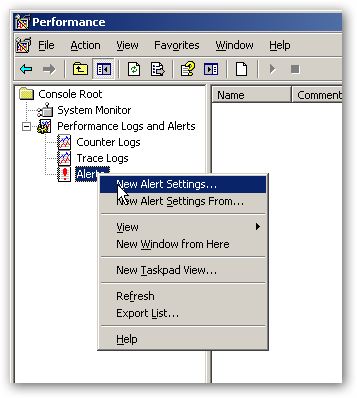
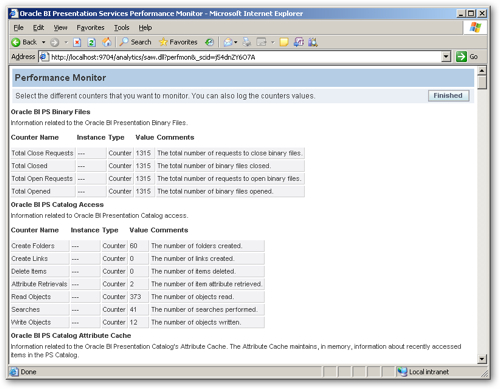
If you go back to the point where you add new counters, you'll notice that on a system with OBIEE installed, there are a bunch of performance objects specific to the server components of OBIEE.
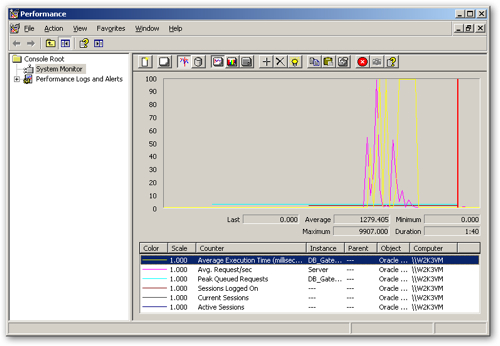
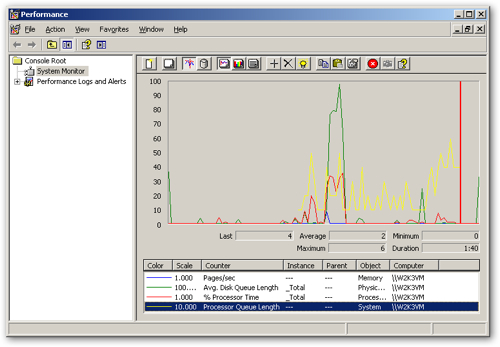
So let's take a look at some OBIEE metrics. To keep things simple, I delete the existing counters from the Perfmon window and also switch to the Histogram view, so that I can see the metrics as a vertical bar chart. I then add the following two BI Server metrics to the window:
- Oracle BI Thread Pool > Avg. Request/Second > Server
- Oracle BI Thread Pool > Average Execution Time (milliseconds) > per BI Server connection pool
- Oracle BI Thread Pool > Peak Queued Requests
- Oracle BI PS Sessions > Sessions Logged On
- Oracle BI PS Sessions > Current Sessions
- Oracle BI PS Sessions > Active Sessions