With all the noise and publicity around the OBIEE 11gR1 launch, it's easy to miss the fact that BI Publisher has also had a major revamp as part of the 11gR1 release. We saw a bit of a preview of this earlier in the year with the online template builder that was available in preview form for 10.1.3.4, but the 11gR1 release takes this further and adds a lot of new visualization features to the product.
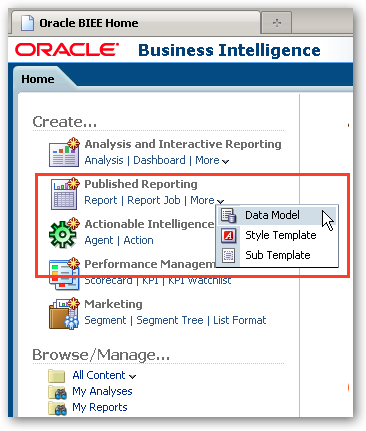
BI Publisher 11gR1, like the 10g release, comes as either a standalone install or as an integrated part of OBIEE 11gR1. If you're working with OBIEE 11gR1, you can get to BI Publisher either through the Published Reporting links on the left-hand side of the home page, like this:
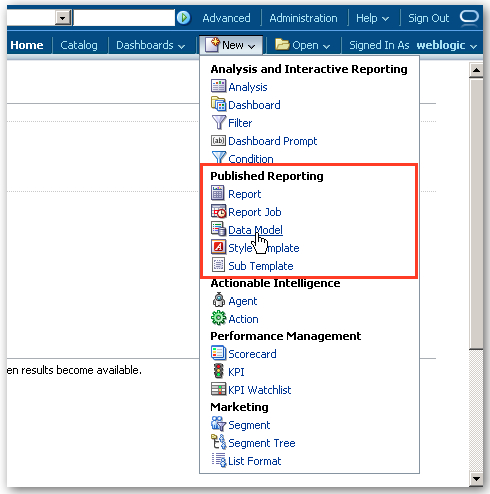
or you can create the various elements of a BI Publisher report directly from the New... menu in the common header area of the OBIEE 11gR1 user interface, like this:
If you've used BI Publisher in its previous releases, you'll probably know that a BI Publisher report consists of three things:
- The data query, which can typically be an SQL query, an MDX query, a web service call an HTTP call
- One or more data templates, which lay out the results of the query on the page, and
- The report definition (stored as an .XDO file), which references the query and the templates together with parameters, LOVs etc
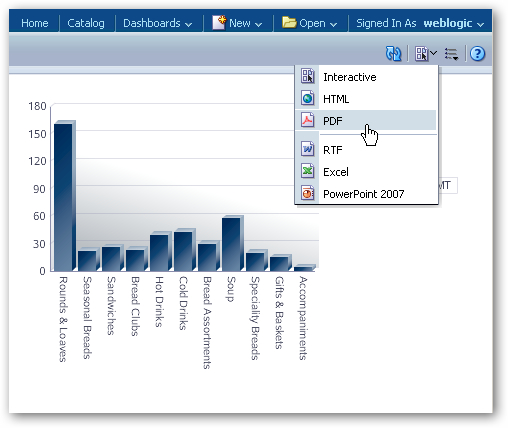
These elements are combined at runtime with the data itself, and the template is used to output results as a PDF, RTF file, Excel output, HTML and so on. BI Publisher complements Oracle Answers and Oracle Discoverer as it gives you more control of the format of the output, lets you combine queries and formats on a single page, handles things like bursting, page breaks and mass distribution, and is generally used when you want to "publish" something for use outside of the BI tool environment rather than query the data interactively on screen. Being candid, probably one of the weaknesses of BI Publisher in the 10g release was its reliance on using Microsoft Word as the template editor, and the limited functionality you got when you viewed the report output on screen using a web browser, and these are in fact two of the main areas addressed in the 11gR1 release.
BI Publisher 11gR1 amends this three-element report model to add a bit more granularity and functionality to the report definition. In 10g, the data model was defined as part of the report definition, whilst in 11gR1 it's a separate object that can be re-used across multiple report definitions. If you're running BI Publisher 11gR1 integrated with OBIEE 11gR1, report definitions (including the data model, templates and the definition itself) are stored in the web catalog along with Answers analyses, Agent definitions, dashboards, KPIs and scorecards, keeping everything in one place. There's also now the concept of style templates and sub-templates, something that'll be useful for organizations churning out lots of reports with a similar look and feel and with re-usable, modular elements.
It's in the web area though that the most significant improvements have been made in 11gR1. Templates can now be created and edited online, removing the dependency on Microsoft Word or other offline template editors. There's a new Interactive Viewer that allows you to view and interact with reports online, in an environment that has echos of BI tools like Qlikview. Templates created with the Online Template Builder and viewed using the Interactive Viewer can take advantage of the same ADF DVT graphing and visualization engine used by OBIEE 11gR1, giving a consistent look and feel to reports across both products. There's also a new data model editor that makes it easy to create federated queries across multiple data sources, making BI Publisher 11gR1 standalone an interesting alternative to OBIEE 11gR1, especially considering the new interactive web features. So how does this all work when you want to create a new report?
In this example, I have some sales data from our stores that details revenue and activity across products and time periods. I would like to use BI Publisher to create a report that has a single query against this dataset, and uses three templates to show
- Product revenue and sales counts in the form of a crosstab and a graph
- Sales and profit breakdown in a graphical form, with a way for the user to interactively "drill-into" the data
- A formal document I can print-off and send to store managers, in the form of a PDF
The data I'm looking to report against is stored in an Oracle database, and so after setting up the data source connection in the BI Publisher 11gR1 Administration screen, I can start by creating a new data model. Now if you've used the 10g release of BI Publisher then this is quite a different approach to before, as firstly the data model is a separate object and secondly, the UI has changed considerably.
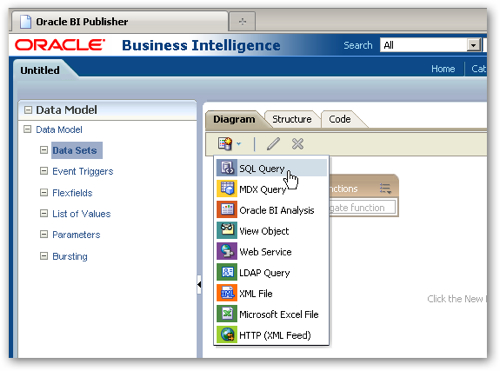
I start by creating a new data model, and then selecting SQL Query as the query type. Note also that I can use an Answers analysis as a data source, an MDX query (against Essbase, MS AS etc), an ADF view object, and Excel file and so on.
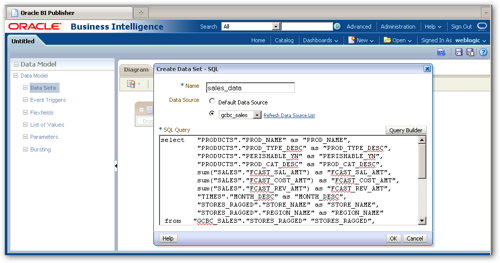
You then put the SQL query together in the same way as with 10g, with a visual query builder or the option to type in the SQL directly.
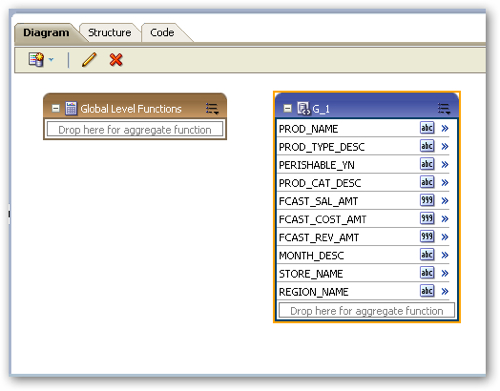
Once the query has been defined though, this is where things start to get different than BI Publisher 10g. The Data Model editor has three tabs, called Diagram, Structure and Code, that lets you fine-tune the output of the data model query and also combine data from multiple sources. The Diagram tab below gives me a visual view of the dataset, which at the moment consists of just the query I've just defined.
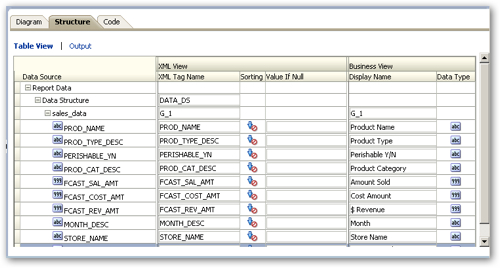
If I switch to the Structure tab, I can see the XML structure of the dataset, and can amend the "business" names of the output columns that will be displayed in the reports, as well as assign default values for NULLs, change datatypes, preview the output and so on.
The Code tab shows me the data model definition in terms of an XML document.
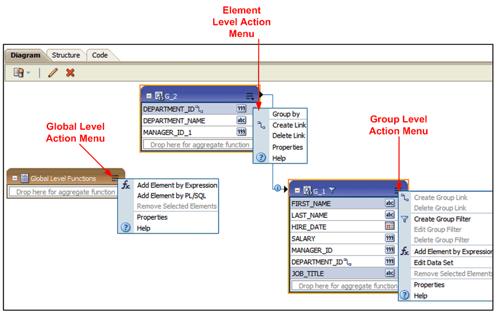
Now my data model is fairly simple and straightforward, but developers who've worked with the 10g release will know that it's possible to merge multiple queries into one data model, something that you can do either by just concatenating datasets or in a more sophisticated form through something called a data template. Data templates in particular were tricky to work with though as they had to be manually created in the form of an XML document, but the 11gR1 release makes this easier through the Diagram tab. Now the example I'm using has just a single query, but in the screenshot below (taken from the product documentation), we can see a data model that has multiple queries with joins created between them. You can take this further to define nested groups, aggregations that apply at various group levels, and derived columns based on fields in the dataset.
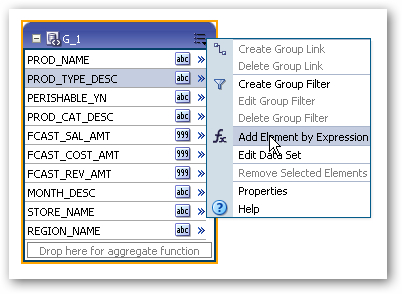
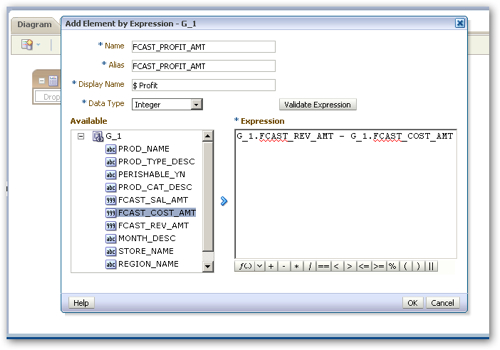
I'm going to use this diagram editor now, to add a derived "profit" field to the dataset based two of the other fields within it. I select the Add Element by Expression menu option for the query like this:
This then brings up an expression editor, where I can derive profit based on revenue less costs. After validating the expression, the new field is added to the query as a derived (function) field.
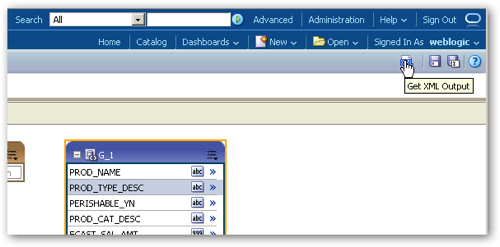
So now we're at the point where the data model query is defined. One final step thought that I need to perform, is to generate some sample XML output that can then be used by the Online Template Builder. This is the same as with the Microsoft Word Template Builder that came with 10g (and is still available with this release), that would extract a small sample dataset when you created the report template, so that you could see data in the template when you went to preview it. For this new data model editor, you create the sample XML dataset yourself, which gives you a good chance to sanity check the query output before going on to lay out the various templates.
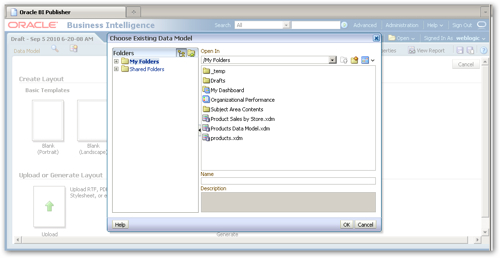
Now that I've defined the data model, I can get onto designing the templates. I select New > Report from the common header menu, and the first thing I'm prompted to do is to select an existing data model, like this:
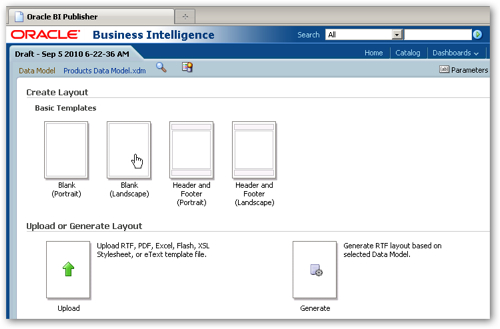
I select the data model I defined a moment ago, and then I'm prompted to select a layout base template. Now in 11gR1, there's a distinction between the RTF templates that you got with 10g and are usually edited using the Microsoft Word Template Builder, and the new-style templates you get with 11gR1 that are edited using the Online Template Builder (at the moment, there's no way to upgrade RTF templates to the online-style ones). I select the Blank (Landscape) basic template as my first reports are going to be viewed online, using the new Interactive Viewer.
This then brings up the Online Template Builder. I start by adding a page layout grid with a single row and two columns, and then I add a data table object, and a graph object, to the template so that it looks like this:
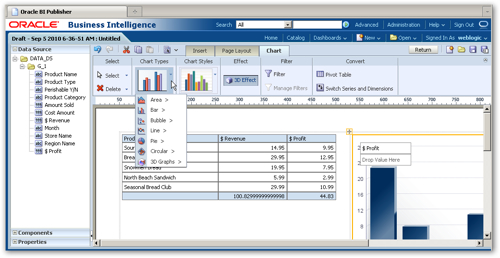
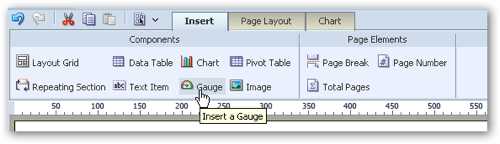
The 11gR1 release of the Online Template Builder gives us a few more visualizations, including gauges.
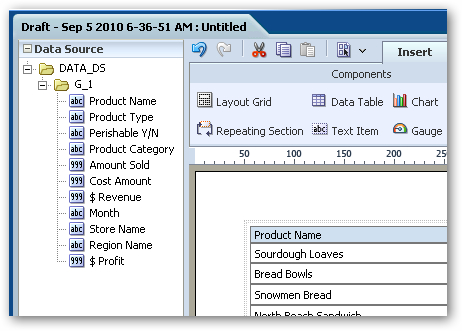
The Page Layout tab lets me set the page orientation, together with page breaks, headers and footers. The Chart tab is contextual and changes depending on the object you've got selected in the template. There's also a concertina-style menu on the left-hand side, which lets you see the available fields, like this:
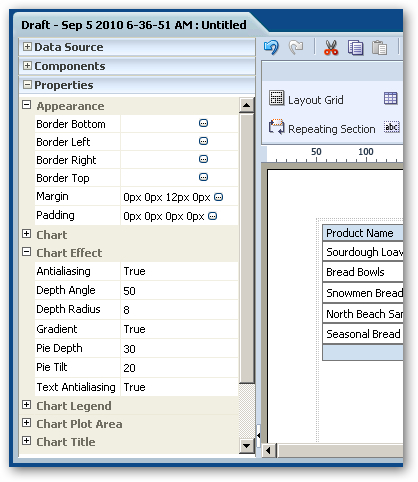
a list of all the available template objects, or the properties of the object should you wish to fine-tune it. The screenshot below shows the properties for the graph object in my template.
Once this template is complete, I give it a name and then save it to the report definition.
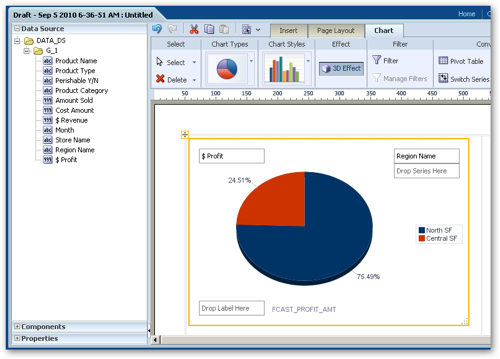
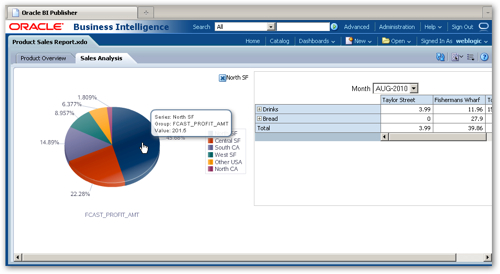
For the next template, I want to really try out the features in the new Web-based Interactive Viewer. I start by adding a pie chart, that shows the share of product sales profit broken down by region, like this:
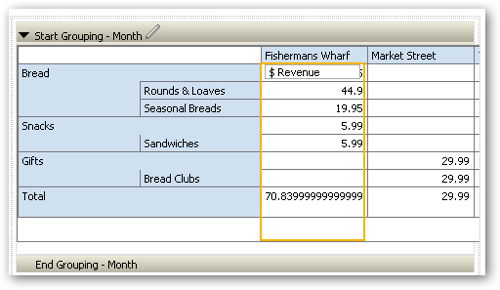
I then add a pivot table to the right of the pie chart, with a repeating group at the top that repeats on month, and the pivot table itself breaking sales revenue down by product category and type, and by store across the top.
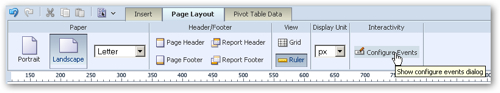
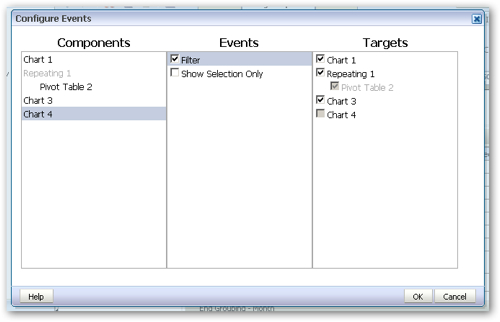
Now what I'd like to happen now, is for the user to be able to click on regions in the pie chart, and for this to filter the values in the pivot table I've just created. To do this, I switch to the Page Layout tab and press the Configure Events button.
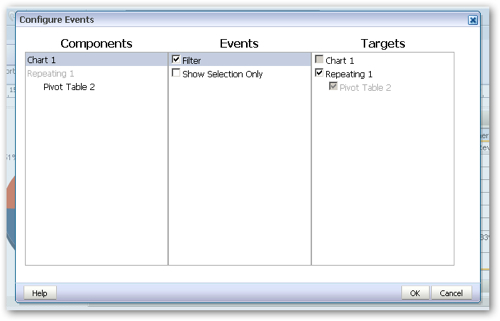
Using this feature, I can "wire" the output of the pie chart to the pivot table that I've just created, so that clicks on the pie chart will trigger filtering on the pivot table, in a similar way to master-detail linking in Answers 11g and of course, Qlikview.
Now when I run this report and template, the user can filter the entire report by clicking on segments in the pie chart, like this:
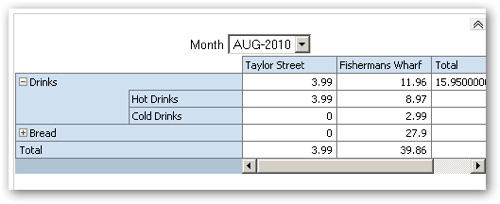
The pivot table is also dynamic, so that I can click on the Drinks category, for example, and see sales broken down by the various drink types.
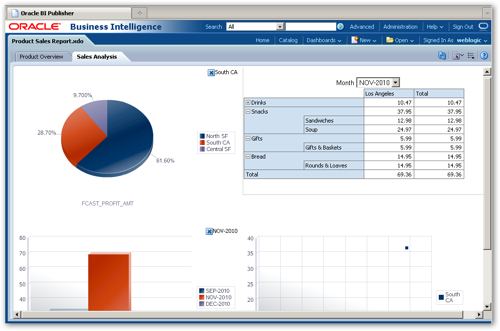
I can then go back to the template and add more visualizations, and wire all of these together so that changes in one act as filters on the others.
Bringing it all together and viewing it online, I've got an interactive web report that lets users drill-in to, and explore, their dataset.
Of course, it being BI Publisher, I've still got all the standard stuff such as printing to PDF, scheduling reports, bursting to separate files and so on, but these new features certainly add a new dimension to the product.
Coupled with the visual editor for federated datasets, BI Publisher 11g stands up in its own right as a reporting tool and would be an interesting option for customers on a more limited budget, but who want to buy into the whole Oracle Business Intelligence / Fusion Middleware reporting stack. No doubt we'll post more on the product as we start to roll it out on customer projects.