Oracle Exalytics : An Example Optimization Exercise
It's Saturday afternoon, and I'm writing this whilst on a plane going over to Dallas, Texas, traveling to what will be my first Hotsos Symposium. For anyone mainly working in the BI world who's not heard of the Hotsos conference, it (together with Miracle Openworld) was the inspiration for our own BI Forum event that runs each year in Brighton and Atlanta, and it focuses on performance and internals for, in this case, the Oracle database.
I'm coming over to speak about the new Oracle Exalytics In-Memory Machine, as I thought it might be interesting for Oracle DBAs who look after data warehouses and BI systems, and who might be interested in how this new addition to the "Exa-" family might complement Exadata and any work they are doing to try and make their data warehouses run faster. When I put the original abstract proposal in (just after the official launch of Exalytics in October 2011) I had though the product might have been out for a while and we'd have some benchmark figures to share, but in reality the product went GA ("General Availability") only last week, and we won't have our own box to play around with until the end of March. But in reality, whilst absolute numbers are of course useful, we're still able to demonstrate the general principle of how the in-memory layer speeds up dashboard queries using a "simulation" virtual machine that we've put together, and to this end I thought it'd be worth going through in a bit more detail how the Exalytics optimisation process works, something that I'll demo during my session at the conference next week.
So if you've been keeping up with the blog recently, you'd have seen a five-part Exalytics series that I published last week, that starts here with an overview and then, on day four, goes through the step-by-step Summary Advisor process that you'd go through to implement the in-memory aggregates. But, if you're like me, you're probably wondering what's going on when the Summary Advisor creates its aggregates, how these recommendations turn into actual TimesTen tables, and what goes on at the BI Server level before, during and after the optimisation process. Let's take a look then at a typical scenario, using the SampleAppLite dataset and dashboards that comes with all installations of Oracle Business Intelligence 11g, to see what sort of performance we might see before Exalytics, what sort of recommendations the Summary Advisor makes, and what sort of performance we could see afterwards. SampleAppLite is actually quite a good dataset to use as, in the background, the data for the dashboards comes from a set of XML files that, even on a single user system with no-one else using the dashboard, is pretty slow to return data in the first place. Also, it avoids us getting into the specifics of how any regular Oracle database source is set up, something I'd rather leave until we've got some actual real Exalytics hardware to test against.
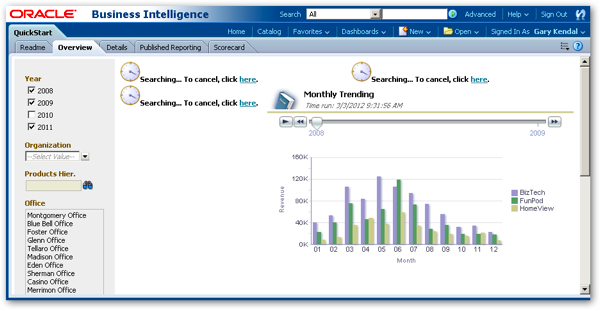
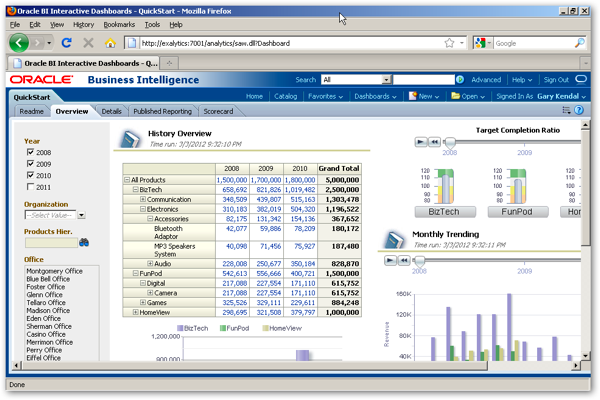
To start then, I'm logging on as a new user called "gkendal" that hasn't used this dashboard before, and therefore hasn't made any entries in the S_NQ_ACCT usage tracking table that I'll refer to later on to get query timings. When this user first logs on, all of the analyses on the various dashboards show the "searching" sign as data is retrieved from the XML data sources and formatted into the pivot tables, graphs and other dashboard objects. I've disabled query caching using Enterprise Manager so that the results are easier to interpret, but in practice you'd make heavy use of regular query caching even on an Exalytics system, as your "first line" of performance optimisation. Here's a typical dashboard when the user first logs in, with each analysis taking around five seconds to return their initial set of data.
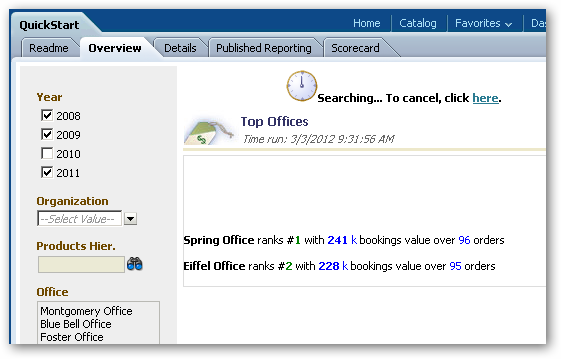
Every interaction that the user makes with the dashboard typically leads to a five to ten second delay as the data is retrieved, aggregated and then presented to the user, something that happens as they navigate around the dashboard, or change prompt values such as here, where the default selection of year checkboxes has just been changed:
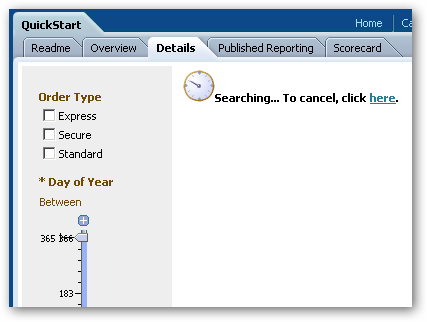
Switching to another dashboard page, again it's around five seconds or so before results are returned to the user, something that as developers we might not notice, but to end users can put them off using the system if every interaction has this delay.
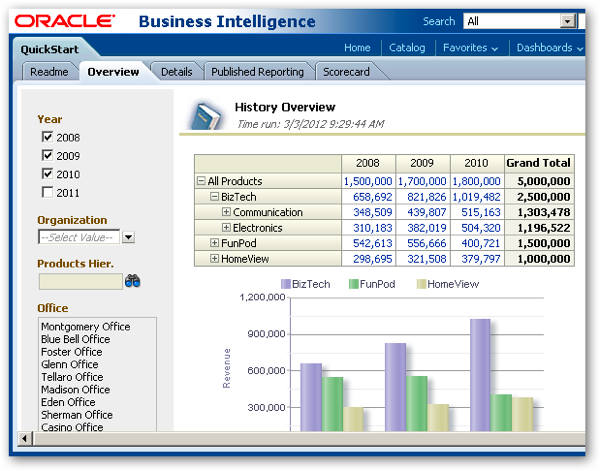
Once the initial queries are run, results are shown to the user and they can then further explore the data. Drilling into the pivot table below though has a two-to-five second delay for each drill, as the BI Server sends queries back to the underlying database and then combines the data back into the single view, complete with totals and sub-totals.
Typically. as developers and DBAs, we're usually pretty pleased with ourselves as this point, as before the data warehouse came in there were no dashboards, and what queries were run would typically take five-to-thirty minutes to run, and didn't bring in all of the related data that the data warehouse now makes possible. But even with the work we've done, queries typically take a few seconds to return data, sometimes up to thirty seconds if lots of aggregation is required, and all of this adds-up for end-users who just want to click around their data set and see results instantaneously.
Looking at the usage tracking data for this user, we can see that for the main "History Overview" analysis on the first dashboard page, we're typically seeing response times of between two and six seconds, as the user drills-down through the hierarchies and changes filter prompt values:
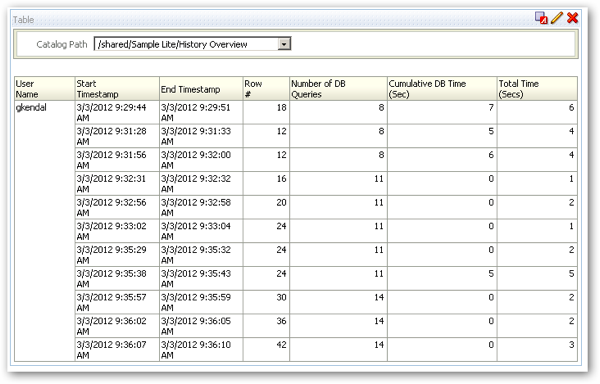
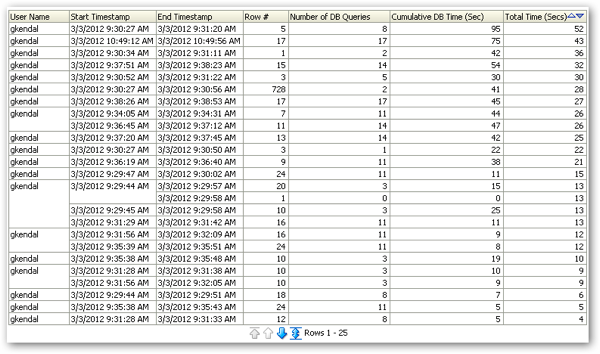
Whilst if we look at his usage across the whole dashboard, we can see some pretty long response times as filter values are changed and the user clicks over the various analyses.
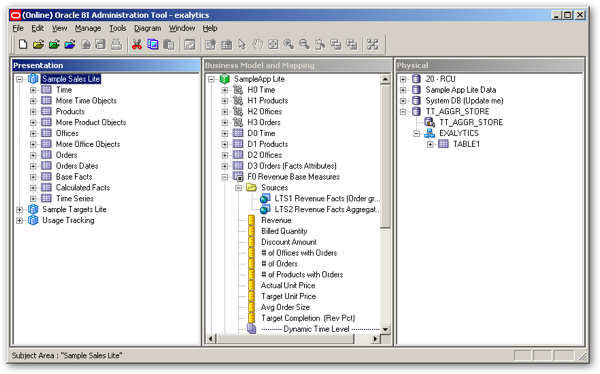
So let's imagine now that we've ported this system over to Exalytics, and we're now going to run the Summary Advisor and create some in-memory aggregates in the TimesTen database to try and get these interaction down to sub-second response times. Looking at the repository before the exercise, you can see the SampleAppLite business model and corresponding subject areas, and the default logical table sources that map through to the underlying XML data sources. As well as the XML source data, you can also see the link through to the TimesTen database, which initially just has a test table registered so we can check connectivity through the TimesTen client software.
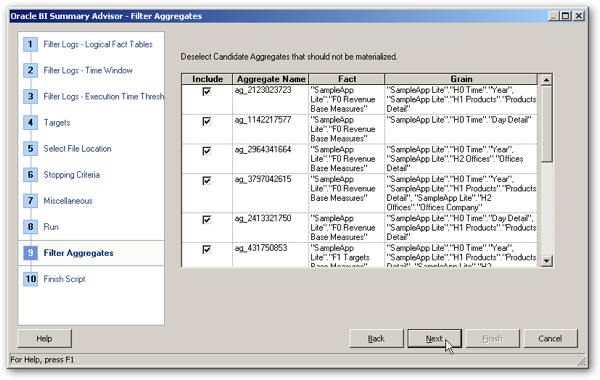
Running the Summary Advisor (see this previous post for a step-by-step walkthrough of the whole process) brings up eleven recommendations for summary tables, based not only on this user's usage of the system but all of those before him, though you can always limit the recommendations to a particular range of time or set of fact tables.
So with the script created by the Summary Advisor now transferred onto my workstation's filesystem, I now now move over to the command-line and use the nqcmd.exe utility to execute this again the BI Server's ODBC client interface. Let's run the script and go through what it does.
Microsoft Windows [Version 5.2.3790]
(C) Copyright 1985-2003 Microsoft Corp.
C:\Documents and Settings\Administrator>cd C:\obi_client\oraclebi\orahome\bifoun
dation\server\bin
C:\obi_client\oraclebi\orahome\bifoundation\server\bin>nqcmd.exe -d exalytics -u
biadmin -p welcome1 -s c:\summary_advisor_scripts\agg_wiz.sql
Oracle BI ODBC Client
Copyright (c) 1997-2011 Oracle Corporation, All rights reserved
delete aggregates
"TT_AGGR_STORE".."EXALYTICS"."ag_2123023723",
"TT_AGGR_STORE".."EXALYTICS"."ag_1142217577",
"TT_AGGR_STORE".."EXALYTICS"."ag_2964341664",
"TT_AGGR_STORE".."EXALYTICS"."ag_3797042615",
"TT_AGGR_STORE".."EXALYTICS"."ag_2413321750",
"TT_AGGR_STORE".."EXALYTICS"."ag_431750853",
"TT_AGGR_STORE".."EXALYTICS"."ag_2004446634",
"TT_AGGR_STORE".."EXALYTICS"."ag_2050457157",
"TT_AGGR_STORE".."EXALYTICS"."ag_2164440472",
"TT_AGGR_STORE".."EXALYTICS"."ag_972974199",
"TT_AGGR_STORE".."EXALYTICS"."ag_792297804"
Statement execute succeeded
create aggregates
"ag_2123023723"
for "SampleApp Lite"."F0 Revenue Base Measures"("Revenue","Billed Quantity","Di
scount Amount","# of Offices with Orders","# of Orders","# of Products with Orde
rs")
at levels ("SampleApp Lite"."H0 Time"."Year", "SampleApp Lite"."H1 Products"."P
roducts Detail")
using connection pool "TT_AGGR_STORE"."TT_AGGR_STORE"
in "TT_AGGR_STORE".."EXALYTICS",
"ag_1142217577"
for "SampleApp Lite"."F0 Revenue Base Measures"("Revenue","Billed Quantity","Di
scount Amount","# of Offices with Orders","# of Orders","# of Products with Orde
rs")
at levels ("SampleApp Lite"."H0 Time"."Day Detail")
using connection pool "TT_AGGR_STORE"."TT_AGGR_STORE"
in "TT_AGGR_STORE".."EXALYTICS",
"ag_2964341664"
for "SampleApp Lite"."F0 Revenue Base Measures"("Revenue","Billed Quantity","Di
scount Amount","# of Offices with Orders","# of Orders","# of Products with Orde
rs")
at levels ("SampleApp Lite"."H0 Time"."Year", "SampleApp Lite"."H2 Offices"."Of
fices Detail")
using connection pool "TT_AGGR_STORE"."TT_AGGR_STORE"
in "TT_AGGR_STORE".."EXALYTICS",
"ag_3797042615"
for "SampleApp Lite"."F0 Revenue Base Measures"("Revenue","Billed Quantity","Di
scount Amount","# of Offices with Orders","# of Orders","# of Products with Orde
rs")
at levels ("SampleApp Lite"."H0 Time"."Year", "SampleApp Lite"."H1 Products"."P
roducts Detail", "SampleApp Lite"."H2 Offices"."Offices Company")
using connection pool "TT_AGGR_STORE"."TT_AGGR_STORE"
in "TT_AGGR_STORE".."EXALYTICS",
"ag_2413321750"
for "SampleApp Lite"."F0 Revenue Base Measures"("Revenue","Billed Quantity","Di
scount Amount","# of Offices with Orders","# of Orders","# of Products with Orde
rs")
at levels ("SampleApp Lite"."H0 Time"."Day Detail", "SampleApp Lite"."H1 Produc
ts"."Products Detail")
using connection pool "TT_AGGR_STORE"."TT_AGGR_STORE"
in "TT_AGGR_STORE".."EXALYTICS",
"ag_431750853"
for "SampleApp Lite"."F1 Targets Base Measures"("Target Revenue","Target Quanti
ty")
at levels ("SampleApp Lite"."H0 Time"."Year", "SampleApp Lite"."H1 Products"."P
roducts Detail", "SampleApp Lite"."H2 Offices"."Offices Company")
using connection pool "TT_AGGR_STORE"."TT_AGGR_STORE"
in "TT_AGGR_STORE".."EXALYTICS",
"ag_2004446634"
for "SampleApp Lite"."F0 Revenue Base Measures"("Revenue","Billed Quantity","Di
scount Amount","# of Offices with Orders","# of Orders","# of Products with Orde
rs")
at levels ("SampleApp Lite"."H0 Time"."Day Detail", "SampleApp Lite"."H2 Office
s"."Offices Company")
using connection pool "TT_AGGR_STORE"."TT_AGGR_STORE"
in "TT_AGGR_STORE".."EXALYTICS",
"ag_2050457157"
for "SampleApp Lite"."F1 Targets Base Measures"("Target Revenue","Target Quanti
ty")
at levels ("SampleApp Lite"."H0 Time"."Day Detail", "SampleApp Lite"."H2 Office
s"."Offices Company")
using connection pool "TT_AGGR_STORE"."TT_AGGR_STORE"
in "TT_AGGR_STORE".."EXALYTICS",
"ag_2164440472"
for "SampleApp Lite"."F0 Revenue Base Measures"("Revenue","Billed Quantity","Di
scount Amount","# of Offices with Orders","# of Orders","# of Products with Orde
rs")
at levels ("SampleApp Lite"."H0 Time"."Year")
using connection pool "TT_AGGR_STORE"."TT_AGGR_STORE"
in "TT_AGGR_STORE".."EXALYTICS",
"ag_972974199"
for "SampleApp Lite"."F1 Targets Base Measures"("Target Revenue","Target Quanti
ty")
at levels ("SampleApp Lite"."H0 Time"."Day Detail")
using connection pool "TT_AGGR_STORE"."TT_AGGR_STORE"
in "TT_AGGR_STORE".."EXALYTICS",
"ag_792297804"
for "SampleApp Lite"."F0 Revenue Base Measures"("Revenue","Billed Quantity","Di
scount Amount","# of Offices with Orders","# of Orders","# of Products with Orde
rs")
at levels ("SampleApp Lite"."H1 Products"."Products Detail")
using connection pool "TT_AGGR_STORE"."TT_AGGR_STORE"
in "TT_AGGR_STORE".."EXALYTICS"
Statement execute succeeded
Processed: 2 queries
To run the script, I connect using the nqcmd client that's installed on my workstation as part of the Oracle BI client installation, and connect using the ODBC data source that points to my Exalytics installation, passing across the username and password of an admin user and the path to the summary advisor script. The script then connects to the BI Server ODBC client interface, and then first deletes, and then creates, each of the aggregates.
Each aggregate definition tells the BI Server to take this logical definition and then go and create an aggregate fact table, and corresponding dimension tables, for each aggregate. Where possible, the dimensions are shared, so that, when I then use SQL*Developer to connect to the TimesTen database, I can see eleven aggregate fact tables whose names start with "AG_", another fifty-two tables whose name starts with "CD_" and hold data dictionary (token) information used by the column compression feature, and five dimension tables with names starting with "SA_" that hold the shared dimension attributes.
Opening up the Administration tool again, you can see where the BI Server has now added the TimesTen tables into the Physical layer, and plugged the aggregates in as logical table sources for the facts and dimensions. Each aggregate recommended by the Summary Advisor has turned into a separate logical table source, with each one mapped to different sets of dimension hierarchy levels in the Content tab within the logical table source Properties settings. How practical this will get when there are dozens of aggregates being recommended, particularly when just refreshing them requires them to first be de-registered, and then re-registered, in the repository remains to be seen - I suspect in reality we'll end up creating scripts that just refresh the underlying TimesTen tables rather than go through the process of removing and then adding-again the aggregate entries in the repository, particularly if these means we can do incremental refreshes, rather than drop and fully-reload.
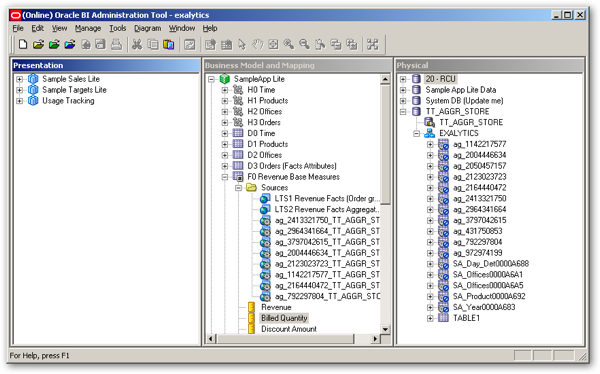
Looking through the nqquery.log file you can see the BI Server receiving the request to first drop the aggregate tables and then re-create them, running queries against the underlying data source and using the results to populate these tables. Right-after, indexes are created on the tables (a new feature also found in 11.1.1.6's Aggregate Persistence Wizard, on which the Summary Advisor's features were built), statistics are generated, and then the tables are registered and mapped in as logical table sources within the repository. So what's the dashboard performance like after this exercise?
Well, as you'd expect, all of the dashboard analyses return data straightaway, with no delay any more, allowing you to click around the page and drill-into the data with no lag between clicks.
Looking at the usage tracking data again, you can see now that the total time in seconds for each query has dropped to zero, as the TimesTen database is returning data directly from memory now.
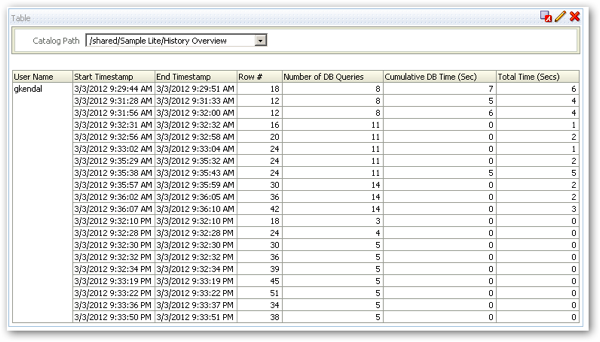
Which of course, is what you'd expect. So that's the process you'd go through to implement a set of in-memory aggregates using a generic data source, in this case the XML data used for the SampleAppLite demo. Now of course, whilst this proves the theory, if you were a cynical DBA or developer (as we all are), you'd no doubt have some questions and things you'd like to prove with a real, large data set:
- In practice, how much aggregate data can you actually get into TimesTen, how long does it take to load and refresh, and for a given size of data warehouse, what does this mean in terms of requires TimesTen space (remembering, of course, that the 1TB of RAM for Exalytics translated down to about 400GB of usable TimesTen space, given the requirement for temp space as well)
- Whilst this works for a single dashboard, how well does it support real, free-form ad-hoc analysis, the traditional weak-point of any caching strategy?
- How practical is it going to be to re-run the aggregate creation script more than once or twice a day, given that it effectively on-line edits the repository each time an aggregate is refreshed? And how practical is it to drop and recreate these summary tables, vs. the usual incremental refresh that you'd do with a materialized view?
- And how does this compare, say, to just putting the data in an OLAP cube or Essbase database, especially seeing as Essbase also has in-memory and multi-core optimisations as part of Exalytics, and you can also install it on the Exalytics server?
Also, it's likely that even with the TimesTen in-memory features, you're also going to get a load of benefit from just regular file-based query caching on an Exalytics box (especially as the files are likely to end-up being cached in RAM, too), and just the box itself is going to make things run a lot faster, so we shouldn't read too much into the absolute numbers and responsiveness that this example provides. But given that the SampleAppLite data source is inherently slow, and at the end of the exercise the dashboards ran super-fast, and that the theory that this illustrates is what (in general) would happen with any data source, it's an interesting exercise and one that I'll run through as a demo during the Hotsos talk, if only to show how the basic Exalytics principle works.
Anyway, that's probably it on Exalytics now until our box arrives, when I'll hand-over to Robin Moffatt who'll be running a suite of tests that we've developed to really shake the box down. Keep an eye on the blog towards the end of March, and then it'll be over to you, Robin...