Advanced monitoring of OBIEE with Nagios
Introduction
In the previous articles in this series, I described an overview of monitoring OBIEE, and then a hands-on tutorial for setting up Nagios to monitor OBIEE. Nagios is an Enterprise Systems Management tool that can monitor multiple systems and servers, send out alerts for pre-defined criteria, and so on.
In this article I'm going to demonstate creating custom plugins for Nagios to extend the capability of it to monitor additional elements of the OBIEE stack. The intention is not to document an exhaustive list of plugins and comprehensive configurations, but to show how the plugins can be created and get you started if you wanted to implement this yourself.
Most of these plugins will run local to the OBIEE server and the assumption is that you are using the NRPE mechanism for communication with the Nagios server, described in the previous article. For each plugin, I've included:
- The plugin code, to be located in Nagios plugins folder (default is /usr/lib64/nagios/plugins)
- If required, an entry for the NRPE configuration file on the BI Server
- An entry for the service definition, on the Nagios server
Whenever you change the configuration of NRPE or Nagios, don't forget to restart the appropriate service:
sudo service nags restartor
sudo service nags restartA very brief introduction to writing Nagios plugins
There's plenty on Google, but a Nagios plugin boils down to:- Something executable from the command line as the nagios or nrpe user
- One or more lines of output to stdout. You can include performance data relevant to the check after a pipe | symbol too, but this is optional.
- The exit code reflects the check state - 0,1,2 for OK, Warning or Critical respectively
Application Deployments
Here is a plugin for Nagios that will report on the state of a given Web Logic application deployment. Without several of the JEE applications that are hosted within Web Logic, OBIEE will not work properly, so it is important to monitor them.
Because of how WLST is invoked and Nagios' use of a script's exit code to determine the service status, there are two scripts required. One is the WLST python code, the other is a wrapper to parse the output and set the exit code accordingly.
Note that this plugin invokes WLST each time so running this for every Application Deployment at very regular intervals concurrently may not be a great idea since each invocation will spin up its own java instance on your BI Server. Using the Nagios service option parallelize_check=0 ought to prevent this I think, but didn't seem to when I tested it. Another possibility would be to run wlst remotely from the Nagios server, but this is not a 'light touch' option.


check_wls_app_deployment.sh: (put this in the Nagios plugins folder on the BI Server)
# check_wls_app_deployment.sh
# Put this in your Nagios plugins folder on the BI Server
#
# Check the status of an Application Deployment
# Takes five arguments - connection details, plus application name, and server
#
# This is a wrapper for check_wls_app_deployment necessary to make sure a proper exit code
# is passed back to Nagios. Because the py is called as a parameter to wlst, it cannot set the exit
# code itself (since it is the wlst.sh which exits).
#
# RNM 2012-09-03
#
# Set this to your FMW home path:
FMW_HOME=/home/oracle/obiee
#
# No user servicable parts below this line
# -----------------------------------------------------------------------------------------------
if [ $# -ne 5 ]then
        echo
        echo "ERROR : not enough parameters"
        echo "USAGE: check_wls_app_deployment.sh WLS_USER WLS_PASSWORD WLS_URL app_name target_server"
        exit 255
fi
output=$($FMW_HOME/oracle_common/common/bin/wlst.sh /usr/lib64/nagios/plugins/check_wls_app_deployment.py $1 $2 $3 $4 $5 | tail -n1)
echo $output
test=$(echo $output|awk '{print $1}'|grep OK)

ok=$?
if [ $ok -eq 0 ]

then

exit 0

else

exit 2

fi
check_wls_app_deployment.py: (put this in the Nagios plugins folder on the BI Server)
# check_wls_app_deployment.py
# Put this in your Nagios plugins folder on the BI Server
#
# Check the status of an Application Deployment
# Takes five arguments - connection details, plus application name, and server
# RNM 2012-09-03
#
# You shouldn't need to change anything in this script
#
import sys
import os
# Check the arguments to this script are as expected.
# argv[0] is script name.
argLen = len(sys.argv)
if argLen -1 < 5:
        print "ERROR: got ", argLen -1, " args."
        print "USAGE: wlst.sh check_app_state.py WLS_USER WLS_PASSWORD WLS_URL app_name target_server"
        sys.exit(255)
WLS_USER = sys.argv[1]
WLS_PW = sys.argv[2]
WLS_URL = sys.argv[3]
appname = sys.argv[4]
appserver = sys.argv[5]
Connect to WLS
connect(WLS_USER, WLS_PW, WLS_URL);
Set Application run time object
nav=getMBean('domainRuntime:/AppRuntimeStateRuntime/AppRuntimeStateRuntime')

state=nav.getCurrentState(appname,appserver)

if state == 'STATE_ACTIVE':

print 'OK : %s - %s on %s' % (state,appname,appserver)

else:

print 'CRITICAL : State is "%s" for %s on %s' %  (state,appname,appserver)
NRPE configuration:
command[check_wls_analytics]=/usr/lib64/nagios/plugins/check_wls_app_deployment.sh weblogic welcome1 t3://localhost:7001 analytics#11.1.1 bi_server1Service configuration:
define service{
        use                             obi-service
        host_name                       bi1
        service_description             WLS Application Deployment : analytics
        check_command                   check_nrpe_long!check_wls_analytics
        }
By default, NRPE waits 10 seconds for a command to execute before returning a timeout error to Nagios. WLST can sometimes take a while to crank up, so I created a new command, check_nrpe_long which increases the timeout:
define command{
        command_name    check_nrpe_long
        command_line    $USER1$/check_nrpe -H $HOSTADDRESS$ -c $ARG1$ -t 30
        }
nqcmd OBIEE plugin for Nagios
Using the OBIEE command line utility nqcmd it is simple to create a plugin for Nagios which will run a Logical SQL statement (as Presentation Services would pass to the BI Server). This plugin will validate that the Cluster Controller, BI Server and source database are all functioning. With a bit more coding, we can include a check for the response time on the query, raising an alert if it breaches defined thresholds.
This script can be used to just run a Logical SQL and return pass/fail, or if you include the additional command line parameters, check for the response time. To use the plugin, you need to create a file holding the logical SQL that you want to run. You can extract it from usage tracking, nqquery.log, or from the Advanced tab of a report in Answers. In the example given below, the logical SQL was copied into a file called q1.lsql located in /usr/lib64/nagios/plugins/.
check_obi_nqcmd.sh: (put this in the Nagios plugins folder on the BI Server)
# check_obi_nqcmd.sh
# Put this in your Nagios plugins folder on the BI Server
#
# Nagios plugin to check OBI status using nqcmd.
# Assumes that your DSN is AnalyticsWeb - modify the nqcmd call in this script if it is different
#
# RNM September 2012
#
#
# Set this to your FMW home path:
FMW_HOME=/home/oracle/obiee
#
# No user servicable parts below this line
# -----------------------------------------------------------------------------------------------
case $# in
	3)
		lsql_file=$1
		username=$2
		password=$3
		checktime=0
	;;
	5)
		lsql_file=$1
		username=$2
		password=$3
		checktime=1
		warn_msec=$4
		crit_msec=$5
	;;
	*)
		echo " "
		echo "Usage: check_obi_nqcmd.sh <lsql-filename> <username> <password> [warn msec] [crit msec]"
		echo " "
		echo "eg: check_obi_nqcmd.sh /home/oracle/nagios/q1.lsql weblogic welcome1"
		echo "eg: check_obi_nqcmd.sh /home/oracle/nagios/q1.lsql weblogic welcome1 1000 5000"
		echo " "
		echo " "
		exit 255
esac
# Initialise BI environment
. $FMW_HOME/instances/instance1/bifoundation/OracleBIApplication/coreapplication/setup/bi-init.sh
outfile=$(mktemp)

errfile=$(mktemp)

grpfile=$(mktemp)
nqcmd -d AnalyticsWeb -u $username -p $password -s $lsql_file -q -T 1>$outfile 2>$errfile

grep Cumulative $outfile > /dev/null

nqrc=echo $?

if [ $nqrc -eq 0 ]

then

responsetime=$(grep Cumulative $outfile |awk '{print $8 * 1000}')

if [ $checktime -eq 1 ]

then

if [ $responsetime -lt $warn_msec ]

then

echo "OK - response time (msec) is  "$responsetime" |"$responsetime

exitcode=0

elif [ $responsetime -lt $crit_msec ]

then

echo "WARNING - response time is at or over warning threshold ("$warn_msec" msec). Response time is  "$responsetime" |"$responsetime

exitcode=1

else

echo "CRITICAL - response time is at or over critical threshold ("$crit_msec" msec). Response time is  "$responsetime" |"$responsetime

exitcode=2

fi

else

echo "OK - response time (msec) is  "$responsetime" |" $responsetime

exitcode=0

fi

else

grep -v "Connection open" $errfile > $grpfile

grep failed $outfile >> $grpfile

echo "CRITICAL - " $(tail -n1 $grpfile)

exitcode=2

fi

rm $outfile $errfile $grpfile

exit $exitcode
NRPE configuration:
# Check nqcmd
command[check_nqcmd_q1]=/usr/lib64/nagios/plugins/check_obi_nqcmd.sh /usr/lib64/nagios/plugins/q1.lsql weblogic welcome1
command[check_nqcmd_q1_with_time_check]=/usr/lib64/nagios/plugins/check_obi_nqcmd.sh /usr/lib64/nagios/plugins/q1.lsql weblogic welcome1 500 1000
The first of the above commands runs the logical SQL file q1.lsql and will just do a pass/fail check. The second one checks how long it takes and raises a warning if it's above half a second, or a critical alert if it's over a second.
Nagios service configuration (use either or both, if you want the time checking):
define service{
        use                             obi-service
        host_name                       bi1
        service_description             NQCmd - Q1
        check_command                   check_nrpe!check_nqcmd_q1
        }
define service{

use                             obi-service

host_name                       bi1

service_description             NQCmd - Q1 with time check

check_command                   check_nrpe!check_nqcmd_q1_with_time_check

}

The plugin also supports the performance data output format, returning the time it took to run the logical SQL: 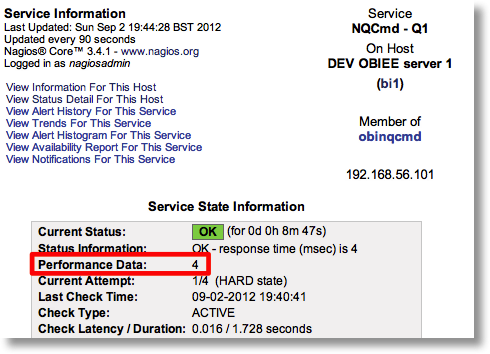
Test a real user with JMeter
Of all the checks and monitors described so far, they only consider a particular aspect of the stack. The above check with NQCmd is fairly comprehensive in that it tests both BI Server and the database. What it doesn't test is the front-end into OBIEE - the web server and Presentation Services. For full confidence that OBIEE is working as it should be, we need a full end-to-end test, and to do that we simulate an actual user logging into the system and running a report.
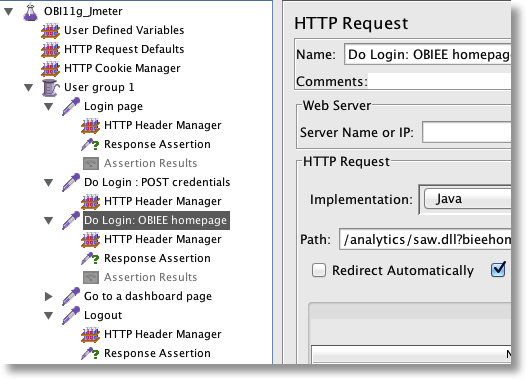
To do this, I am using JMeter plus some shell scripting. JMeter executes the actual web requests that a user would through their web browser in using OBIEE. The shell script looks at the result and sets the exit status, and how long it takes to perform the test is also recorded.
This check, like the NQCmd one above, could be set as a pass/fail, or also to consider how long it takes to run and raise a warning if it is above a threshold.
An important thing to note here is that this plugin is going to run local to the Nagios server, rather than on the BI Server like the two plugins above. This is deliberate, so that the network connectivity to the OBIEE server external to the host is also checked.
To set this up, you need:
- JMeter (download the Binary from here). Unarchive it into a folder, for example /u01/app/apache-jmeter-2.7/. Set the files in the binary folder to executable
Make sure also that the nagios user (under which this check will run) has read/execute access to the folders above where jmeter is keptchmod -R ugo+rx /u01/app/apache-jmeter-2.7/bin - A JMeter jmx script with the user actions that you want to test. The one I'm using does two simple things:
- Login
- Run dashboard
- The actual plugin script which Nagios will use. Put this in the plugins folder (eg /usr/lib64/nagios/plugins)
check_obi_user.sh: (put this in the Nagios plugins folder on the Nagios server)
# check_obi_user.sh # Put this in your Nagios plugins folder on the Nagios server # # RNM September 2012 # # This script will invoke JMeter using the JMX script passed as an argument # It parses the output and sets the script exit code to 0 for a successful test # and to 2 for a failed test. # # Tested with jmeter 2.7 r1342410 # # Set JMETER_PATH to the folder holding your jmeter files JMETER_PATH=/u01/app/apache-jmeter-2.7 # # No user servicable parts below this line # ----------------------------------------------------------------------------------------------- # You shouldnb't need to change anything below this line JMETER_SCRIPT=$1 output_file=$(mktemp)/usr/bin/time -p $JMETER_PATH/bin/jmeter -n -t $JMETER_SCRIPT -l /dev/stdout 1>/$output_file 2>&1
status_of_run=$?
realtime=$(tail -n3 $output_file|grep real|awk '{print $2}')
if [ $status_of_run -eq 0 ]
then
result=$(grep "<failure>true" $output_file)
status=$?
if [ $status -eq 1 ]
then
echo "OK user test run successfully |"$realtime
rc=0
else
failstep=$(grep --text "<httpSample" $output_file|tail -n1|awk -F="&quot;" '{print $6}'|awk -F="&quot;" '{sub(/&quot; rc/,"");print $1}')
echo "CRITICAL user test failed in step: "$failstep
rc=2
fi
else
echo "CRITICAL user test failed"
rc=2
fiecho "Temp file exists : "$output_file
rm $output_file
exit $rc - Because we want to test OBIEE as if a user were using it, we run this test from the Nagios server. If we used NRPE to run it locally on the OBIEE server we wouldn't be checking any of the network gremlins that can cause problems. On the Nagios server define a command to call the plugin, as well as the service definition as usual:
define command{
command_name check_obi_user
command_line $USER1$/check_obi_user.sh $ARG1$
}define service{
use obi-service
host_name bi1
service_description OBI user : Sample Sales - Product Details
check_command check_obi_user!/u01/app/jmeter_scripts/bi1.jmx
}
The proof is in the pudding
After the configuration we've done, we now have the following checks in place for the OBIEE deployment: 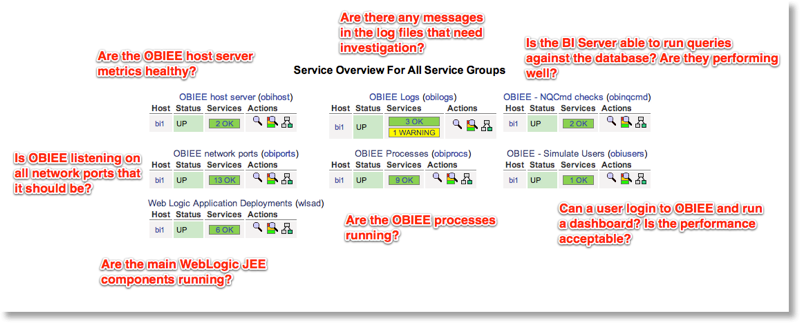
Now I'm going to test what happens when we start breaking things, and see if the monitoring does as it ought to. To test it, I'm using a script pull_the_trigger.sh which will randomly break things on an OBIEE system. It is useful for putting a support team through its paces, and for validating a monitoring setup.
Strike 1
First I run the script: 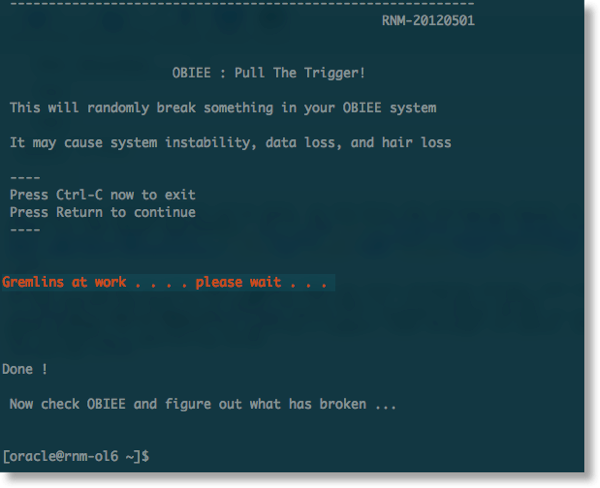 then I check Nagios:
 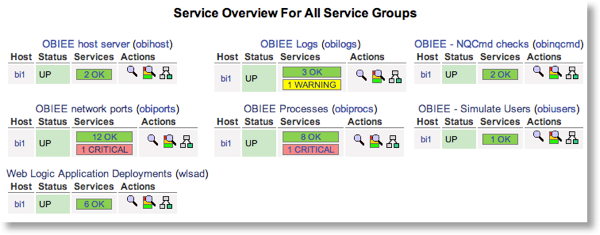 Two critical errors are being reported; a network port error, and a process error -- sounds like a BI process has been killed maybe. Drilling into the Service Group shows this:
 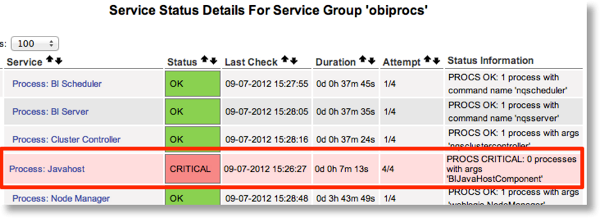 and a manual check on the command line and in EM confirms it:
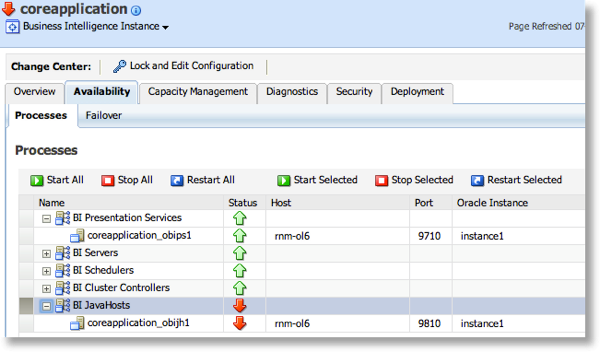
$ ./opmnctl statusProcesses in Instance: instance1
---------------------------------+--------------------+---------+---------
ias-component | process-type | pid | status
---------------------------------+--------------------+---------+---------
coreapplication_obiccs1 | OracleBIClusterCo~ | 5549 | Alive
coreapplication_obisch1 | OracleBIScheduler~ | 5546 | Alive
coreapplication_obijh1 | OracleBIJavaHostC~ | N/A | Down
coreapplication_obips1 | OracleBIPresentat~ | 5543 | Alive
coreapplication_obis1 | OracleBIServerCom~ | 5548 | Alive
So, 1/1, 100% so far ...
Strike 2
After restarting Javahost, I run the test script again. This time Nagios shows an alert for the user simulation: 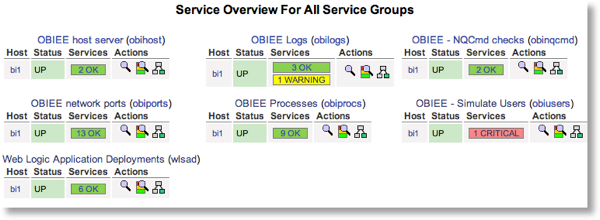 Drilling into it shows the step the failure occurs in:
  And verifying this manually confirms there's a problem:
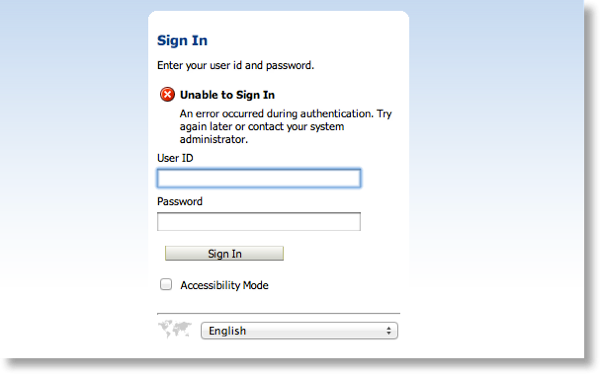
The Nagios plugins poll at configurable intervals, so by now some of the other checks have also raised errors:  We can see that a process has clearly failed, and since user logon and the NQCmd tests are failing it is probably the BI Server process itself that is down:
  I was almost right -- it was the Cluster Controller which was down.
Strike 3
I've manufactured a high CPU load on the BI server, to see how/if it manifests itself in the alerts. Here's how it starts to look: 
The load average is causing a warning: 
All the Application Deployment checks are failing with a timeout, presumably because WLST takes too long to start up because of the high CPU load: 
And the NQCmd check is raising a warning because the BI Server is taking longer to return the test query result than it should do.
Strike 4
The last test I do is to make sure that my alerts for any problem with what the end user actually sees are picked up. Monitoring processes and ports is fine, but it's the "unknown unknowns" that will get you eventually. In this example, I've locked the database account that the report data comes from. Obviously, we could write an alert which checks each database account status and raises an error if it's locked, but the point here is that we don't need to think of all these possible errors in advance.When the user ends up seeing this: (which is bad, m'kay?)
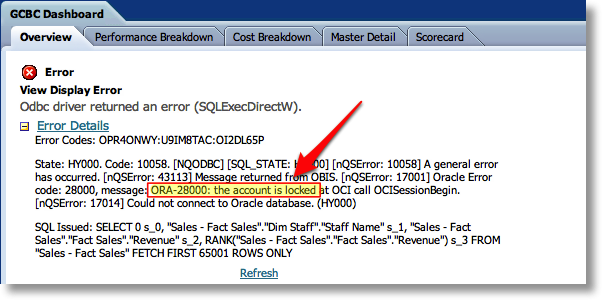 Our monitoring will pick up the problem:
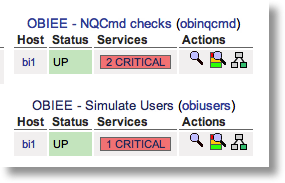 Both the logical SQL check with nqcmd, and the end-user simulation with JMeter, are picking up the problem.
