An introduction to monitoring OBIEE with Nagios
Introduction
This is the second post in a mini-series on monitoring OBIEE. The previous post, Automated Monitoring of OBIEE in the Enterprise – an overview, looked at the overview and theory to why and what we should be monitoring. In this post I am going to walk through implementing a set of automated checks on OBIEE using the Systems Management tool Nagios
Nagios
There are at least three different flavours of Nagios, and only one of them is free (open source), called Nagios Core. The others listed here are Nagios XI and Nagios Fusion.
Brace yourself
One of the formal pre-requisites of open source software is either no documentation, or a vast swath of densely written documentation with no overview or map. OK, I'm kidding. But, be aware that with open source you have to be a bit more self-sufficient and prepared to roll up your sleeves than is normally the case with commercially produced software. I'm not trolling here, and there are exceptions on either side - but if you want to get Nagios working with OBIEE, be aware that it's not simply click-click-done. :)
Nagios has a thriving community of plugins, addons, and companion applications such as alternative frontends. This is both a blessing and a curse. It's great, because whatever you want to do with it, you probably can. It can be troublesome though because it means there's no single point of reference to lookup how something is done -- it could be done in many different ways. Some plugins will be excellent, others may be a bit ropey - you may find yourself navigating this with just your google-fu to guide you.
Right tool for the right job
As with any bit of software, make sure you're not trying to hit the proverbial nail with a pick axe. Plugins and so on are great for extending a product, but always keep an eye on the product's core purpose and whether you're straying too far from it to be sensible. Something which works now might not in future product upgrades. Also sense-check whether two complementary tools might be better suited than trying to do everything within one.
Getting started
I'm working with two servers, both Oracle Linux 6.3.
- The first server has OBIEE 11.1.1.6.2 BP1 installed in a standard single-node cluster with two WebLogic servers (AdminServer/Managed Server).
- The second server is going to be my Nagios monitoring server
In theory you could install Nagios on the OBIEE server, but that's not a great idea for Production usage as you'd be subject to all of the bad things which could happen to the OBIEE server and won't be able to alert for them if the monitoring is from the same server.
Installing Nagios
There is documentation provided on how to install Nagios from source which looks comprehensive and easy to follow.
Alternatively, using the EPEL repository, install nagios and the default set of nagios plugins using the package manager yum:
yum install nagios nagios-plugins-all chkconfig --level 35 nagios on Testing the installation
If the installation has worked, you should be able to go to the address http://[server]/nagios and login using the credentials you created or the default nagiosadmin/nagiosadmin: 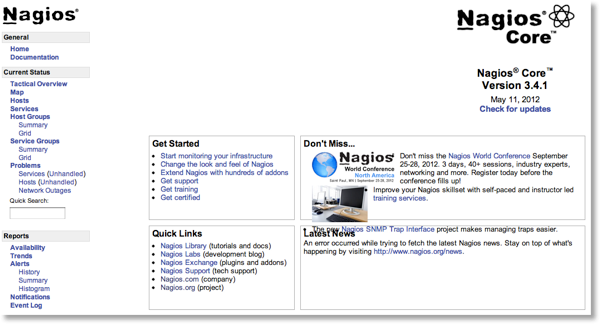
If you don't get this, check the following:
- Is nagios running?
If it's not, use$ ps -ef|grep [n]agios nagios 7959 1 0 14:16 ? 00:00:00 /usr/sbin/nagios -d /etc/nagios/nagios.cfgservice nags start - Is Apache web server running?
If it's not, use$ ps -ef|grep [h]ttpd root 8016 1 0 14:19 ? 00:00:00 /usr/sbin/httpd apache 8018 8016 0 14:19 ? 00:00:00 /usr/sbin/httpd […]service https start - If the firewall's enabled, is port 80 open?
Nagios configuration
Nagios is configured, by default, through a series of files held on the server. There are GUI front ends for these files, but in order to properly understand what's going on under the covers I am working with the files themselves here.
The documentation refers to Nagios config being in /usr/local/nagios, but on my install it put it in /etc/nagios/
Object types
To successfully work with Nagios it is necessary to understand some of the terminology and object types used. For a complete list with proper definitions, see the documentation.
- A host is a physical server
- A host has services defined against it
- Each service defines a command to use
- A command specifies a plugin to execute
For a detailed explanation of Nagios' plugin architecture, see here
Examining the existing configuration
From your Nagios installation home page, click on Hosts and you should see localhost listed. Click on Services and you'll see eight pre-configured checks ('services') for localhost. 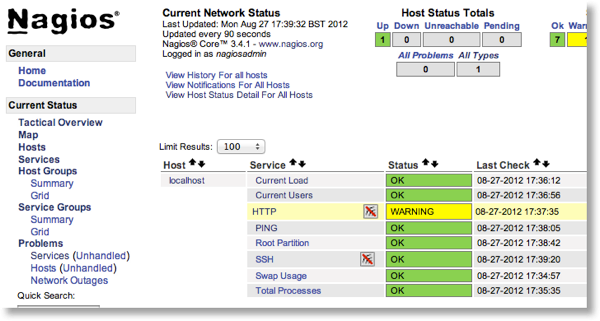 Let's disect this existing configuration to start with. First off, the nagios.cfg file (probably in /etc/nagios or /usr/local/nagios) includes the line:
cfg_file=/etc/nagios/objects/localhost.cfgOpen up localhost.cfg and you'll see the line define host which is the definition for the machine, including an alias, its physical address, and the name by which it is referred to in later Nagios configuration.
Scrolling down, there is a set of define service statements. Taking the first one:
define service{
use local-service ; Name of service template to use
host_name localhost
service_description PING
check_command check_ping!100.0,20%!500.0,60%
}- It's based on a local-service template
- The hostname to use in it is localhost, defined previously
- The (arbitrary) name of the service is PING
- The command to be run for this service (to determine the service's state) is in the check_command. The syntax here is the command (check_ping) followed by arguments separated by the ! symbol (pling/bang/exclamation mark)
The command that a service runs (and the arguments that it accepts) is defined by default in the commands.cfg file. Open this up, and seach for 'check_ping' (the command we saw in the PING service definition above). We're now getting closer to the actual execution, but not quite there yet. The define command gives us the command name (eg. check_ping), and then the command line that is executed for it. In this case, the command line is also called check_ping, and is an executable that is installed with nagios-plugins (nagios-plugins-all if you're using a yum installation).
In folder /usr/lib64/nagios/plugins you will find all of the plugins that were installed by default, including check_ping. You can execute any of them from the command line, which is a good way to both test them and understand how they work with arguments passed to them. Many will support a -h help flag, including check_ping:
 $ cd /usr/lib64/nagios/plugins/
$ ./check_ping -h
check_ping v1.4.15 (nagios-plugins 1.4.15)
Copyright (c) 1999 Ethan Galstad <[email protected]>
Copyright (c) 2000-2007 Nagios Plugin Development Team
	<[email protected]>
Use ping to check connection statistics for a remote host.
Usage:

check_ping -H <host_address> -w <wrta>,<wpl>% -c <crta>,<cpl>%

[-p packets] [-t timeout] [-4|-6]

[…]
Working back through the config, we can see the plugin is going to be executed with
command_line $USER1$/check_ping -H $HOSTADDRESS$ -w $ARG1$ -c $ARG2$ -p 5 check_command check_ping!100.0,20%!500.0,60%So, we can now execute the plugin ourselves to see how it works and to validate what we think Nagios should be picking up:
./check_ping -H localhost -w 100.0,20% -c 500,60% -p 5
PING OK - Packet loss = 0%, RTA = 0.05 ms|rta=0.052000ms;100.000000;500.000000;0.000000 pl=0%;20;60;0
A picture may be worth a thousand words
To visualise how the configuration elements relate and in which files they are located by default, see the following diagram: 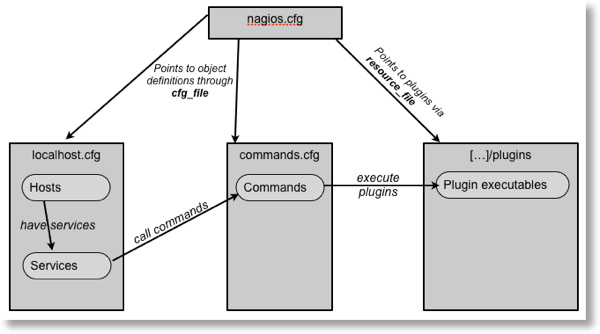 NB this is not a fully comprehensive illustration, but a simplified one of the default configuration.
tl;dr?
If you're skimming through this looking for nuggets, you'd be well advised to try to digest the above section, or at least the diagram. It will save you time in the long run, as all of Nagios is based around the same design principle
Adding a new host
Let us start our OBIEE configuration of Nagios by adding in the OBIEE server. Currently Nagios has a single host defined, localhost, which is the Nagios server itself.
The first step is to specify where our new configuration will reside. We can either
- bolt it on to one of the existing default config files
- Create a new config file, and reference it in nagios.cfg with a new cfg_file entry
- Create a new config file directory, and add a line to nagios.cfg for cfg_dir
Option 1 is quick 'n dirty. Option 2 is fine for small modifications. Option 3 makes the most sense, as any new configuration files we create after this one we just add to the directory and they will get picked up automagically. We'll also see that keeping certain configuration elements in their own file makes it easier to deploy to additional machines later on.
First, create the configuration folder
mkdir -p /etc/nagios/configcfg_dir = /etc/nagios/configNow, in the tradition of all good technology learning, we will copy the existing configuration and modify it for the new host.
Copy objects/localhost.cfg to config/bi1.cfg, and then modify it so it resembles this:
 define host{
use linux-server
host_name bi1
alias DEV OBIEE server 1
address 192.168.56.101
}
define service{

use local-service

host_name bi1

service_description PING

check_command check_ping!100.0,20%!500.0,60%

}
So we have a very simple configuration - our host, and a single service, PING.
Before the configuration change is activated, we need to validate the configuration, by getting Nagios to parse it and check for errors
nagios -v /etc/nagios/nagios.cfgOnce the configuration has been validated, we restart nagios to pick up the new configuration:
service nags restartReturning to the Nagios web front end (http://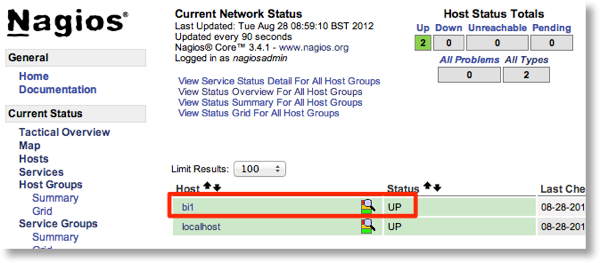
Running Nagios checks on a remote machine
Nagios checks are all based on a command line executable run locally on the Nagios server. This works fine for things like ping, but when it comes to checking the CPU load or for a given process, we need a way of finding this information out from the remote machine. There are several ways of doing this, including check_by_ssh, NRPE and NSCA. We're going to use NRPE here. There is a good diagram here of how it fits in the Nagios architecture, and documentation for NRPE here.
NRPE works as follows:
- Nagios server calls a check_nrpe plugin locally
- check_nrpe communicates with NRPE daemon on the remote server
- NRPE daemon on the remote server executes the required nagios plugin locally, and passes the results back to the Nagios server
You can see from points 2 and 3 that there is installation required on the remote server, of both the NRPE daemon and the Nagios plugins that you want to be available for the remote server.
Setting up NRPE
On the remote server, install the Nagios plugins and the NRPE daemon:
$ sudo yum install nagios-plugins-all nagios-plugins-nrpe nopeAmend the NRPE configuration (/etc/nagios/nrpe.cfg) to add the IP of your Nagios server (in this example, 192.168.56.102) to the allowed_hosts line
allowed_hosts=127.0.0.1,192.168.56.102Now set nrpe to start at boot, and restart the nrpe service to pick up the configuration changes made
$ sudo chkconfig --level 35 nrpe on
$ sudo service nope restart$ cd /usr/lib64/nagios/plugins
$ ./check_nrpe -H localhost
NRPE v2.12$ sudo yum install nagios-plugins-nrpe$ cd /usr/lib64/nagios/plugins
$ ./check_nrpe -H 192.168.56.101
NRPE v2.12NRPE, commands and plugins
In a local Nagios service check, the service specifies a command which in turn calls a plugin. When we do a remote service check using NRPE the same chain exists, except the service always calls the NRPE command and plugin. The difference is that it passes to the NRPE plugin the name of a command executed on the NRPE remote server.
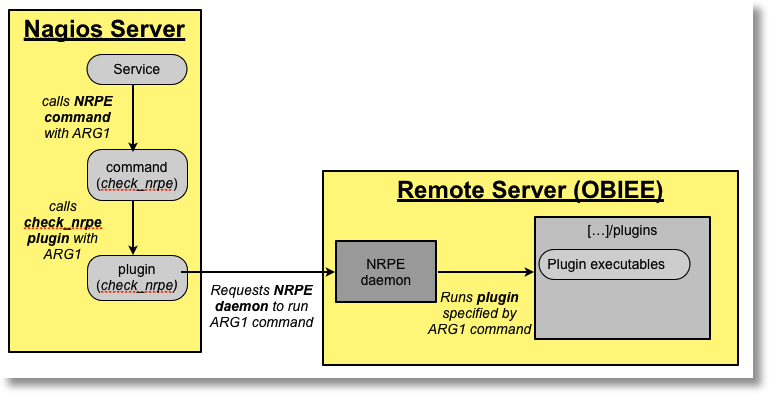
So there are actually two commands to be aware of :
- The command defined on the Nagios server, which is specified from the service
These commands are defined as objects using the define command syntax - The command on the remote server in the NRPE configuration, which specifies the actual plugin executable that is executed
The command is defined in the nrpe.cfg file, with the syntaxcommand[<command name>]=<command line execution statement>
An example NRPE service configuration
One of the default service checks that comes with Nagios is Check Load. It uses the check_load plugin. We'll see how the same plugin can be used on the remote server through NRPE.
- Determine the commandline call for the plugin on the remote server. In the plugins folder execute the plugin manually to determine its syntax
So for example:$ cd /usr/lib64/nagios/plugins/ $ ./check_load -h […] Usage: check_load [-r] -w WLOAD1,WLOAD5,WLOAD15 -c CLOAD1,CLOAD5,CLOAD15./check_load -w 15,10,5 -c 30,25,20 OK - load average: 0.02, 0.04, 0.05|load1=0.020;15.000;30.000;0; load5=0.040;10.000;25.000;0; load15=0.050;5.000;20.000;0; - Specify the NRPE command in nrpe.cfg file with the command line determined in the previous step:
You'll see this in the default nrpe.cfg file. Note that "check_load" is entirely arbitrary, and "command" is a literal.command[check_load]=/usr/lib64/nagios/plugins/check_load -w 15,10,5 -c 30,25,20 - On the Nagios server, configure the generic check_nrpe command. This should be added to an existing .cfg file, or a new one in the cfg_dir folder that we configured earlier
Note here the -c argument, which passes $ARG1$ as the command to execute on the NRPE daemon.define command{ command_name check_nrpe command_line $USER1$/check_nrpe -H $HOSTADDRESS$ -c $ARG1$ } - Define a service which will call the plugin on the NRPE server. I've added this into the configuration file for the new host created above (config/bi1.cfg)
Note that check_nrpe is the name of the command that we defined in step 3. check_load is the arbitrary command name that we've configured on the remote server in nrpe.cfgdefine service{ use local-service host_name bi1 service_description Check Load check_command check_nrpe!check_load }
As before, validate the configuration:
nagios -v /etc/nagios/nagios.cfgsudo service nags restart
Nagios and OBIEE
Did someone say something about OBIEE? As I warned at the beginning of this article Nagios is fairly complex to configure and it is a steep learning curve. What I've written so far is hopefully sufficient to guide you through the essentials and give you a head-start in using it.
The rest of this article looks at the kinds of alerts we can build into Nagios for OBIEE
Process checks
To check for the processes in the OBIEE stack we can use the check_proc plugin. This is a flexible plugin with a variety of invocation approaches, but we are going to use it to raise a critical alert if there is not a process running which matches a argument or command that we specify.
As with all of these checks, it is best to develop it from the ground up, so start with the plugin on the command line and work out the correct syntax. Once the syntax is determined it is simple to incorporate it into the Nagios configuration.
The syntax for the plugin is obtained by running it with the -h flag:
./check_procs -h |more
check_procs v1.4.15 (nagios-plugins 1.4.15)
Copyright (c) 1999 Ethan Galstad <[email protected]>
Copyright (c) 2000-2008 Nagios Plugin Development Team
	<[email protected]>
Checks all processes and generates WARNING or CRITICAL states if the specified

metric is outside the required threshold ranges. The metric defaults to number

of processes.  Search filters can be applied to limit the processes to check.
Usage:

check_procs -w <range> -c <range> [-m metric] [-s state] [-p ppid]

[-u user] [-r rss] [-z vsz] [-P %cpu] [-a argument-array]

[-C command] [-t timeout] [-v][…]
So to check for Presentation Services, which runs as sawserver we would use the -C parameter to specify the process command to match. In addition, we need to specify the warning and critical thresholds. For the OBI processes these thresholds are pretty simple - if there are zero processes then sound the alarm, and if there's one process then all is OK.
./check_procs -C sawserver -w 1: -c 1:
PROCS OK: 1 process with command name 'saw server'./check_procs -C sawserver -w 1: -c 1:
PROCS CRITICAL: 0 processes with command name 'saw server'- On the remote server, add the command into NRPE.
I've created a new file called custom.cfg in /etc/nrpe.d (the contents of which are read by NRPE for configuration as well as nrpe.cfg itself)
The command I've defined is called check_obips:command[check_obips]=/usr/lib64/nagios/plugins/check_procs -w 1: -c 1: -C saw server - Because we've added a new command into NRPE, the NRPE service needs restarting:
service nope restart - On the Nagios server define a new service for the BI server which will use the check_obips command, via NRPE:
define service{ use local-service host_name bi1 service_description Process: Presentation Services check_command check_nrpe!check_obips } - As before, validate the nagios configuration and if it passes, restart the service
nagios -v /etc/nagios/nagios.cfg
service nags restart
Looking in the Nagios frontend, the new Presentation Services alert should be present:  In this screenshot the alert is status Critical because there are no Presentation Services (sawserver) processes running. If I restart it the alert will change:
Network ports
To doublecheck that OBIEE is working, monitoring the state of the network ports is a good idea.
If you are using a firewall then you will need to run this check on the OBI server itself, through NRPE. If you're not firewalled, then you could run it from the Nagios server. If you are firewalled but only want to check for the public-facing ports of OBIEE (for example, 9704) then you could run it locally on Nagios too.
Whichever way you run the alert, it is easily done using the check_tcp plugin
./check_tcp -p 9704
TCP OK - 0.001 second response time on port 9704|time=0.001384s;;;0.000000;10.000000
The NRPE configuration:
command[check_obis_port]=/usr/lib64/nagios/plugins/check_tcp -H localhost -p 9703The Nagios service configuration:
define service{
use local-service
host_name bi1
service_description Port: BI Server
check_command check_nrpe!check_obis_port
}
Log files
check_logwarn is not provided by the default set of Nagios plugins, and must be downloaded and installed separately. Once installed, it can be used thus:
NRPE command:
command[check_log_nqserver]=/usr/lib64/nagios/plugins/check_logwarn -p -d /tmp /u01/app/oracle/product/fmw/instances/instance1/diagnostics/logs/OracleBIServerComponent/coreapplication_obis1/nqserver.log ERROR define service{
use local-service
host_name bi1
service_description Logs: BI Server nqserver.log
max_check_attempts 1
check_command check_nrpe!check_log_nqserver
} 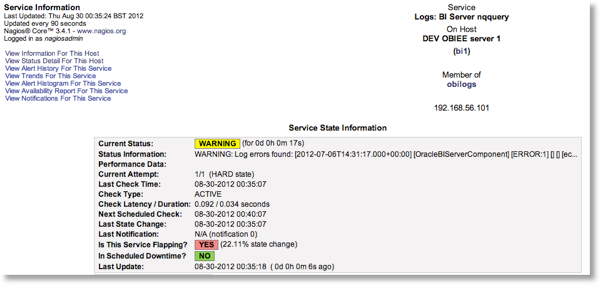 Be aware that this method is only really useful for alerting you that there is something to look at in the logs -- it doesn't give you the log to browse through. For that you would need to go to the log file on disk, or the log viewer in EM. Tips:
- Set max_check_attempts in the service defintion to 1, so that an alert is raised straight away.
Unlike monitoring something like a network port where a glitch might mean a service should check it more than once before alerting, if an error is found in a log file it is still going to be there if you check again. - For this service, the action_url option for a service could be used to include a link through to the EM log viewer
- Make sure that the NRPE user has permissions on the OBI log files.
Database
The check_oracle plugin can check that a database is running locally, or using a TNS entry remotely. Since the OBIEE server that I'm using here is a sandpit environment the database is also running on it, so the check can be run locally on it, via NRPE
NRPE configuration:
command[check_db]=/usr/lib64/nagios/plugins/check_oracle --db ORCLdefine service{
use local-service
host_name bi1
service_description Database check_command
check_nrpe!check_db
}Final Nagios configuration
Service Groups
Having covered the basic setup for monitoring an OBIEE server, we will now look at a couple of Nagios configuration options to improve the monitoring setup that's been built. The first is Service Groups. These are a way of grouping services together (how did you guess). For example, all the checks for OBIEE network ports. In the Nagios frontend Service Groups can be examined individually and drilled into.  The syntax is self-explanatory, except the members clause, which is a comma-separated list of host,service pairings:
 define servicegroup{
servicegroup_name obiports
alias OBIEE network ports
members bi1, Port: OPMN remote,bi1, Port: BI Server,bi1, Port: Javahost ,bi1, Port: OPMN local port,bi1, Port: BI Server - monitor,bi1, Port: Cluster Controller,bi1, Port: Cluster Controller - monitor,bi1, Port: BI Scheduler - monitor,bi1, Port: BI Scheduler - Script RPC,bi1, Port: Presentation Services,bi1, Port: BI Scheduler,bi1, Port: Weblogic Managed Server - bi_server1,bi1, Port: Weblogic Admin Server
}A note about templates
All of the objects that we have configured have included a use clause. This is a template object definition that specifies generic settings so that you don't have to configure them each time you create an object of that type. It also means if you want to change that setting, you can do so in once place instead of dozens.
For example, services have a check_interval setting, which is how often Nagios will check the service. There's also a retry_interval which is how many times Nagios will check the service again after the initial error, before raising an alert.
All the templates by default are defined in objects/templates.cfg, but note that templates in themselves are not an object type, they are just an object (eg service) which can be inherited. Templates can inherit other templates too. Examine the generic-service and local-service default templates to see more.
To see the final object definitions with all their inherited values, go to the Nagios web front end and choose the System > Configuration option from the left menu.
Email alerts
A silent alerting system is not much use if we want a hands-off approach to monitoring OBIEE. Getting Nagios to send out emails is pleasantly easy. In essence, you just need to configure a contact object. However I'm going to show how to set it up a bit neater, and illustrate the use of templates in the process.
- First step is to test that your Nagios server can send outbound email. In an enterprise this shouldn't be too difficult, but if you're trying this at home then some ISPs do block it.
To test it, run:
Substitute your email address, and if you receive the email then you know the host can send emails. Note you've not testing the Nagios email functionality, just the functionality of the Nagios host server to send email.echo 'Email works from the Nagios server' | mailx -s 'Test message from Nagios' [email protected]
If the email doesn't come through then check /var/log/maillog for errors - In your Nagios configuration, create a contact and contactgroup object. For ease of manageability, I've created mine as config/contacts.cfg but anywhere that Nagios will pick up your object definition is fine.
A contact group is pretty self-explanatory - it is made up of one or more contacts.define contact { use generic-contact contact_name rnm alias Robin Moffatt email [email protected] }define contactgroup {
contactgroup_name obiadmins
alias OBI Administrators
members rnm
} - To associate a contact group with a service, so that it receives notifications when the service goes into error, use the contact_groups clause in the service defintion.
Instead of adding this into each service that we've defined (currently about 30), I am going to add it into the service template. At the moment the services use the local-service template, one of the defaults with Nagios. I've created a new template, called obi-service, which inherits the existing local-service definition but also includes the contact-groups clause:
Now a simple search & replace in my configuration file for the OBIEE server (I called it config/bi1.cfg) to change all use local-service to use obi-servicedefine service{ name obi-service use local-service contact_groups obiadmins }[…] define service{ use obi-service host_name bi1 service_description Process: BI Server check_command check_nrpe!check_obis } […] - Validate the configuration and the restart Nagios
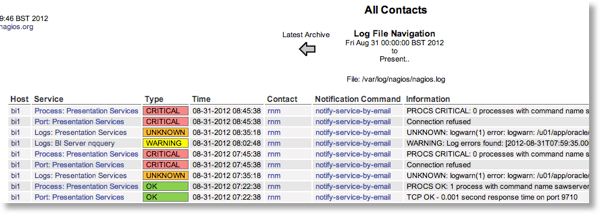
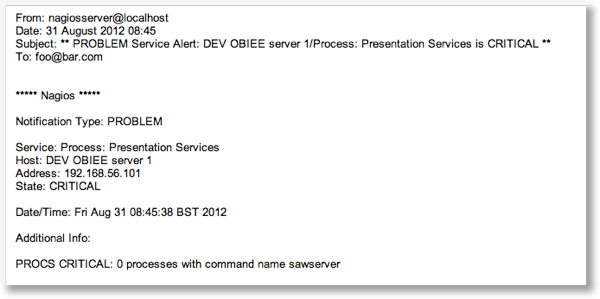 You can see what alerts have been sent by looking in the Nagios web front end under Reports > Notifications on the left-hand menu
Deployment on other OBIEE servers
To deploy the same setup as above, for a new OBIEE server, do the following:- Install nagios plugins and nrpe daemon on the new server
sudo yum install nagios-plugins-all nagios-plugins-nrpe nope - Add Nagios server IP to allowed_hosts in /etc/nagios/nrpe.cfg
- Start NRPE service
service nope start - Test nrpe locally on the new OBIEE server:
$/usr/lib64/nagios/plugins/check_nrpe -H localhost NRPE v2.12 - Test nrpe from Nagios server:
$/usr/lib64/nagios/plugins/check_nrpe -H bi2 NRPE v2.12 - From the first OBIEE server, copy /etc/nrpe.d/custom.cfg to the same path on the new OBIEE server.
Restart NRPE again - On the Nagios server, define a new host and set of services associated with it. The quick way to do this is copy the existing bi1.cfg file (which has the host and service definitions for the original OBIEE server) to bi2.cfg and do a search and replace. Amend the host definition for the new server IP.
- Update the service group definition to include the list of bi2 services too.
- Validate the configuration and restart Nagios


Summary
Nagios is a powerful but complex beast to configure. Once you get into the swing of it, it does make sense though.At a high-level, the way that you monitor OBIEE with Nagios is:
- Define OBIEE server as a host on Nagios
- Install and configure NRPE on the OBIEE server
- Configure the checks (process, network port, etc) on NRPE on the OBIEE server
- Create a corresponding set of service definitions on the Nagios server to call the NRPE commands
