Testing aggregate navigation on OBIEE and Exalytics

One of OBIEE’s many great strengths is aggregate navigation; the ability to choose from a list of possible tables the one which will probably give the optimal performance for a given user query. Users are blissfully unaware of which particular table their query is being satisfied from, since aggregate navigation happens on the BI Server once the user’s request comes through from an Analysis or Dashboard.

Whilst the log file nqquery.log (or Usage Tracking table S_NQ_DB_ACCT) tells us pretty easily which table a query used, it is nice to be able to switch a query easily between possible aggregate sources to be able to compare the data. This blog demonstrates how we can use the INACTIVE_SCHEMAS variable (as described in my previous blog on loading Exalytics incrementally) to do this.
INACTIVE_SCHEMAS is a Logical SQL variable that tells the BI Server to exclude the specified physical schema(s) from consideration for resolving an inbound query. Normally, the BI Server will parse each incoming query through the RPD, and where a Logical Table has multiple Logical Table Sources it will evaluate each one to determine if it (a) can satisfy the query and (b) whether it will be the most efficient one to use. By using INACTIVE_SCHEMAS we can force the BI Server to ignore certain Logical Table Sources (those associated with the physical schema specified), ensuring that it just queries the source(s) we want it to.
In the following example, the data exists on both Oracle database, and TimesTen (in-memory). Whilst the example here is based on an Exalytics architecture, the principle should be exactly the same regardless of where the aggregates reside. This is how the RPD is set up for the Fact table in my example:
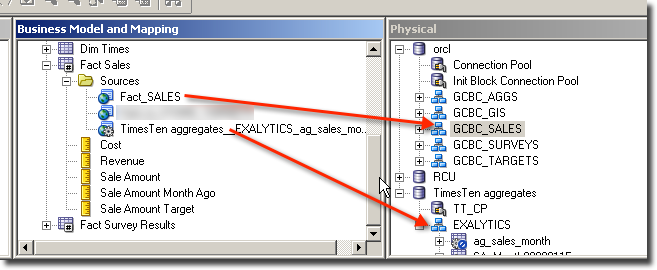
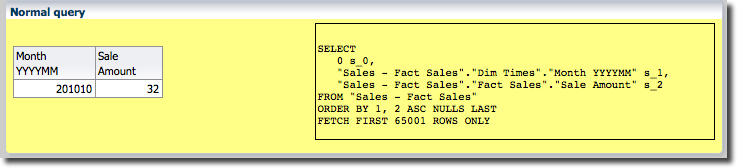
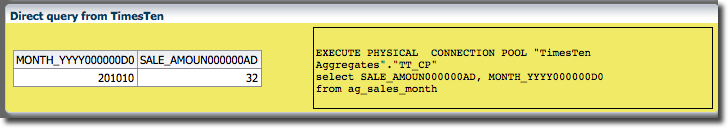
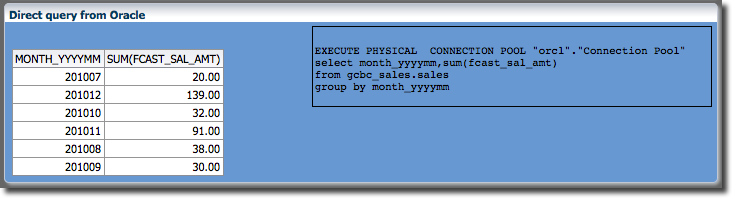
GCBC_SALES schema on Oracle holds the unaggregated sales data, whilst the EXALYTICS schema on TimesTen has an aggregate of this data in it. The very simple report pictured here shows sales by month, and additionally uses a Logical SQL view to show the contents of the query being sent to the BI Server:
[...]
------------- Sending query to database named TimesTen aggregates
WITH
SAWITH0 AS (select distinct T1528.Sale_Amoun000000AD as c1,
     T1514.Month_YYYY000000D0 as c2
from
     SA_Month0000011E T1514,
     ag_sales_month T1528
[...]
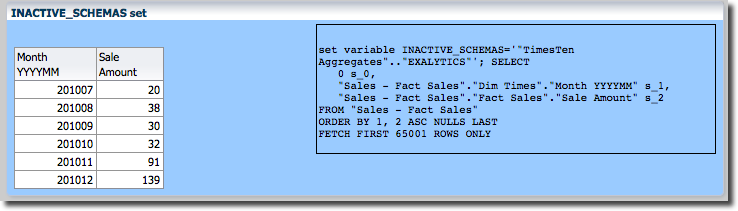
INACTIVE_SCHEMAS to force the BI Server to ignore TimesTen entirely. We can see from the nqquery.log that OBI has now gone back to the Oracle source of the data:
[...]
------------- Sending query to database named orcl
WITH
SAWITH0 AS (select sum(T117.FCAST_SAL_AMT) as c1,
     T127.MONTH_YYYYMM as c2
from
     GCBC_SALES.TIMES T127 /* Dim_TIMES */ ,
     GCBC_SALES.SALES T117 /* Fact_SALES */
[...]
So this is the feature we can use to perform the testing, but below I demonstrate a much more flexible way that having to build multiple reports.
Implementing INACTIVE_SCHEMAS
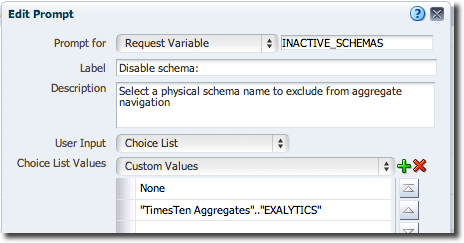
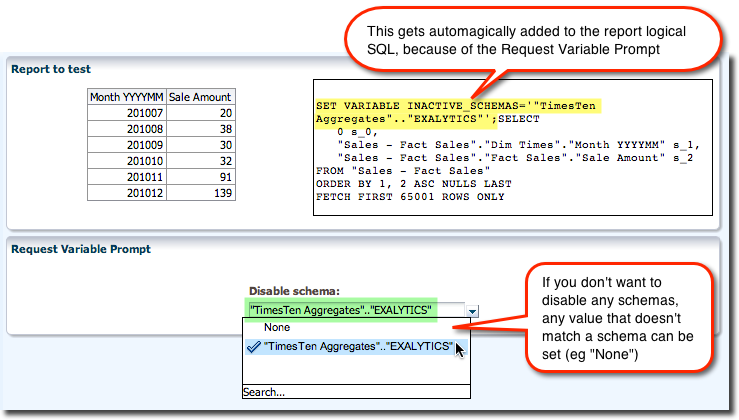
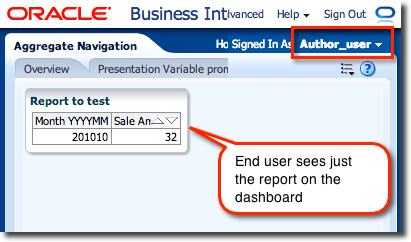
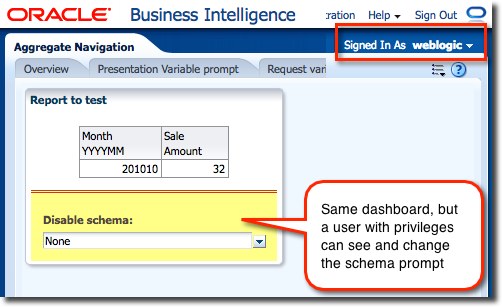
UsingINACTIVE_SCHEMAS in your report is very simple, and doesn’t require modification to your reports. Simply use a Variable Prompt to populate INACTIVE_SCHEMAS as a Request Variable. Disable the Apply button for instantaneous switching when the value is changed.
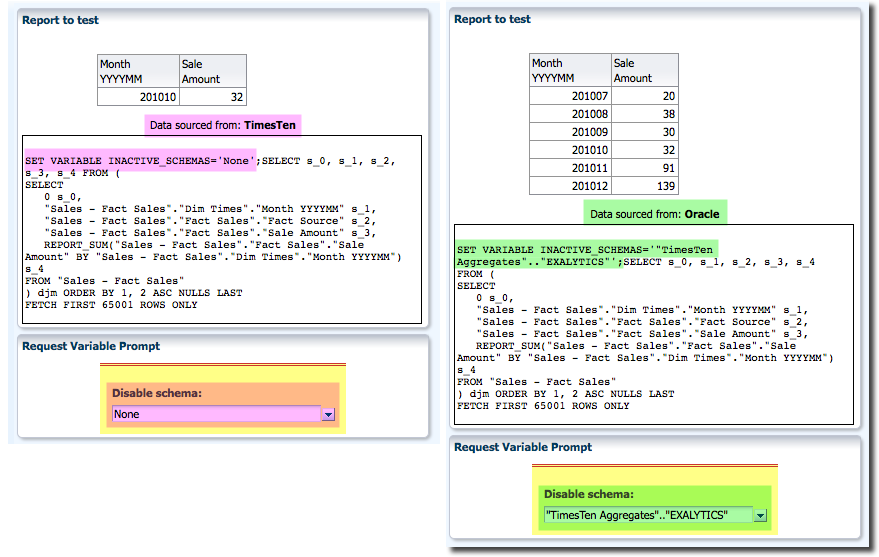
Displaying the aggregate source name in the report
So far this is all negative , in that we are specifying the data source not to use. We can examinenqquery.log etc to confirm which source was used, but it’s hardly convenient to wade through log files each time we execute the report. 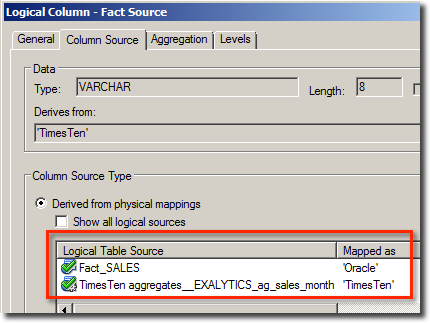
- Add a logical column to the fact table
- Hard code the expression for the column in each Logical Table Source
- Bring the column through to the relevant subject area
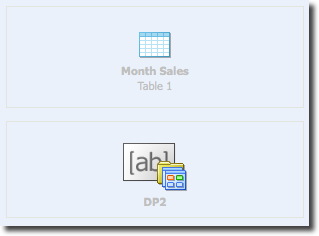
- Incorporate it in reports as required, for example using a Narrative View.
Summary
There’s a variety of ways to write bespoke test reports in OBI, but what I’ve demonstrated here is a very minimal way of overlaying a test capability on top of all existing dashboards. Simply create the Request Variable dashboard prompt, set the security so only admins etc can see it, and then add it in to each dashboard page as required.In addition, the use of a ‘data source’ logical column in a fact table tied to each LTS can help indicate further where the data seen is coming from.