Embedding a D3 Visualisation in OBIEE

In this blog entry, my first since joining the company as a consultant a little over a month ago, I will be taking you through the process of embedding a D3 visualisation into OBIEE. In my first few weeks in this new role I've had the pleasure or working with the forward thinking people at Nominet and one of the technologies they've exploited in their BI solution is D3. They are using it to display daily domain name registrations' by postcode on a map of the UK within OBIEE- very cool stuff indeed and after seeing it I was sufficiently inspired to have a go myself. We'll start with an overview of D3 itself and then move onto a worked example where we will look at why you may want to use D3 in OBIEE and the best way to go about it. This blog entry is not intended to be a D3 tutorial, there are plenty of very good tutorials out there already, this is more targeted at OBIEE developers who may have heard of D3 but haven't yet had a "play" ( yes, it's great fun ! ) with it yet in the context of OBIEE. So without further delay let's begin…..
What is D3 ?
To answer this question I will first tell you what D3 isn't - D3 is not a charting library, you will find no predefined bar charts, no line graphs, no scatter plots, not even a single pie chart. "What no pie charts ?!" I here you say, don't despair though, you can create all these types of visuals in D3 and a whole lot more. D3 which is short for "Data-Driven Documents" is a visualisation framework written entirely in JavaScript by Michael Bostock. The term framework is the key word here, D3 is generic in nature which allows it to tackle almost limitless visualisation challenges. The downside though is that you have to tell D3 exactly what you want it to do with the data you throw at it and that means rolling up your sleeves and writing some code. Fear not though, D3 has a great API that will enable you to get a fairly basic visual up and running in a short space of time. You'll need a basic understanding of HTML, CSS and SVG and of course some JavaScript but with the help of the online tutorials and the D3 API reference you'll be up and running in no time.
How does it work ?
D3's API allows you to bind data to place holders in the browser's DOM. You can then create SVG or HTML elements in these place holders and manipulate their attributes using the dataset you pass to it. Below is the code to display a very simple D3 visualisation to give you a basic idea of how it works.
var dataset = [ 10, 15, 20 ];

var svg = d3.select("body")
               .append("svg")
               .attr("width", 200)
               .attr("height", 200);

svg.selectAll("circle")
               .data(dataset)
               .enter()
               .append("circle")
               .attr("fill","none")
               .attr("stroke", "green")
               .attr("r",function(d){
                    return d ;
               })
               .attr("cy",100)
               .attr("cx",function(d){
                    return d * 8;
               });
This code produces the following visual, admittedly this is not very impressive to look at but for the purpose of this example it will do just fine.
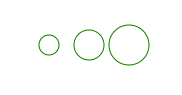
Let's break this down and see what's going on.
var dataset = [ 10, 15, 20 ];
Above is our data in a JavaScript array, no D3 here. We'll look at how to generate this from OBIEE a bit later on.
var svg = d3.select("body")
               .append("svg")
               .attr("width", 200)
               .attr("height", 200);
Here we are seeing D3 for the first time. This is a single line of code split over several lines so it's easier to read. Anyone familiar with jQuery will notice the chaining of methods with the "." notation. The first line selects the html body tag and then appends an SVG element to it. The two ".attr()" methods then set the width and the height of the SVG.
 svg.selectAll("circle")
               .data(dataset)
               .enter()
               .append("circle")
               .attr("fill","none")
               .attr("stroke", "green")
               .attr("r",function(d){
                    return d ;
               })
               .attr("cy",100)
               .attr("cx",function(d){
                    return d * 8;
               });
Here's where it gets interesting. The first line selects all circles within the SVG, but wait, we haven't created any circles yet ! this is where the the place holders come into play that I mentioned earlier. These place holders exist in memory only and are waiting to have data bound to them and then finally an actual circle element. The next line binds the data to the place holders, 10 to the first one, 15 to the next and 20 to the last. The magic .enter() method will then execute all the remaining statements once for each of our data elements, in this case 3 times. The .append("circle") will therefore be called 3 times and create 3 circle elements within the SVG.
The remaining statements will change attributes associated with the circles and this is where you can use the data to "drive" the document. Notice the attr("r"… and the attr("cx"… method calls, The "r" attribute defines the circle radius and the "cx" attribute sets the centre "x" coordinate of the circle. Both these methods have functions passed as arguments, the "d" variable in each function represents the current data element (or datum) in the array, 10 the first time, 15 the next and 20 on the last. These functions then return a value to the attr() methods. In this case the radius of each circle is being set to 10,15 and 20 respectively and the x coordinate of each is being set to 80, 120, 160 respectively.
Right, that's a basic overview of D3 and how it works, let's now have a look at an example where you might want to use D3 in OBIEE.
A Worked Example
Let's say we have some customers and each month, with a bit of luck ( and with the help of a Rittmanmead implemented BI system ! ) we sell to those customers. Based on the sales total for each customer each month we then place these customers into a scoring group. Group 1 for customers for which revenue exceeded £10,000, Group 2 for revenue greater than £5,000, Group 3 for revenue greater than £2,000 and Group 4 for revenue greater £0. At the end of each month we want to compare each customers current scoring group with the scoring group they occupied the previous month. It's the movement of customers between groups each month that we are interested in analysing.
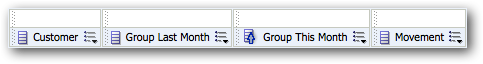
Here's the criteria we have in OBIEE Answers.
And here are the results.
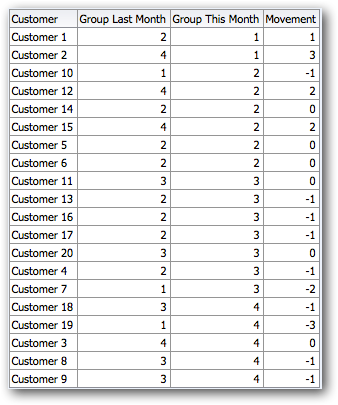
As you can see the Movement column is calculated as ( Group Last Month - Group This Month ).
Now at this point you might say "Job done, nothing more to do", we can clearly see this months and last months scoring group and the movement between the two, we have successfully conveyed the information to the user with minimal fuss and you'd be right. We could even develop the results further by conditionally formatting the colour of each row to reflect the current group and maybe we could add an additional column that contains an up arrow, down arrow or equals sign image to indicate the direction of movement. This is where it gets subjective, some users love visuals, some prefer the raw data and some the combination of the two. For this example we are going to try and visualise the data and you can make up your mind which you prefer at the end.
Lets see what we can produce using some standard OBIEE visuals.
First up the Vertical Bar Chart
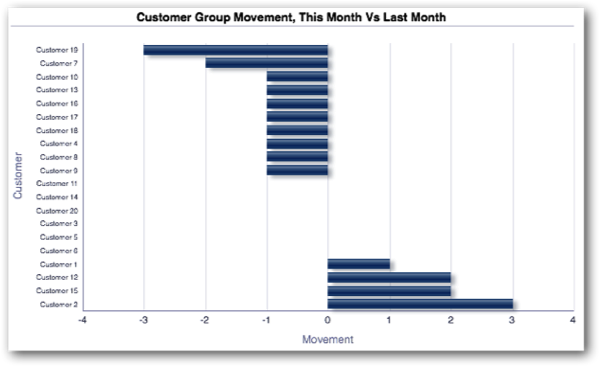
That's not bad, we can see by how many groups a customer has shifted since last month with some customers clearly staying put. What we can't see is from which groups they moved to and from, if we were to add in the Group Last Month and Group This Month measures to the chart it would look a complete mess.
Lets try something else, let's try a line graph only this time we'll include all three measures to make sure we've got all the information the user requires.
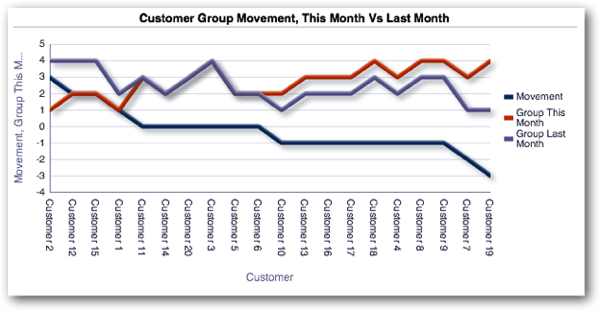
Mmmm, again not bad but to my mind it's not particularly intuitive, you have to study the graph to get the information you're after by which time most users will have switched off completely and may be better off a simple table view.
Lets have try again with a combined line and bar chart
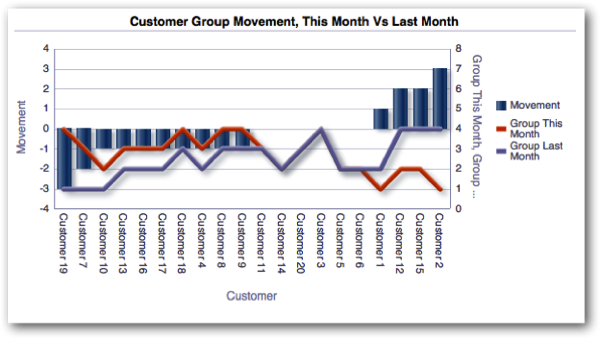
A slight improvement on the previous attempt but still not great. An issue I have with the last 2 examples is that to my mind customers in Group 1 ( the best group ) should be at the top of the chart while customers in Group 4 should be at the bottom of the chart - the cream rises to the top, right ?! We have no way of inverting the Y axis values so we are stuck with this rather counterintuitive view of the data. We could ask the users if they could would kindly change their grouping system but it's unlikely they'll agree and anyway that would be cheating !
Here's one last attempt just for fun !
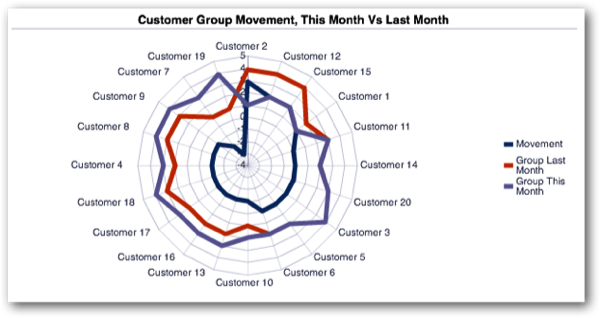
Nope, we're not making much progress here, this is just making me feel nauseous and believe me when I tell you I came up with several more ridiculous solutions than this, pie chart anyone ? So far the table view has been the clear winner over the visualisations in terms of ease of interpretation and this isn't a dig at OBIEE's visuals, OBIEE's visual's are great at doing what they are designed to do and they do it quickly. A D3 solution will take time and planning ( and debugging ) but you will have total control over the output and you'll be able to express your data in a way that no OBIEE visualisation will ever be able to do. So with that in mind let's have a look at one possible solution written in D3.
Developing a D3 Solution
In order to embed a D3 visualisation in OBIEE you'll need to use a Narrative view. The Narrative view will enable you to gain access to the data that we need to drive our visualisation using the @n substitution variables where n equals the column position in the criteria. We'll use this technique to generate some JavaScript from our analysis results that we can then use in our D3 script. Let's look at doing that now.
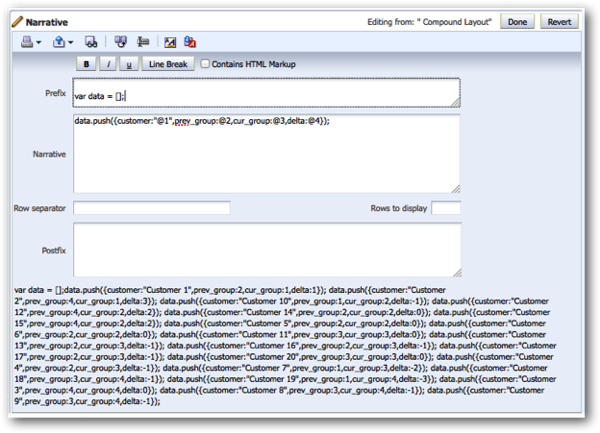
In the Prefix section at the top we are declaring a JavaScript array variable called "data" that will contain the data from the analysis. The Narrative section contains the following code
data.push({customer:"@1",prev_group:@2,cur_group:@3,delta:@4});
Because this line of code is in the narrative section it will be output once for each row in the result set, each time substituting @1, @2, @3 and @4 for Customer, Group Last Month, Group This Month and Movement respectively and will dynamically generate the JavaScript to populate our array. Notice that within the parentheses we have this format
{ key:value, key:value, key:value }
This will in fact create a JavaScript object for us in each array element so we can then reference our data in our D3 script by using data.customer, data.prev_group and data.delta to get at the values. As you can see below the postfix section we now have a load of JavaScript code ready to be used in our D3 script for testing and development purposes.
At this point I would strongly recommend leaving OBIEE and opening up your favourite development IDE, you will soon get frustrated writing JavaScript code directly into OBIEE. Personally I like NetBeans but there are several other free alternatives out there.
To get started in your favourite IDE you can either download a copy of the D3 library from http://d3js.org/ or reference the online version from within your script. I'd recommend uploading a copy to the OBIEE server once you've finished developing and are ready to go into production. If you want to reference the online version you will need to include the following snippet between the <head></head> tags in your html file.
<script src="http://d3js.org/d3.v3.min.js" charset="utf-8"></script>
So to start developing your D3 solution create a new HTML project in your IDE. Add a reference to the D3 library and then copy and paste the generated JavaScript code from the OBIEE narrative between some <script> tags. You should end up with something like this:-
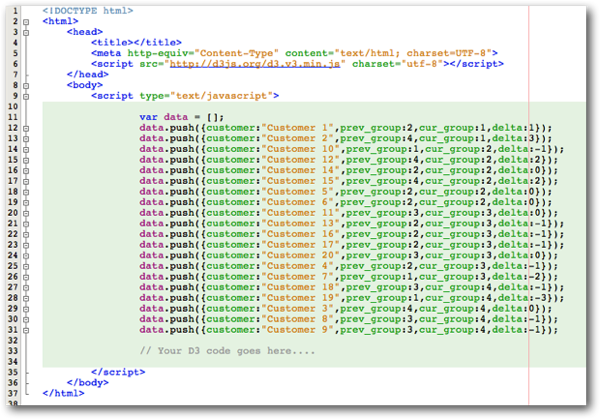
You are now ready to make a start, simply save the project and open up the resulting HTML file in your favourite browser to test any changes you make along the way.
When you are ready to embed the finished code into OBIEE you'll first need to decide from where you wish to reference the D3 Library and the D3 Code you have just written. With regards to the D3 library as I mentioned earlier you can either reference the online version of the D3 library or copy the library to the OBIEE server and reference it from there. With the custom D3 code you've written you can again either upload the code to a file on the OBIEE server or you can just copy and paste your code directly into the narrative. I'd recommend uploading it to the OBIEE server so you can reference it in other analyses at a later date but for now let's just paste it in.
Lets have a look at the completed Narrative View.
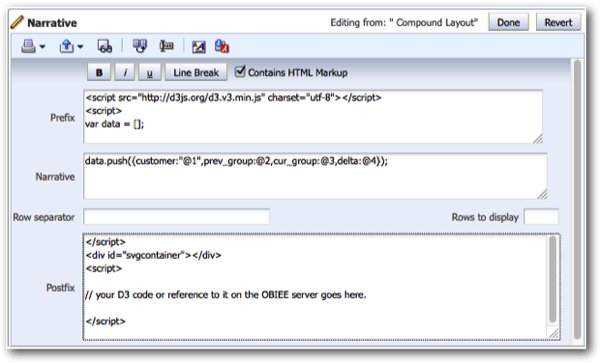
The First thing to note is that the "Contains HTML Markup" checkbox is ticked, this is required as we have now entered some <script> tags and a <div> tag and without this ticked OBIEE will not interpret them correctly. The first <script> tag in the prefix section is referencing the online D3 library. The second <script> tag in the prefix section is closed at the start of the postfix section and wraps around the "data" variable and the JavaScript used to populate it. Below the closing </script> tag in the postfix section we are creating a HTML DIV element that will contain the SVG created by the D3 script. Finally we either enter a reference to our custom D3 script on the OBIEE server or just paste it in between script tags. One important thing to note is that when we transfer the code from our IDE to OBIEE we only want to bring across the D3 code, we want to leave behind the "data" variable and all the html tags as OBIEE will be generating these for us.
So lets take a look at the solution written in D3.
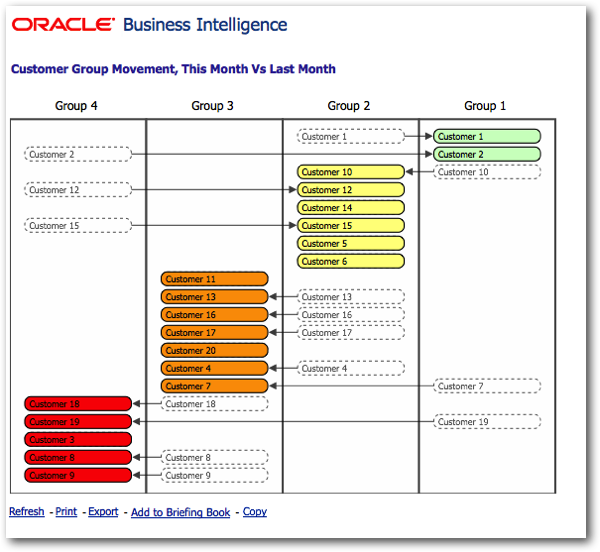
As you can see this contains all the information we require. We can clearly see the current group that the customer occupies and the movement, if any, from the group they occupied the previous month. This could easily be enhanced so that when you hover your mouse over a customer the raw data is presented to the user in some way, you'd simply need to change the narrative section to include a new column from the criteria and the then write the required code in D3 to display it - you really are only limited by your imagination. It may take more time and effort to produce a D3 solution over using a standard OBIEE visual and yes, as with all customisations, you are exposed from a risk point of view when it comes to upgrades and when the person who developed the solution decides to go travel the world but for these edge cases where you just can't get the right result using a standard OBIEE visual, D3 may just save your bacon.
Below is a live demo of the visualisation outside of OBIEE, it is seeded from random data each time you press the reload button.
It's been tested in Firefox, Chrome, Safari and IE9. IE versions 8 and below do not natively support SVG although there are various workarounds, none of which have been implemented in this example.
[iframe src="http://www.rittmanmead.com/wp-content/themes/rittman/d3/d3demo.html" height="450" scrolling="no"]
And here's a link to the code on jsfiddle.net so you can have a play with it yourself. D3 Demo
So in closing here are some tips around developing D3 in OBIEE.
- Try to sketch out on paper what you want your D3 solution to look like and then try a replicate it with code ( the fun bit ! ).
- Head over to d3js.org for some inspiration, there are some truly mind blowing examples on there.
- Use the Narrative view to generate some hard coded data, you can then use it for development and testing purposes.
- Don't develop directly in OBIEE, use a purpose build development IDE
- Once you're ready to go into production with your solution upload the D3 library and your custom code to the OBIEE server and reference it from there.