Building alerts in EM12c with OBIEE Usage Tracking data

Introduction
Enterprise Manager 12c is the latest and greatest incarnation of Oracle’s toolset for Enterprise Management (the clue’s in the name), of which Cloud Control (neé Grid Control) is one of the key tools. It can be used for a unified overview of disparate services including servers, databases, and of course OBIEE. Monitoring and alerting is core to EM12c, as well as extremely flexible management of any problems that arise. EM12c also offers natively all of the control and configuration functionality for OBIEE that exists in its sibling that is installed with all OBIEE installations, Enterprise Manager Fusion Middleware Control.On this blog Mark Rittman wrote in detail about the EM12c in a series of three posts (here, here and here), and Adam Seed gave a detailed example here of how to monitor OBIEE availability using a user login simulated through a "Web Transaction" test.
In this post and the next I am going to expand on what my colleagues have covered, looking firstly at how we can use (dare I say, leverage) Usage Tracking data to drive monitoring and alerting of important areas such as response time and dashboard error rates, and secondly the incorporation of existing JMeter-based performance tests into EM12c.
Terminology
EM12c has a learning curve associated with it. Just as you wouldn’t expect to grok OBIEE in an instant and a comprehension of the basics of the BI Server, an RPD, Answers, and so on will aid a good implementation, the same is true for EM12c. Just like with OBIEE's SampleApp, Oracle kindly provide a VirtualBox machine preinstalled & configured with EM12cR3 for you to test on. It's on eDelivery, linked to from here, listed under Oracle VM Templates (x86 64 bit), Part Number B73896-01.Within EM12c objects are defined as Targets. These include servers (known as hosts), databases, database listeners, but also components of parent targets. For example, the overall FMW Domain for OBIEE is a target, but so is the BI Server and each individual java application deployment running on the WebLogic Server managed server (bi_server1) which is itself also a target

The data for targets is provided by an Agent typically running local to the target. The data consists of various Metrics which are Collected on a periodic basis. The frequency of a metric collection can be configured, with a different Collection Schedule per Metric. One metric that most targets will provide is Status and this particular metric is collected every minute by default. Other metrics are collected less frequently, from every 15 minutes up to once a day or less.
 Alerts within EM12c are primarily handled through Incidents, which are concisely defined as “[…a] situation or issue you need to act on”. Incidents are created from the occurence of one or more Events, which are basically something (not necessarily 'bad') that has been measured by EM12c and deemed of interest.
The reference manual gives a nice illustration of how events and incidents are related, here.
A target’s metrics trigger Events through Thresholds, which can be defined at both warning and critical levels if required. The Status metric mentioned above will have a default Critical Threshold of “Down”, which is how EM12c will raise an alert for a component that is not running.

All of the above is core functionality provided by EM12c and in a sense generic to any target. Each target will have its own metrics for which thresholds can be defined, whether this is the OBIEE Presentation Services “Connection Pool Current Authentications” or the deadlock rate in TimesTen.
To provide flexibility in the monitoring that EM12c provides there is the concept of a Service. A Service can have one or more Service Tests defined within it, and these can be a variety of functions that return metrics, such as availability or performance data. From these metrics, thresholds can be defined just as they are against metric data from a pre-defined target, and thus events and notifications driven. A service test can be of many types, including:
- Web Transaction (as used in Adam’s article here)
- SQL query (OCI or JDBC)
- Custom script
Usage Tracking
Usage Tracking is functionality available within OBIEE that logs every user request to the BI Server into a set of tables stored in the RCU (BIPLATFORM) tables. If you don’t have Usage Tracking enabled, you should - period. It’s easy to implement (see here for a step-by-step tutorial from Oracle), and provides a wealth of valuable data including when a report ran, which dashboard it was part of, how long it took, how many rows it returned, and even the query that was sent to the database to run it.The information that Usage Tracking provides supports multiple purposes :
- Short term system monitoring
- Who has been using the system?
- What are the long-running reports?
- System usage profiling
- Which dashboards get used the most?
- Which dashboards never get run?
- Which users are the most active?
- When are the busiest times of day?
- Problem analysis
- Which reports have failed?
- What errors have been logged in report failures?
- Which reports are returning an excessive number of rows of data?
- Which reports are requiring excessive number of queries on the database (and thus adding load to the BI Server in federating the results)?
Usage Tracking consists of two tables, S_NQ_ACCT for the “Logical” query from the user and S_NQ_DB_ACCT for the “Physical” query (or queries) that get sent to the database. Both tables reside in the RCU (BIPLATFORM) schema and can be queried just as you would any table in the database. They can also be modelled into the OBIEE RPD and reported on through the front end, but that’s a separate topic (have a look at the superb SampleApp v309R2 for inspiration).
For this example, let us look at a simple query against the main S_NQ_ACCT table, showing any dashboards that have failed (SUCCESS_FLG !=0) in the past 30 minutes (START_TS > SYSDATE - ( 30 / 1440 )):
SELECT A.USER_NAME        "USER",
       A.SAW_DASHBOARD    "DASHBOARD",
       A.SAW_DASHBOARD_PG "DASHBOARD PAGE",
       A.START_TS         "EXECUTION TIMESTAMP",
       A.ERROR_TEXT,
       A.SUCCESS_FLG
FROM   S_NQ_ACCT A
WHERE  A.SUCCESS_FLG != 0
       AND START_TS > SYSDATE - ( 30 / 1440 )
Knobbling the system to throw an error in OBIEE thus:

We can see the resulting data in Usage Tracking’s S_NQ_ACCT table:

So there’s the error, plain to see if you go looking for it. But – how do we get EM12c to do that for us?
Integrating Usage Tracking into an EM12c Service
Wouldn’t it be useful if our Enterprise Management tool (EM12c) could monitor the rate at which errors were being received by users, and alert us if it goes above a certain rate? I certainly think so. This, and any other Usage Tracking query you care to craft, can be easily integrated into EM12c through the definition of a Service Test using the Oracle SQL Timing test type.
To start with you will create a new Generic Service which is going to be the container for this particular Service Test and any similar ones. Launch the creation process from the EM12c Setup menu in the top-right, then Add Target and Generic Service. I have defined my Generic Service as being called “OBIEE”, associated with an Exalytics system called EXA01. For non-Exalytics, just select the FMW domain (bifoundation_domain) of the system you’re monitoring.

Click Next and leave the Availability definition as “Service Test” and click Next again.
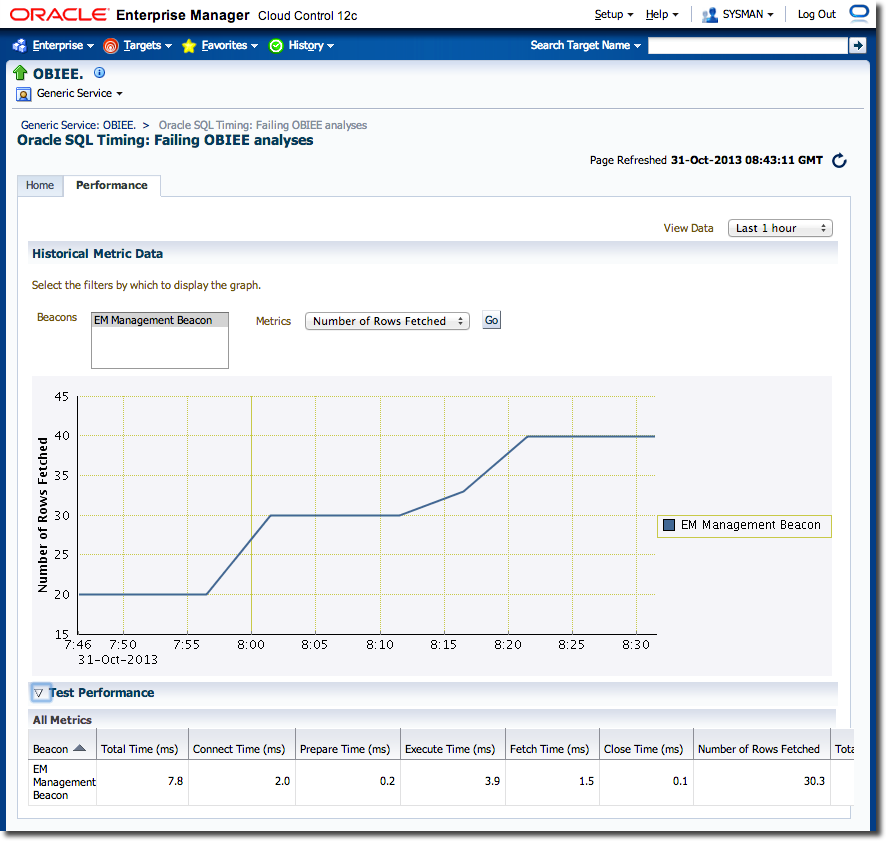
On the Service Test page, set Test Type to Oracle SQL Timing (it doesn’t matter that it’s called a “timing” test even though we’re more interested in the rows returned). Set the Collection frequency to be however often you want to run this check – but make sure the value you choose matches up with the timespan you specify in your SQL otherwise you’ll miss or double-count errors.
Specify your RCU database details and credentials, and then paste your SQL statement into the Query area. Note that whilst the query above brings back details of the failed analysis, the test we’re building is simply looking at the number of rows, so for the sake of brevity our SQL statement could actually just select a single column – it’s the predicate that matters.

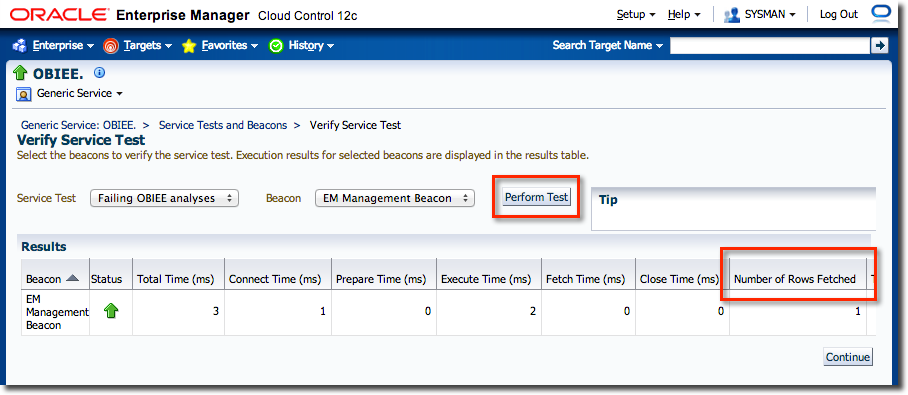
Click Next to move to the Beacons definition page. A Beacon is a host from which the test will be executed. For the purposes of this type of test it doesn’t matter from where it runs, but other types of testing (including JMeter that I’ll talk about in the next post) it is very useful to be able to define multiple, geographically separated, execution hosts (“Beacons”). So for now, just click Add and select the pre-defined EM Management Beacon.
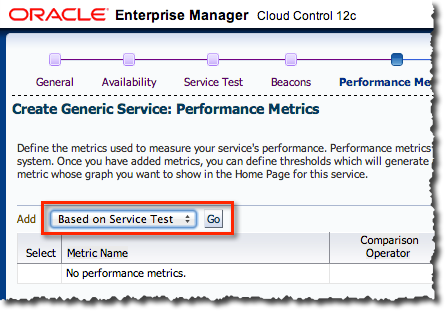
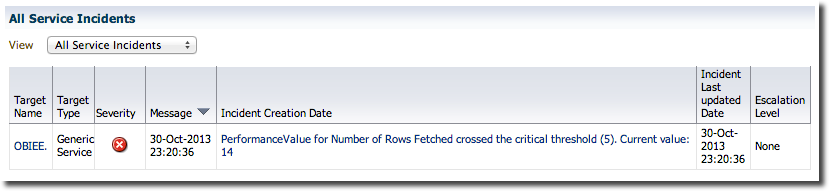
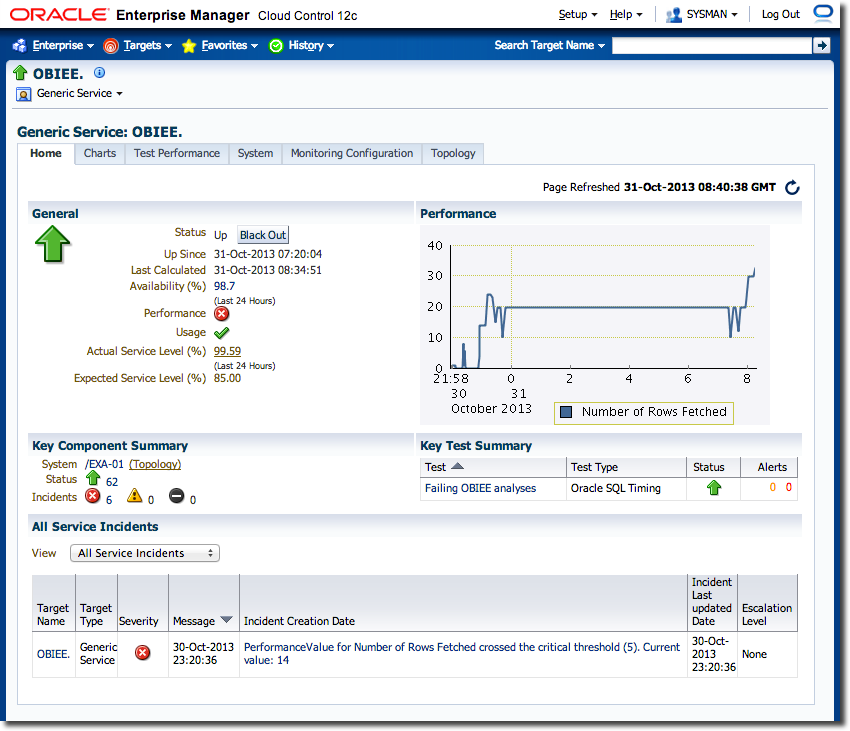
On the next screen, Performance Metrics, click the radio button next to the default Total Time (ms) and click Delete. Then with “Based on Service Test” selected in the menu click on Go

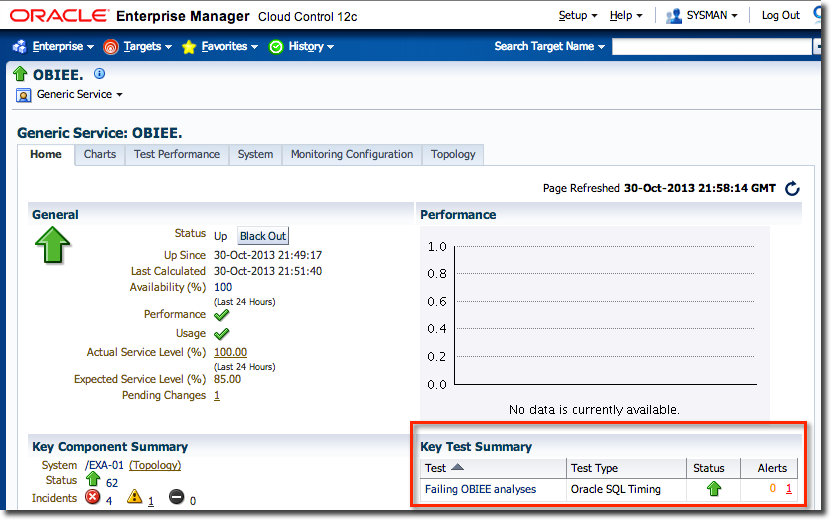
Click on the name of your service and under Key Test summary you should see your service test listed.
Using the same Usage Tracking data but displayed through OBIEE, it is possible to see the actual failures and associated dashboards and users:
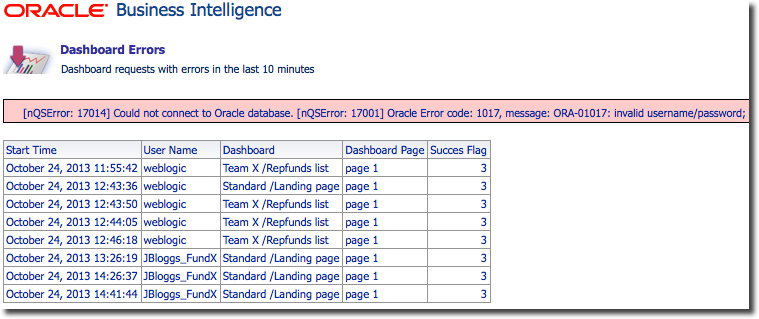
This is using the Usage Tracking RPD that comes with SampleApp v309R2, merged into the existing RPD running on my system. SampleApp also includes a comprehensive set of dashboards based on Usage Tracking data.