OEM12cR3: Holistic BI Platform Monitoring using Systems and Services
Over the past few weeks myself and some of my colleagues have been posting articles on the blog about monitoring OBIEE using Enterprise Manager 12cR3’s BI Management Pack. In the various articles we’ve looked at managing individual OBIEE installations and monitoring various aspects of the product’s performance, using features like metrics, events and thresholds, integration with usage tracking, service beacons, and metric extensions.
But in each case we’ve looked at an OBIEE installation in isolation, and always from the perspective of the “system” - which makes sense if where you’re coming from is OBIEE’s Fusion Middleware Control, and you’re looking for a better way of working with OBIEE’s built-in instrumentation. But a typical BI system consists of more than just OBIEE - the database providing data for OBIEE is going to play a major part in the performance of your system, and in most cases there’ll be an ETL server loading data into it, such as Oracle Data Integrator or Informatica PowerCenter. In some cases Essbase may be providing subsets of the data or acting as an aggregation layer, and of course all of these infrastructure components run on host servers, either physical or virtualised. Wouldn’t it make more sense to look at this platform as a whole, measuring performance across it and considering all aspects of it when determining if it’s “available”?
Moreover, whilst it makes sense for you to consider just the indicators and metrics coming out of OBIEE when judging the performance of your system, for your end-users, they don’t think in terms of disk throughput or cache hits when considering system performance - what they talk about when they call you with a problem is the time it takes to log in; or the time it takes to bring up their dashboard page; or, indeed, whether they can log into the system at all. In fact, it’s not unknown for users to ring up and say the system is performing terribly, when in fact all the indicators on your DBA dashboard are showing green, and as far as you’re concerned, all is fine. So how can you align your view of the status of your system with what your users are experiencing, and indeed consider all of the BI platform when making this call? In fact, there are two features in Enterprise Manager and the BI Management Pack that make this possible - “systems” and “services” - and whilst they’re not all that well-known, they can make a massive impact on how holistically you view your system, when you put them in-place. Let’s take a look at what’s involved, based on something similar I put in place for a customer this week.
As I mentioned before, most people’s use of Enterprise Manager involves looking at an individual infrastructure component - for example, OBIEE - and setting up one or more metric thresholds and alerts to help monitor its performance.
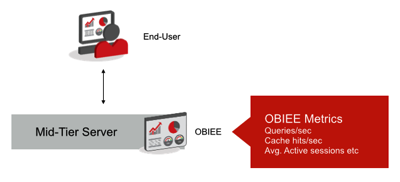
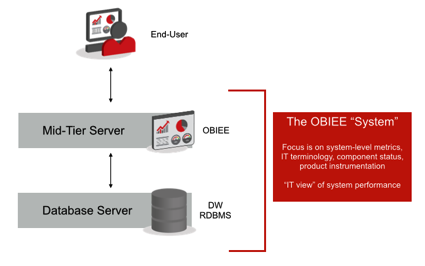
But in reality OBIEE is just part of the overall BI platform that you need to monitor, if you’re going to understand end-to-end performance of your system. In Enterprise Manager terms, this is your “system”, and you can define a specific object called a “system” within your EM metadata, which aggregates all of these components together, giving you your “IT” view of your BI platform.
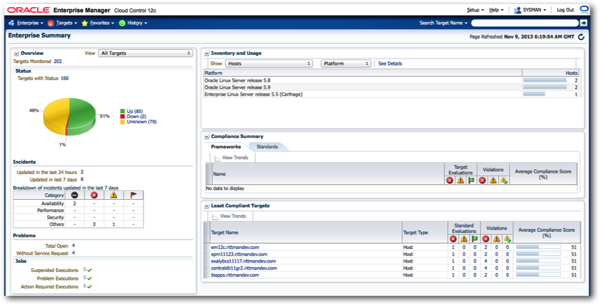
In the screenshot below, I’ve got an EM12cR3 instance set-up, and in the bottom right-hand corner you can see a list of systems managed by EM, including an Exalytics system, a BI Apps system, one running EPM Suite and another running and Oracle database. In fact, the OBIEE system relies on the Database system for its source data, but you wouldn’t be able to tell that from the default way they’re listed, as they’re all shown as independent, separate from each other.
What I can do though is aggregate these two installs together as a “system”, along with any other components - the Essbase server in the EPM stack, for example - that play a part in the overall platform. To create this system, I select Targets > Systems from the top-most menu, and then press Add > Generic System when the Systems overview page is displayed.
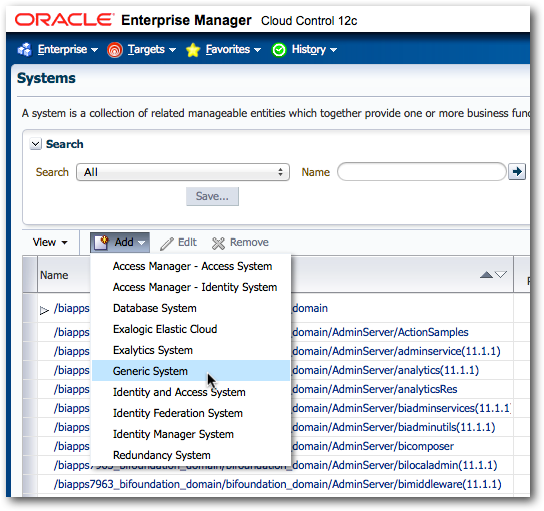
Note the other types of systems available - all of them except for Generic System add particular capabilities for that particular type of setup, but Generic System is just a container into which we can add any random infrastructure components, so we’ll use this to create the system to bring together our BI components.
Once the page comes up to create the new system, when you add components to it, notice how each part of each constituent “product” is available to include at different levels of granularity. For example, you can add OBIEE to the system “container” either at the whole BI Instance level - all the BI servers, BI Presentation servers and so on for a full deployment - or you can add individual system components, Essbase servers, DAC servers if that’s more relevant. In my case, I’ve got a couple of options - as it’s actually an Exalytics server, I could add that as a top-level component (complete with TimesTen, Essbase and so on), or I could just add the BI Instance, which is what I’ll do in this case by selecting that target type and then choosing the BI Instance from the list that’ll then be displayed.
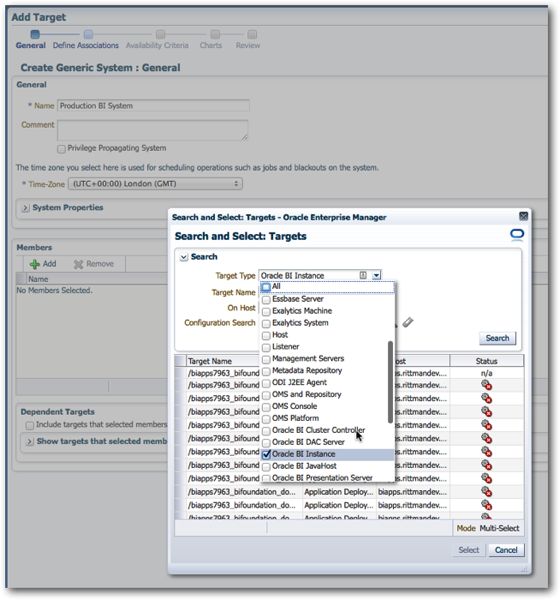
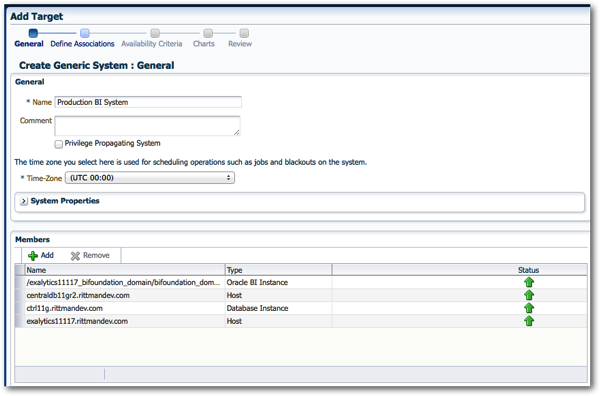
In total I add in four targets - the OBIEE and database instances, and the hosts they run on. Later on, once I register my ODI servers using the new DI Management Pack, I can bring those in as well.
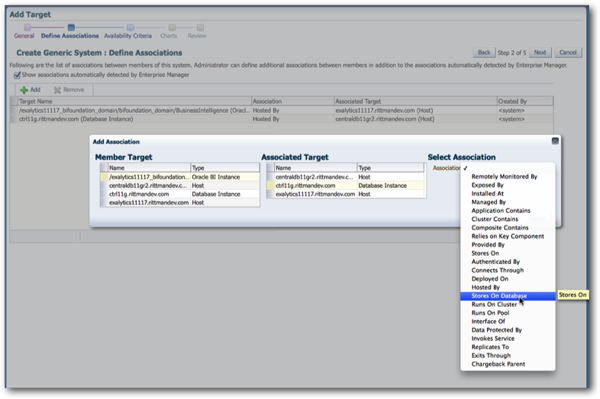
The next step is to define the associations, or dependencies, in the system. The wizard automatically adds the association between the BI instance and its host, and the database instance and its host, but I can then manually add in the dependency that the BI instance has on the database, so that later on, I can say that BI being down is directly related to its database being down (something called “root causal analysis”, in EM terminology).
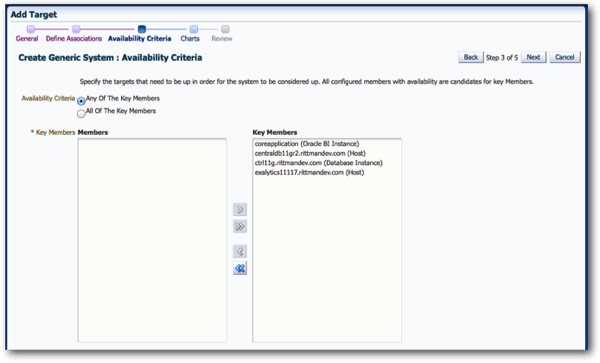
On the next page of the wizard, I can specify which parts of the system have to be up, in order for the whole system to be considered “available”. In this case,all parts, or “targets” need to be running for the system to be OK, but if I had an ETL element, for example, then this could possibly be down but the overall system still be “available” for use, albeit in degraded form.
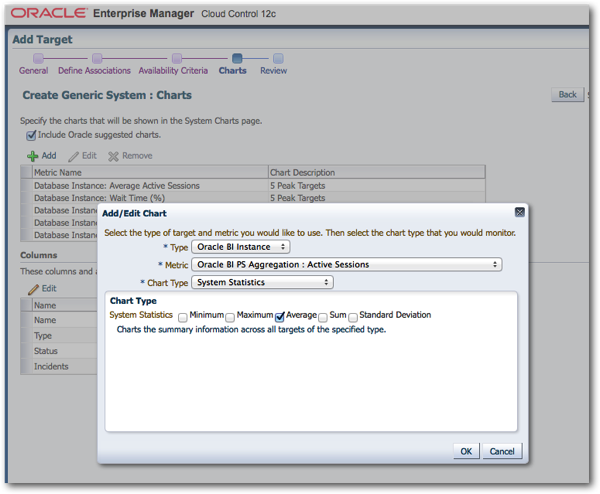
Next I can select a set of charts, that will be displayed along with the system overview details, from the charts and metrics available for each consistent product. By default a set of database and host charts are pre-selected, but I can add in ones specific to OBIEE - for example, total number of active sessions - from the BI Instance list.
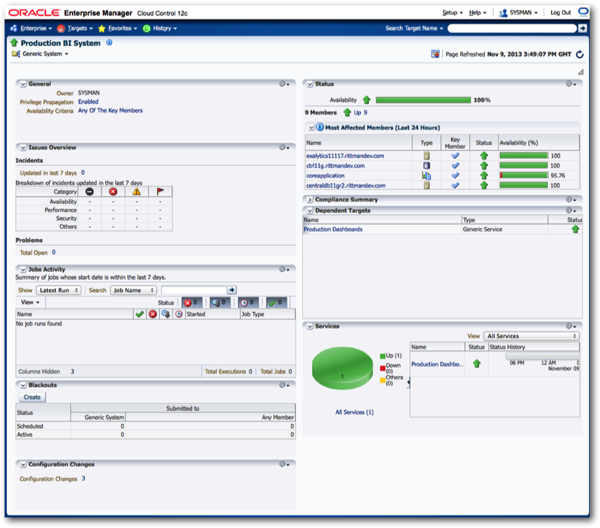
Once that final step is completed, the system is then created and I can see the overall status of it, along with any incidents, warnings, alerts and so on, across the platform.
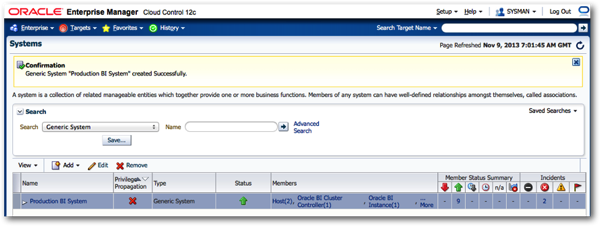
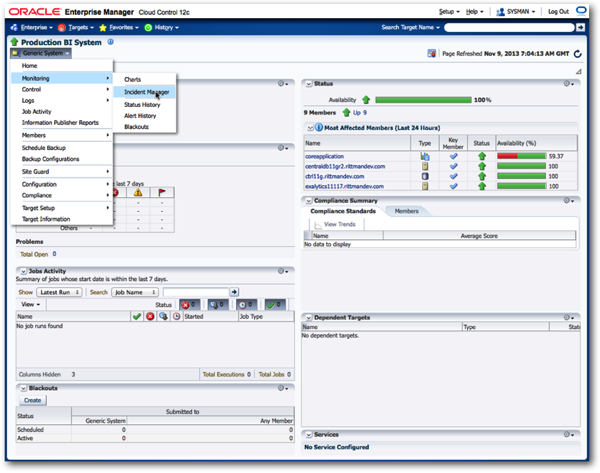
If I had multiple systems to manage here, I’d see them all listed in the same place, with their overall status, and a high-level view of their alert status. Drilling into this particular system, I can then see a “single pane of glass” overview of the whole system, including the status of the constituent components.
So far, so good. But this is only part of the story. Whilst this is great for the IT department, the terminology it uses - “systems”, “metrics”, “system tests” and so forth - aren’t the terms that the end-users use. They’re thinking about OBIEE as a “service” - a service providing dashboards, reports, a dashboard login and so on, and so EM has another concept, called a “service”, that builds on the system we’ve just put together, but adds a layer of business-focus to the setup.
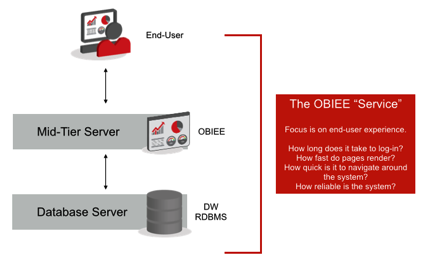
Adam Seed touched on the concept of a “service” in his post on service beacons the other week, but they’re much more than an enabler of browser-based tests. Creating a service along with our system gives us the ability to add an extra layer of end-user focus to our EM setup, so that when our users call up and say - I can’t log in, or - It takes ages to bring up my dashboard page - we’ve got a set of metrics and tests aligned with their experience, and we’re immediately aware of the issues they’re hitting.
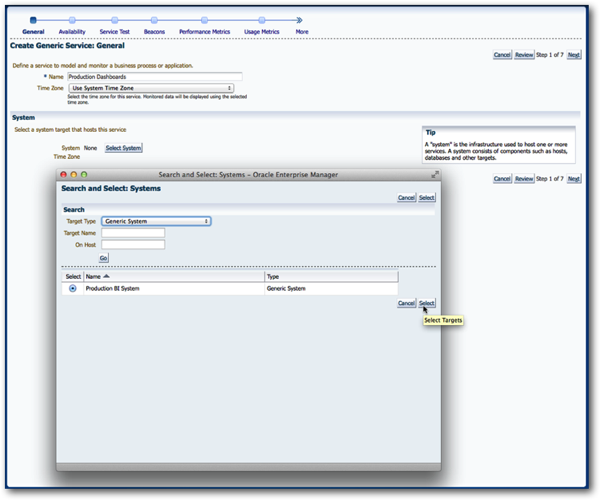
To create a service, we first need a system on which it will be delivered. As we’ve now got this, lets go back to the EM menu and select Targets > Services, and then select Create > Generic Service. On the next page, I name the service - for example. “Production Dashboards”, and then select the system I just created as the one that provides it.
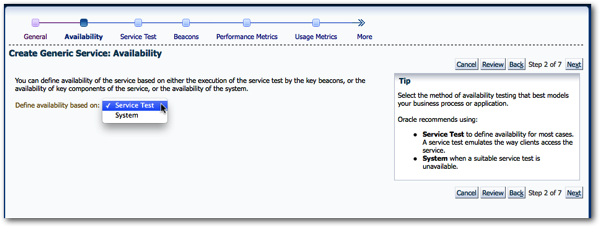
Now the key thing about a service, is how we test for its “availability”. With EM’s services, availability can either be determined by the status of the underlying system, or more usefully, we can define one or more “service” tests that checks things from a more end-user perspective. We’ll select “Service Test” in this instance, and then move onto the next page of the wizard.
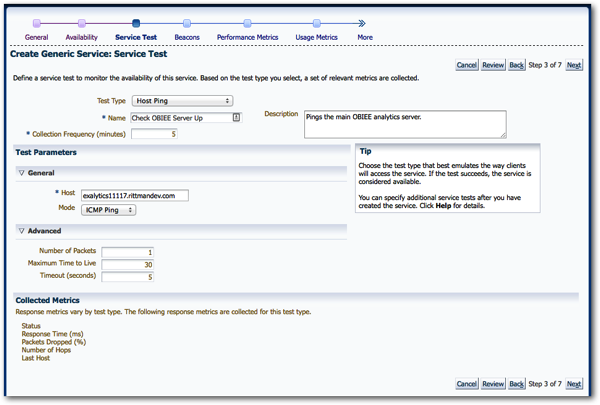
Now there are lots of service test types you can use, and Adam Seed’s post went through the most useful of them, one that records a set of browser actions and replays them to a schedule, simulating a user logging in, navigating around the OBIEE website and then logging out. Unfortunately, this requires Internet Explorer to record the browser session, so I’ll cheat and just set up a host ping, which isn’t really something you’d want in real life but if gets me onto the next stage (Robin Moffatt also covered using JMeter to do a similar thing, in his post the other day on the blog).
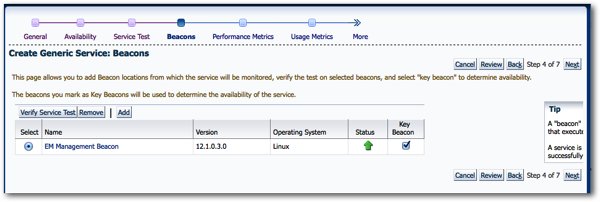
Next, I say where this test will run from. Again, for simplicity’s sake I just select the main EM server, but in reality you’d want to run this test from where the users are located, by setting up what’s called a “service beacon”, a feature within the EM management agent that can run tests like these geographically close to where the end-users are. That way, you can measure the service they’re actually receiving from their office (potentially, in a different country to where OBIEE is installed), giving you a more realistic measurement of response time.
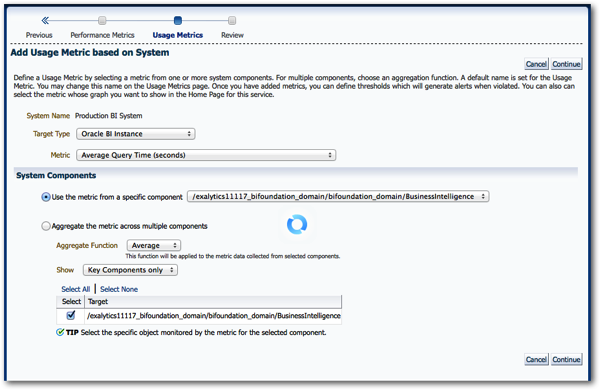
I then go on to say what response times are considered OK, warning and critical, and then I can also associate system-level metrics with this service as well. In this case I add in the average query response time, so that service availability in the end will be determined by the contactability of the OBIEE server (a substitute in this case for a full browser login simulation), and respond time being within a certain threshold.
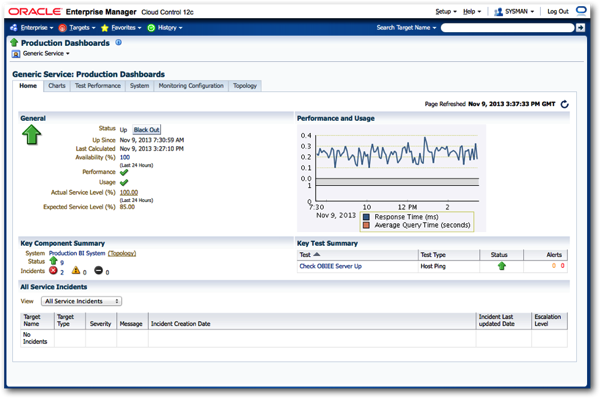
I then save the service definition, and then go and view it within EM. In the screenshot below, I’ve left EM overnight so that the various performance metrics and the service test can run for a while, and you can see that as of now, everything seems to be running OK.
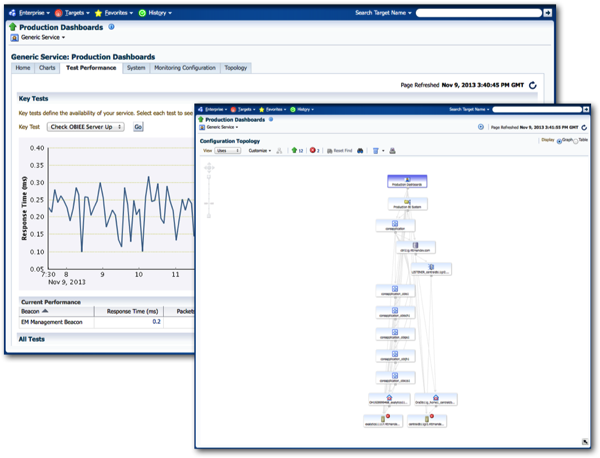
Clicking on the Test Performance tab shows me the output of each of my service tests (in this case, just the host ping), whilst the Charts page shows the me output of the system performance metrics that I selected when creating the service. Clicking on Topology, moreover, shows me a graphical view of the service and its underlying system, so I can understand and visualise the relationships between the various components within it.
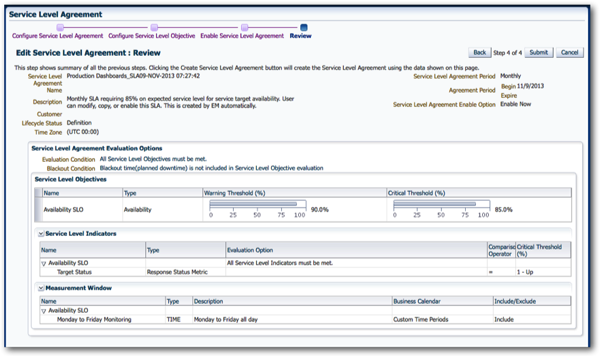
Another important part of services’ end-user-level focus is the ability to create service-level agreements. These are more formal versions of metric thresholds, this time based on service tests rather than system tests, and allow you to define service level indicators based on the tests you’ve created before, and then measure performance against agreed tolerances over a period of time. If you’ve got an SLA agreed with your customer that, for example, 95% of reports render within five seconds, or that the main dashboard is available 97% of the time during working hours, you can capture that SLA here and then automatically report against it over time. More importantly, if you’re starting to fall outside of your SLA, you can use EM to raise events and incidents in the meantime so you’re aware of the issue, and you can work to rectify it before it becomes an issue in your monthly customer meeting.
Finally - and this is something I find really neat - the system overview page for the system I created earlier now references the service that it supports, so I can see, at a glance, not only the status of the infrastructure components that I’m managing, but also the status of the end-user service that it’s supporting. Not bad, and a lot better than trying to manage all of these infrastructure components in isolation, and trying to work out myself what their performance means in terms of the end-users.
So there you have it - systems and services in EM and the BI Management Pack - a good example of what you get when you move from Fusion Middleware Control to the full version of Oracle’s Enterprise Systems Management platform.