Installing obi-metrics-agent, Graphite, and collectl

In the previous post I introduced obi-metrics-agent, an open-source tool from Rittman Mead that can collect DMS metrics from OBIEE and write them to several formats including graphite. Graphite is a tool for storing and graphing time-based metrics.
Now in this post we will look at how to install the tools and get them up and running on your server. The install process has been tested on both OL5 and OL6 (and so by extension, Cent OS and RHEL). There's no reason why it oughtn't work on other *nixes, but it's not been tested.
I’m using Oracle’s SampleApp v309R2 server which is built on Oracle Linux (OL) 5 so that anyone can try this out at home running it on VirtualBox (or VMWare Fusion). I've also tested this on the latest SampleApp v406 - there is one additional step to run, see the paragraph below for details
There are three parts to the obi-metrics-agent installation.
- obi-metrics-agent - python script to extract DMS metrics from OBIEE
- [optional] Graphite - store and graph data, including that extracted from
obi-metrics-agentandcollectl - [optional] collectl - OS metrics viewer. Can send data for graphing in Graphite
Only one of these is mandatory - the installation of obi-metrics-agent itself. That in itself is just a case of cloning the repository in order to get the obi-metrics-agent python script on the server. However, the remaining articles in this blog series will assume that graphite and collectl have also been installed, so these are covered too.
Assumptions & pre-requisites
- Server has internet access (try
ping google.comto check) - Installation is running as the
oracleuser - Installation path is
/home/oracle/graphite - User has sudo rights
Before you run this on SampleApp v309R2 (not v406), you must first run the following to fix a bug in yum's configuration. If you're not running SampleApp, you don't need to do this:
sudo sed -i.bak -e 's/proxy=/#proxy=/g' /etc/yum.conf
You need the EPEL yum repository setup (for packages such as git, etc):
- OL 5/Cent OS 5/RHEL 5 (including SampleApp v309R2):
sudo rpm -Uvh http://dl.fedoraproject.org/pub/epel/5/i386/epel-release-5-4.noarch.rpm
- OL 6/Cent OS 6/RHEL 6:
sudo rpm -Uvh http://dl.fedoraproject.org/pub/epel/6/`uname -p`/epel-release-6-8.noarch.rpm
Additional step for SampleApp v406
If you are installing this on Oracle's SampleApp v406, run the following first:
sudo yum remove -y pixman
If you don't do this, there is a package conflict when dependencies for py-cairo are installed that causes the whole setup to fail. The root error you'll find is:
Error:  Multilib version problems found. This often means that the root
       cause is something else and multilib version checking is just
       pointing out that there is a problem. Eg.:

[...]
       Protected multilib versions: pixman-0.26.2-5.el6_4.i686 != pixman-0.26.2-5.1.el6_5.x86_64
Installation
The bulk of the installation is done by a couple of shell scripts. To get these, you should clone the git repository. The following steps will do this.
Now run the following to install git and clone the repository:
sudo yum install -y git
export FMW_HOME=/home/oracle/obiee # Change this value for your installation
#export FMW_HOME=/app/oracle/biee # Use this for SA406
cd $FMW_HOME
git clone https://github.com/RittmanMead/obi-metrics-agent.git
Then launch the installation:
- OL5: (including SampleApp v309 and earlier)
cd obi-metrics-agent
./install-ol5.sh
- OL6: (including SampleApp v406)
cd obi-metrics-agent
./install-ol6.sh
This will install git (if not present), and create a folder called obi-metrics-agent in the installation folder of OBIEE (FMW Home). You can put obi-metrics-agent wherever you want, this locating is just a suggestion.
The installation for Graphite builds a standalone python environment using virtualenv in which graphite will run under Python 2.6. The reason for this is that OL5 ships with Python 2.4 (Noah was seen coding in this shortly before boarding his ark) and the OS' python version cannot be easily upgraded without causing all sorts of complications. Virtualenv is generally a good way to deploy python applications in isolation from others, so is also used for the OL6 version of the install.
The script will take a few minutes to run. Once complete, you can test the installation following the steps below. Do note that Graphite is somewhat notorious for installation problems, so whilst these instructions have been tested, you may hit quirks on your own server that may need a bit of Google-Fu to resolve. If you want to follow step-by-step instructions detailing each step, they are provided:
- Oracle Linux 5 (including Cent OS 5 and RHEL 5)
- Oracle Linux 6 (including Cent OS 6 and RHEL 6)
If you're on a different *nix platform then feel free to adapt the install scripts and submit a pull request. Graphite works flawlessly on Debian-based distributions, and there is no reason why you should run it local to the OBIEE server on which obi-metrics-agent is running.
Testing the installation
Testing obi-metrics-agent
First, start up the OBIEE stack and make sure that you can login to OBIEE. One it is running, you can run obi-metrics-agent by entering:
export FMW_HOME=/home/oracle/obiee # Change this value for your installation
export OPMN_BIN=$FMW_HOME/instances/instance1/bin/opmnctl
python $FMW_HOME/obi-metrics-agent/obi-metrics-agent.py
Expected output:
[...]
--Gather metrics--
    Time of sample: Wed, 19 Mar 2014 22:27:42 +0000 (1395268062)

    Get metrics for coreapplication_obips1
         Processed :    469 data values @ Wed, 19 Mar 2014 22:27:42 +0000       Oracle BI Presentation Server
            Appended CSV data to ./data/metrics.csv
    Get metrics for coreapplication_obis1
         Processed :    229 data values @ Wed, 19 Mar 2014 22:27:42 +0000       Oracle BI Server
            Appended CSV data to ./data/metrics.csv
    Get metrics for opmn
         Processed :    91 data values @ Wed, 19 Mar 2014 22:27:42 +0000        opmn
            Appended CSV data to ./data/metrics.csv

    Processed: 3    Valid: 3 (100.00%)      Invalid: 0 (0.00%)
    -- Sleeping for 5 seconds (until 1395268062)--
[...]
For more advanced options, including sending data to graphite, see below.
Testing Graphite
Go to http://<server>/ and you should see the Graphite launch page:
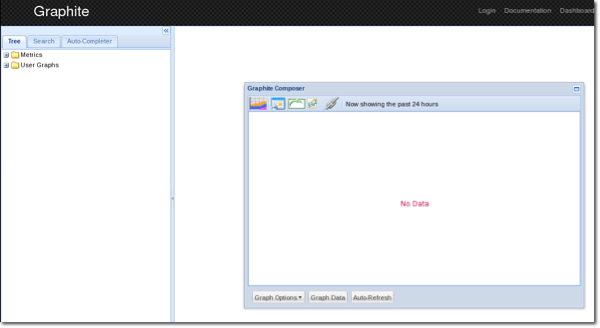
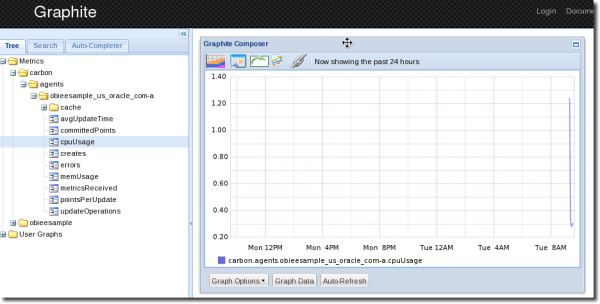
By default Graphite will collect data about its own performance, of the carbon agent. This means you can easily test that Graphite's graphs are working by selecting one of the carbon metrics to graph. Expand the Metrics tree and click cpuUsage which will add it into the graph in the main pane:
Graphite is installed with a default user oracle with password Password01.
Testing collectl
From the command line enter collectl:
[oracle@obieesample obi-metrics-agent]$ collectl
waiting for 1 second sample...
#<--------CPU--------><----------Disks-----------><----------Network---------->
#cpu sys inter  ctxsw KBRead  Reads KBWrit Writes   KBIn  PktIn  KBOut  PktOut
   1   0   340    430      0      0      0      0      0      0      0       0
   0   0   444    499     48      2      0      0      0      1      0       1
   1   0   316    430      0      0      0      0      0      1      0       1
(press Ctrl-C to exit)
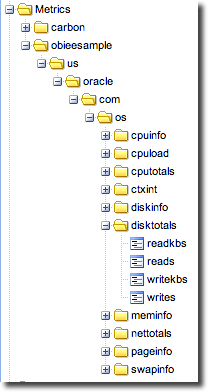
To check that collectl is successfully sending data to Graphite go to Graphite and under the Metrics folder you should see your machine's hostname (for example obieesample for SampleApp). Under that should be the metrics that collectl is sending to Graphite:
Graphing OBIEE DMS metrics in Graphite
Now that we've gone through the installation, let us see how to use the three components together, graphing out some OBIEE DMS data in Graphite.
Run obi-metrics-agent.py as you did in the test above, but this time specify the output carbon and carbon-server parameters
export OPMN_BIN=$FMW_HOME/instances/instance1/bin/opmnctl
python $FMW_HOME/obi-metrics-agent/obi-metrics-agent.py --output carbon --carbon-server localhost
Now go to Graphite at http://<server>/ and under Metrics you should see all of the OBIEE DMS metrics in folders. Note that it may take a couple of minutes for the metrics to first appear in Graphite. If you don't see them, or the complete list, wait a minute and then hi
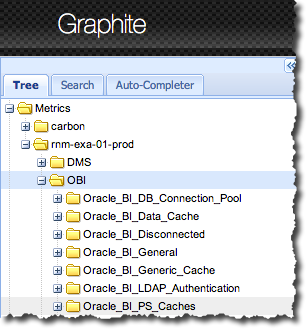
(the DMS folder is metrics relating to DMS itself - the OBIEE DMS metrics are under OBI)
Find the metric for Presentation Services logged in sessions, Oracle_BI_PS_Sessions.Sessions_Logged_In and click on it to add it to the graph. By default the graph shows a large time period so click on the Select Recent Data icon
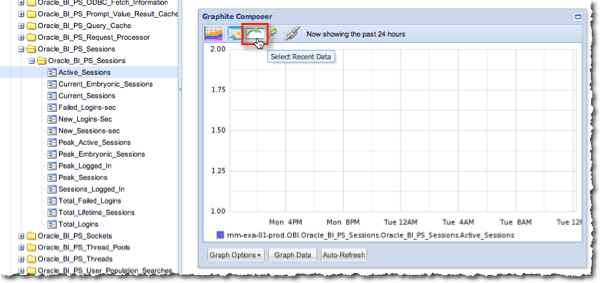
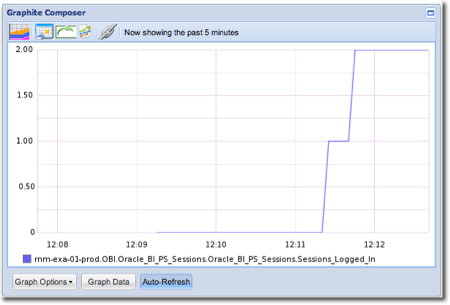
Set the time period to 5 minutes, and click the Auto-Refresh button at the bottom of the graph.
Now log in to OBIEE, and go back to the Graphite page - you should see that the metric has increased accordingly.
I'll look at using Graphite in detail in a later blog post; this is just to demonstrate that the collection and rendering is working.
Different ways of using obi-metrics-agent
obi-metrics-agent has three modes of operation:
- Collect and parse metrics to output
- Near-real-time rendering of OBI metrics in Graphite
- Near-real-time load of data into Oracle (via CSV & external table)
- Collect metrics to disk only
- For analysis at a later date
- If graphite/carbon is not available to send data to
- If outbound network bandwidth is constrained (or could be, by OBIEE)
- For lowest host system overhead
- Parse existing metrics from disk
- Parse previously collected data and output to Graphite or Oracle (via CSV & external table)
Syntax
Options:
  -h, --help            show this help message and exit
  -o OUTPUTFORMAT, --output=OUTPUTFORMAT
                        The output format(s) of data, comma separated. More
                        than one can be specified. Unparsed options: raw, xml
                        Parsed options: csv , carbon, sql
  -d DATA, --data-directory=DATA
                        The directory to which data files are written. Not
                        needed if sole output is carbon.
  -p, --parse-only      If specified, then all raw and xml files specified in
                        the data-directory will be processed, and output to
                        the specified format(s) Selecting this option will
                        disable collection of metrics.
  --fmw-instance=FMW_INSTANCE
                        Optional. The name of a particular FMW instance. This
                        will be prefixed to metric names.
  --carbon-server=CARBON_SERVER
                        The host or IP address of the Carbon server. Required
                        if output format 'carbon' specified.
  --carbon-port=CARBON_PORT
                        Alternative carbon port, if not 2003.
  -i INTERVAL, --interval=INTERVAL
                        The interval in seconds between metric samples.
  --opmnbin=OPMN_BIN    The complete path to opmnctl. Watch out for spaces.
For further details and syntax examples, see the USAGE.MD file in the github repository.