Enable Your Dashboard Designers to Concentrate on User Experience Rather Than Syntax (or How to Add a Treemap in Two Lines)
JavaScript is a powerful tool that can be used to add functionality to OBIEE dashboards. However, for many whose wheelhouses are more naturally aligned with Stephen Few rather than John Resig, adding JavaScript to a dashboard can be intimidating. To facilitate this process, steps can be taken to centralize and simplify the invocation of this code. In this post, I will demonstrate how to create your very own library of custom HTML tags. These tags will empower anyone to add 3rd party visualizations from libraries like D3 without a lick of JavaScript experience.
What is a “Custom Tag”?
Most standard HTML tags provide very simple behaviors. Complex behaviors have typically been reserved for JavaScript. While, for the most part, this is still the case, custom tags can be used to provide a more intuitive interface to the JavaScript. The term “custom tag” library refers to a developer defined library of HTML tags that are not natively supported by the HTML standard, but are instead included at run-time. For example, one might implement a <RM-MODAL> tag to produce a button that opens a modal dialog. Behind the scenes, JavaScript will be calling the shots, but the code in your narrative view or dashboard text section will look like plain old HTML tags.
Developing a JavaScript Library
The first step when incorporating an external library onto your dashboard is to load it. To do so, it’s often necessary to add JavaScript libraries and css files to the <head> of a document to ensure they have been loaded prior to being called. However, in OBIEE we don’t have direct access to the <head> from the Dashboard editor. By accessing the DOM, we can create style and script src objects on the fly and append them to the <head>. The code below appends external scripts to the document’s <head> section.
Figure 1. dashboard.js
01 function loadExtFiles(srcname, srctype){
02    if (srctype=="js"){
03      var src=document.createElement('script')
04      src.setAttribute("type","text/JavaScript")
05      src.setAttribute("src", srcname)
06    } else if (srctype=="css"){
07       var src=document.createElement("link")
08       src.setAttribute("rel", "stylesheet")
09       src.setAttribute("type", "text/css")
10       src.setAttribute("href", srcname)
11    }
12
13    if ((typeof src!==undefined) && (src!==false)) {
14       parent.document.getElementsByTagName("head")[0].appendChild(src)
15    }
16 }
17
18 window.onload = function() {
19   loadExtFiles("/rm/js/d3.v3.min.js", "js")
20   loadExtFiles("/rm/css/visualizations.css", "css")
21   loadExtFiles("/rm/js/visualizations.js", "js")
22 }
In addition to including the D3 library, we have included a CSS file and a JavaScript file, named visualizations.css and visualizations.js respectively. The visualizations.css file contains the default formatting for the visualizations and visualizations.js is our library of functions that collect parameters and render visualizations.
The D3 gallery provides a plethora of useful and not so useful examples to fulfill all your visualizations needs. If you have a background in programming, these examples are simple enough to customize. If not, this is a tall order. Typically the process would go something like this:
- Determine how the data is currently being sourced.
- Rewrite that section of the code to accept data in a format that can be produced by OBIEE. Often this requires a bit more effort in the refactoring as many of the examples are sourced from CSV files or JSON. This step will typically involve writing code to create objects and add those objects to an array or some other container. You will then have to determine how you are passing this data container to the D3 code. Will the D3 code be rewritten as a function that takes in the array as a parameter? Will the array be scoped in a way that the D3 code can simply reference it?
- Identify how configurations like colors, sizing, etc. are set and determine how to customize them as per your requirements.
- Determine what elements need to be added to the narrative view to render the visualization.
If you are writing your own visualization from scratch, these same steps are applied in the design phase. Either way, the JavaScript code that results from performing these steps should not be the interface exposed to a dashboard designer. The interface should be as simple and understandable as possible to promote re-usability and avoid implementation syntax errors. That’s where custom HTML tags come in.
Wait… Why use tags rather than exposing the Javascript function calls?
Using custom tags allow for a more intuitive implementation than JavaScript functions. Simple JavaScript functions do not support named arguments. What this means is JavaScript depends on order to differentiate arguments.
<script>renderTreemap("@1", "@2", @3, null, null, "Y");</script>
In the example above, anyone viewing this call without being familiar with the function definition would have a hard time deciphering the parameters. By using a tag library to invoke the function, the parameters are more clear. Parameters that are not applicable for the current invocation are simply left out.
<rm-treemap name="@1" grouping="@2" measure=@3 showValues="Y"/>
That being said, you should still familiarize yourself with the correct usage prior to using them.
Now some of you may be saying that named arguments can be done using object literals, but the whole point of this exercise is to reduce complexity for front end designers, so I wouldn’t recommend this approach within the context of OBIEE.
What do these tags look like and how do they pass the data to the JavaScript?
For this example, we will be providing a Treemap visualization. As could be expected, the example provided by the link is sourced by a JSON object. For our use, we will have to rewrite that code to source the data from the attributes in our custom HTML tags. The D3 code is expecting a hierarchical object made up of leaf node objects contained within grouping objects. The leaf node objects consists of a “name” field and a “size” field. The grouping object consists of a “name” field and a “children” field that contains an array of leaf node objects. By default, the size values, or measures, are not displayed and are only used to size the nodes. Additionally, the dimensions of the treemap are hard coded values. Inevitably users will want to change these settings, so for each of the settings which we want to expose for configuration we will provide attribute fields on the custom tag we build. Ultimately, that is the purpose of this design pattern.
- Name you custom tag
- Identify all your inputs
- Create a tag attribute for each input
- Within a javascript library, extract and organize the the values
- Pass those values to D3
For this example we will configure behaviours for a tag called <rm-treemap>. Note: It is a good practice to add a dash to your custom tags to ensure they will not match an existing HTML tag. This tag will support the following attributes:
- name - Name of the dimension being measured
- measure: - Used to size the node boxes
- grouping: - Used to determine color for node boxes
- width: Width in pixels
- height: Height in pixels
- showValues: Y/N
It will be implemented within a narrative view like so:
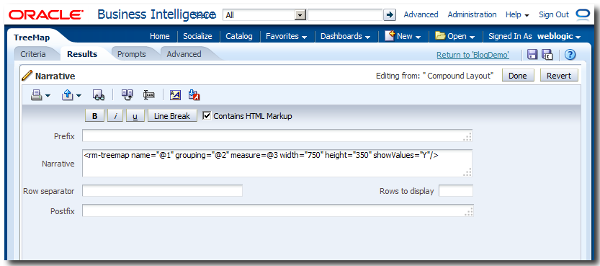
<rm-treemap name="@1" grouping="@2" measure=@3 width="700" height="500" showValues="Y"/>
In order to make this tag useful, we need to bind behaviors to it that are controlled by the tag attributes. To extract the attribute values from <rm-treemap>, the javascript code in visualizations.js will use two methods from the Element Web API, Element.getElementsByTagName and Element.getAttributes.
Fig 2. Lines 8-11 use these methods to identify the first <rm-treemap> tag and extract the values for width, height and showValues. It was necessary specify a single element, in this case the first one, as getElementsByTagName returns an array of all matching elements within the HTML document. There will most likely be multiple matches as the OBIEE narrative field will loop through query results and produce a <rm-treemap> tag for each row.
In Fig 2. Lines 14-41, the attributes for name, measure and grouping will be extracted and bound to either leaf node objects or grouping objects. Additionally lines 11 and 49-50 configure the displayed values and the size of the treemap. The original code was further modified on line 62 to use the first <rm-treemap> element to display the output.
Finally, lines 99-101 ensure that this code only executed when the <rm-treemap> is detected on the page. The last step before deployment is documentation. If you are going to go through all the trouble of building a library of custom tags, you need to set aside the time to document their usage. Otherwise, regardless of how much you simplified the usage, no one will be able to use them.
Figure 2. visualizations.js
 01 var renderTreemap = function () {
 02    // Outer Container (Tree)
 03    var input = {};
 04    input.name = "TreeMap";
 05    input.children = [];
 06
 07    //Collect parameters from first element
 08    var treeProps = document.getElementsByTagName("rm-treemap")[0];
 09    canvasWidth = treeProps.getAttribute("width") ? treeProps.getAttribute("width") : 960;
 10    canvasHeight = treeProps.getAttribute("height") ? treeProps.getAttribute("height") : 500;
 11    showValues = treeProps.getAttribute("showValues").toUpperCase();
 12
 13    // Populate collection of data objects with parameters
 14    var mapping = document.getElementsByTagName("rm-treemap");
 15    for (var i = 0; i < mapping.length; i++) {
 16          var el = mapping[i];
 17          var box = {};
 18          var found = false;
 19
 20          box.name = (showValues == "Y") ? el.getAttribute("name") +
 21                                          "<br> " +
 22                               el.getAttribute("measure") : el.getAttribute("name");
 23          box.size = el.getAttribute("measure");
 24          curGroup = el.getAttribute("grouping");
 25
 26          // Add individual items to groups
 27         for (var j = 0; j < input.children.length; j++) {
 28            if (input.children[j].name === curGroup) {
 29                input.children[j].children.push(box);
 30                found = true;
 31            }
 32          }
 33
 34          if (!found) {
 35            var grouping = {};
 36            grouping.name = curGroup;
 37            grouping.children = [];
 38            grouping.children.push(box);
 39            input.children.push(grouping);
 40          }
 41    }
 42
 43    var margin = {
 44        top: 10,
 45        right: 10,
 46        bottom: 10,
 47        left: 10
 48    },
 49    width = canvasWidth - margin.left - margin.right,
 50    height = canvasHeight - margin.top - margin.bottom;
 51
 52    // Begin D3 visualization
 53     var color = d3.scale.category20c();
 54
 55     var treemap = d3.layout.treemap()
 56        .size([width, height])
 57        .sticky(true)
 58        .value(function (d) {
 59        return d.size;
 60    });
 61
 62    var div = d3.select("rm-treemap").append("div")
 63        .style("position", "relative")
 64        .style("width", (width + margin.left + margin.right) + "px")
 65        .style("height", (height + margin.top + margin.bottom) + "px")
 66        .style("left", margin.left + "px")
 67        .style("top", margin.top + "px");
 68
 69    var node = div.datum(input).selectAll(".treeMapNode")
 70        .data(treemap.nodes)
 71        .enter().append("div")
 72        .attr("class", "treeMapNode")
 73        .call(position)
 74        .style("background", function (d) {
 75        return d.children ? color(d.name) : null;
 76    })
 77        .html(function (d) {
 78        return d.children ? null : d.name;
 79    });
 80
 81    function position() {
 82        this.style("left", function (d) {
 83            return d.x + "px";
 84        })
 85            .style("top", function (d) {
 86            return d.y + "px";
 87        })
 88            .style("width", function (d) {
 89            return Math.max(0, d.dx - 1) + "px";
 90        })
 91            .style("height", function (d) {
 92            return Math.max(0, d.dy - 1) + "px";
 93        });
 94    }
 95    //End D3 visualization
 96 }
 97
 98  // Invoke visualization code only if rm-treemap tag exists
 99  var doTreemap = document.getElementsByTagName("rm-treemap");
100  if (doTreemap !== null) {
101    renderTreemap();
102  }
Figure 3. visualizations.css
01  .treeMapNode {
02     border: solid 1px white;
03    border-radius: 5px;
04    font: 10px sans-serif;
05    line-height: 12px;
06    overflow: hidden;
07    position: absolute;
08    text-indent: 2px;
09  }
|
Putting it all together
The first step to implementing this code is to make is accessible. To do this, you will need to deploy your code to the weblogic server. Many years ago, Venkatakrishnan Janakiraman, detailed how to deploy code to weblogic in his blog about skinning. For this application this process still applies, however you don’t need to be concerned with the bits about modifying the instanceconfig.xml or skinning.
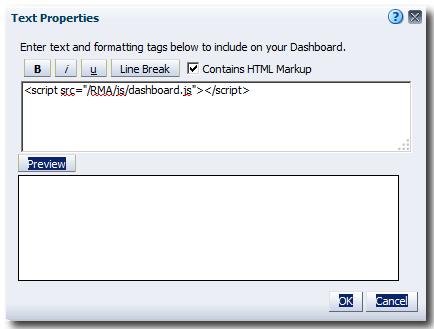
Once that the code has been deployed to the server, there are literally only two lines of code required to implement this visualization. First the libraries need to be included. This is done by sourcing in the dashboard.js file. This can be done within the Narrative view’s prefix field, but I have chosen to add it to a text section on the dashboard. This allows multiple analyses to use the libraries without duplicating the load process in multiple places.
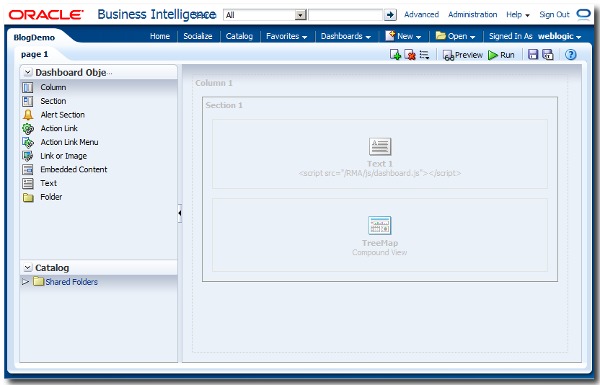
The text section should be configured as follows. (Note: The path to Dashboard.js is relative to the root path specified in your deployment.)
From the Narrative View, add the <rm-treemap> tag to the Narrative field and populate the attributes with the appropriate data bind variables and your desired settings.
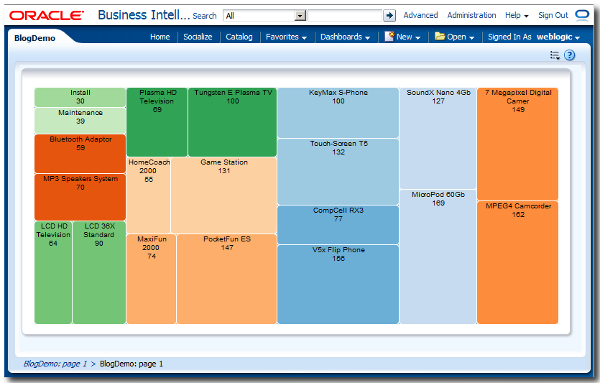
This should result in the following analysis.
In summary:
- Deploy the dashboard.js, visualization.js and visualization.css files to weblogic
- From a dashboard text section, source in dashboard.js, which will in turn include visualization.js and visualization.css
- Add the <rm-treemap> tag to the Narrative field of a Narrative view.
As you can see implementing custom HTML tags to serve as the interface for a D3 visualization will save your dashboard designers from having to sift through dozens if not hundreds of lines of confusing code. This will reduce implementation errors, as the syntax is much simpler than JavaScript and will promote conformity, as all visualizations will be sourced from a common library. Hopefully, this post was informative and will inspire you to consider this pattern or a similarly purposed one to make your code easier to implement.