What's New in OBIEE 11.1.1.9 for Systems Administrators and Developers


After over two years since the last major release of OBIEE, Oracle released version 11.1.1.9 in May 2015. You can find the installers here and documentation here. 11.1.1.9 is termed the “terminal release” of the 11g line, and the 12c version is already out in closed-beta. We’d expect to see patchsets for 11g to continue for some time covering bugs and any security issues, but for new functionality in 11g I would hazard a guess that this is pretty much it as Oracle concentrate their development efforts on OBIEE 12c and BICS, particularly Visual Analyser.
For both the end user and backend administrator/developer, OBIEE 11.1.1.9 has brought with it some nice little touches, none of which are going to revolutionise the OBIEE world but many of which are going to make life with the tool just that little bit smoother. In this article we take a look at what 11.1.1.9 brings for the sysadmin & developer.
BI Server Query Instrumentation and Usage Tracking
There are some notable developments here:
- Millisecond precision when logging events from the BI Server
- Usage Tracking now includes the physical query hash, which is what is also visible in the database, enabling end-to-end tracing
- User sessions can be tracked and summarised more precisely because session ID is now included in Usage Tracking.
- The execution of initialisation blocks is now also recorded, in a new Usage Tracking table called S_NQ_INITBLOCK.
Millisecond precision in BI Server logs
OBIEE 11.1.1.9 writes the nqquery.log with millisecond precision for both the timestamp of each entry, and also the summary timings for a query execution (at last!). It also calls out explicitly “Total time in BI Server” which is a welcome addition from a time profiling/performance analysis point of view:
[2016-07-31T02:11:48.231-04:00 [...] Sending query to database named X0 - Airlines Demo Dbs (ORCL) (id: <<221516>>), connection pool named Aggr Connection, logical request hash 544131ec, physical request hash 5018e5db: [[
[2016-07-31T02:12:04.31-04:00 [...] Query Status: Successful Completion
[2016-07-31T02:12:04.31-04:00 [...] Rows 2, bytes 32 retrieved from database query id: <<221516>>
[2016-07-31T02:12:04.31-04:00 [...] Physical query response time 2.394 (seconds), id <<221516>>
[2016-07-31T02:12:04.31-04:00 [...] Physical Query Summary Stats: Number of physical queries 1, Cumulative time 2.394, DB-connect time 0.002 (seconds)
[2016-07-31T02:12:04.31-04:00 [...] Rows returned to Client 2
[2016-07-31T02:12:04.31-04:00 [...] Logical Query Summary Stats: Elapsed time 16.564, Total time in BI Server 16.555, Response time 16.564, Compilation time 0.768 (seconds), Logical hash 544131ec
One thing to notice here is the subsecond timestamp precision seems to vary between 2 and 3 digits, which may or may not be a bug.
Being able to see this additional level of precision is really important. Previously OBIEE recorded information by the second, which was fine if you were looking at query executions taking dozens of seconds or minutes - but hopefully our aspirations for systems performance are actually closer to the realms of seconds or subsecond. At this scale the level of precision in the timings really matters. On the assumption that OBIEE was rounding values to the nearest whole number, you’d see “0 seconds” for a Logical SQL compile (for example) that was maybe 0.499 seconds. Per query this is not so significant, but if those queries run frequently then cumulatively that time stacks up and would be useful to be properly aware of and target with optimisation if needed.
Usage Tracking changes
Usage Tracking has five new columns for each logical query recorded in S_NQ_ACCT:
- ECID
- TENANT_ID
- SERVICE_NAME
- SESSION_ID
- HASH_ID
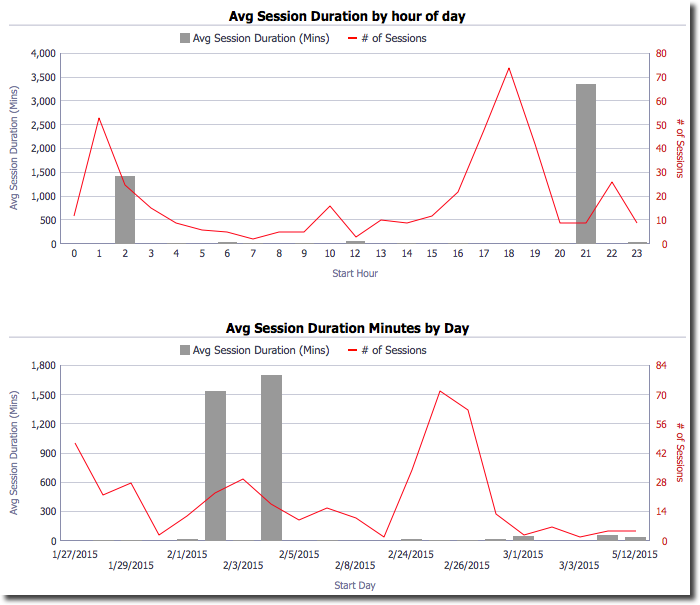
The presence of SESSION_ID is very useful, because it means that user behaviour can be more accurately analysed. For example, within a session, how many reports does a user run? What is the median duration of a session? Note that the session here is the session as seen by the BI Server, rather than Presentation Services.
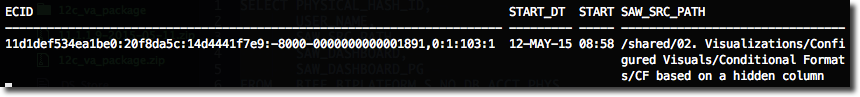
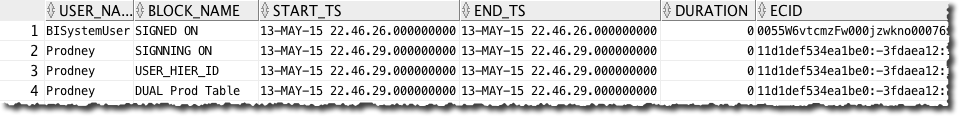
ECID is also very useful for being able to link data in Usage Tracking back to more detailed entries in nqquery.log. Note that an ECID is multipart and concatenated with RID and you won’t necessarily get a direct hit on the ECID you find in Usage Tracking with that in nqquery.log, but rather a substring of it. In this example here the root ECID is 11d1def534ea1be0:20f8da5c:14d4441f7e9:–8000–0000000000001891,0:1:103 and the varying component of the relationship (RID) id 1 and 3 respectively:
Usage Tracking:
select ecid,session_id,start_dt,start_hour_min ,saw_src_path from biee_biplatform.s_nq_acct
nqquery.log:
[2015-05-12T08:58:38.704-04:00] [...] [ecid: 11d1def534ea1be0:20f8da5c:14d4441f7e9:-8000-0000000000001891,0:1:103:3] [...]
-------------------- SQL Request, logical request hash:
3fabea2b
SET VARIABLE QUERY_SRC_CD='Report',SAW_DASHBOARD='/shared/02. Visualizations/_portal/2.11 Table Designs',SAW_DASHBOARD_PG='Conditional Format',SAW_SRC_PATH='/shared/02. Visualizations/Configured Visuals/Conditional Formats/CF based on a hidden column',PREFERRED_CURRENCY='USD';SELECT^M
   0 s_0,^M
[...]
In the above example note how the absence of a timezone in the Usage Tracking data is an impedance to accurate interpretation of the results, compared to nqquery.log which has a fully qualified timezone offset.
Usage Tracking changes - Physical Hash ID
As well as additions to the logical query table, there are two new columns for each physical query logged in S_NQ_DB_ACCT:
- HASH_ID
- PHYSICAL_HASH_ID
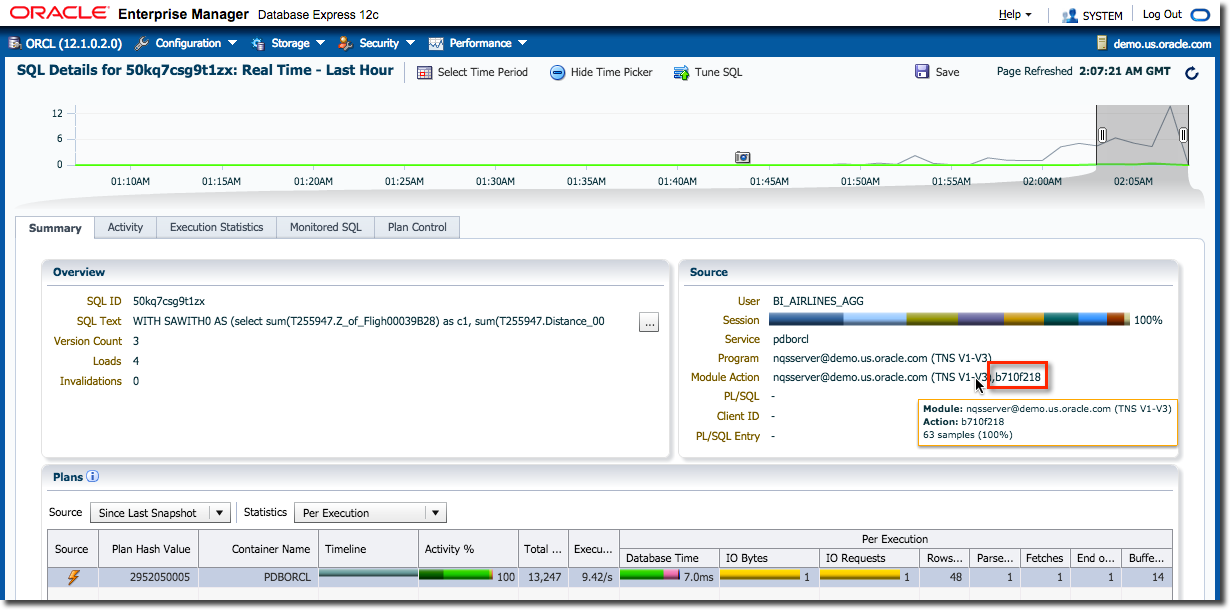
The implications of this are important – there is now native support in OBIEE for tracing OBIEE workloads directly down to the database (as discussed for OBIEE < 11.1.1.9 here), because the PHYSICAL_HASH_ID is what OBIEE sets as the ACTION field when it connects to the database and is available in Oracle through both AWR, V$ views, and DBMS_MONITOR. For example, in V$SESSION the ACTION field is set to the physical hash:
SQL> select username,program,action
  from v$session where lower(program) like 'nqs%';

USERNAME PROGRAM                                          ACTION
-------- ------------------------------------------------ ---------
BISAMPLE [email protected] (TNS V1-V3)         5065e891
BISAMPLE [email protected] (TNS V1-V3)         2b6148b2
BISAMPLE [email protected] (TNS V1-V3)
BISAMPLE [email protected] (TNS V1-V3)         8802f14e
BISAMPLE [email protected] (TNS V1-V3)         206c8d54
BISAMPLE [email protected] (TNS V1-V3)         c1c121a7
The ACTION is also available in many EM screens such as this one:
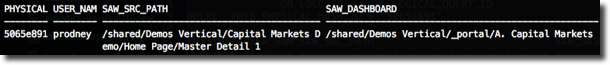
Now with OBIEE 11.1.1.9 the physical hash - which was previously only available in the nqquery.log file - is available in S_NQ_DB_ACCT which can in turn be joined to S_NQ_ACCT to find out the logical request related to the physical query seen on the database. Cool huh!
SELECT PHYSICAL_HASH_ID,
       USER_NAME,
       SAW_SRC_PATH,
       SAW_DASHBOARD,
       SAW_DASHBOARD_PG
FROM   BIEE_BIPLATFORM.S_NQ_DB_ACCT PHYS
       INNER JOIN BIEE_BIPLATFORM.S_NQ_ACCT LOGL
               ON LOGL.ID = PHYS.LOGICAL_QUERY_ID
WHERE  PHYS.PHYSICAL_HASH_ID = '5065e891'
This can be extended even further to associate AWR workload reports with specific OBIEE requests:

One little grumble (no pleasing some people…) - it would have been nice if Usage Tracking also stored:
- Timings at millisecond precision as well
- The number of bytes (rather than just row count)
- A proper TIMESTAMP WITH TIME ZONE (rather than the weird triplet of TS/DT/HOUR_MIN)
- “Total time in BI Server”
Who knows, maybe in 12c?…
Footnote - START_TS in Usage Tracking in 11.1.1.9
As a note for others who may hit this issue, my testing has shown that Usage Tracking in 11.1.1.9 appears to have introduced a bug with START_TS (on both S_NQ_ACCT and S_NQ_DB_ACCT), in that it stores only the date, not date + time as it did in previous versions. For example:
- 11.1.1.7:
SELECT TO_CHAR(START_TS, 'YYYY-MM-DD HH24:MI:SS') AS START_TS,
TO_CHAR(START_DT, 'YYYY-MM-DD HH24:MI:SS') AS START_DT,
START_HOUR_MIN
FROM S_NQ_ACCT
WHERE ROWNUM < 2START_TS START_DT START_HOUR_MIN
2015-03-19 15:32:23 2015-03-19 00:00:00 15:32
- 11.1.1.9:
SELECT TO_CHAR(START_TS, 'YYYY-MM-DD HH24:MI:SS') AS START_TS, TO_CHAR(START_DT, 'YYYY-MM-DD HH24:MI:SS') AS START_DT, START_HOUR_MIN FROM S_NQ_ACCT WHERE ROWNUM < 2START_TS START_DT START_HOUR_MIN
2015-01-27 00:00:00 2015-01-27 00:00:00 10:41
Initialisation Block information in Usage Tracking
A new table, S_NQ_INITBLOCK, has been added to BIPLATFORM and holds details of when an init block ran, for which user, and importantly, how long it took. From a performance analysis point of view this is really valuable data and it's good to seeing it being added to the diagnostic data captured to database with Usage Tracking.
From a glance at the data it looks like there's a bit of a bonus logging going on, with user sign in/sign out also recorded ("SIGNNING ON/SIGNED ON/SIGNED OFF").
Note that there is no MBean for Init Block Usage Tracking, so regardless of how you configure the rest of Usage Tracking, you need to go to NQSConfig.ini to enable this one.
Presentation Services Cursor Cache
Oracle have added some additional Administration functionality for viewing and managing sessions and the cursor cache in Presentation Services. These let you track and trace more precisely user sessions.
From the Administration Page in OBIEE the new options are:
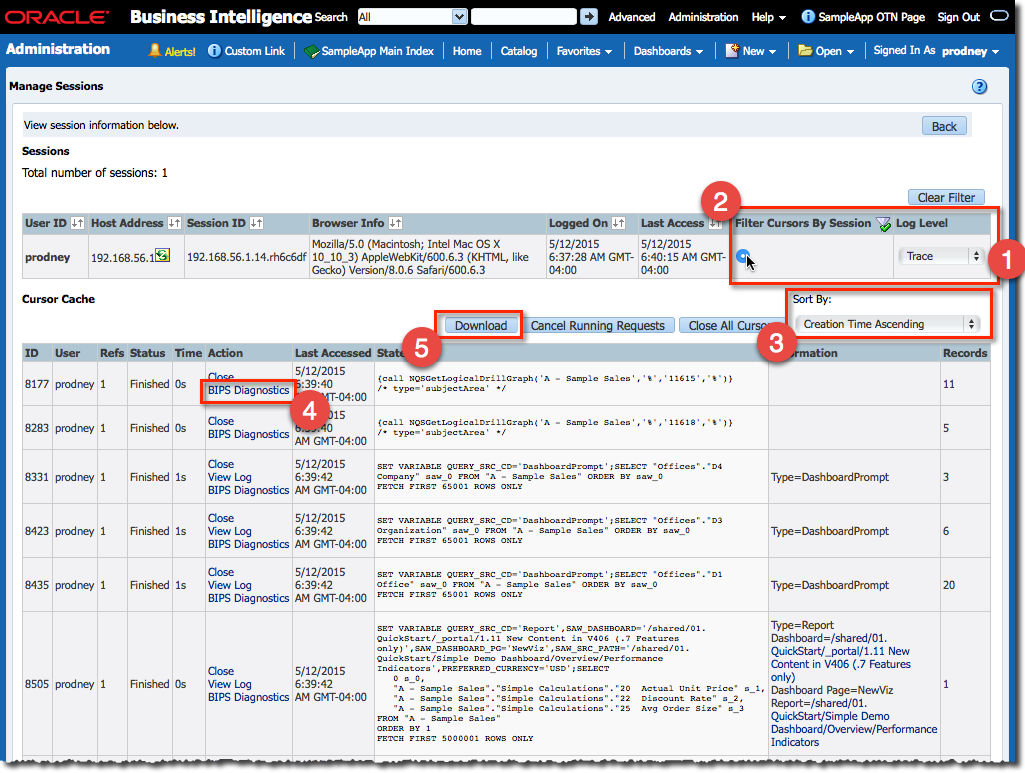
- Set dynamic log level per session from manage sessions
Filter cursor cache based on specific user sessions
Change sort order of cursor cache
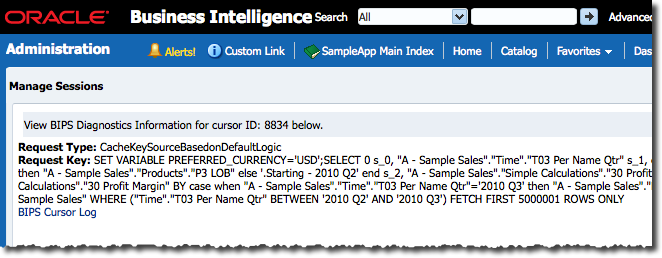
Show Presentation Services diagnostics per cursor
- Download cursor cache list as CSV
- I can see this being useful for integration into bespoke monitoring applications, to which I must profess an interest…
Some of these are somewhat low-level and will not be used day-to-day, but the general move towards a more open diagnostics interface with OBIEE is really positive and I hope we see more of it in 12c… :-)
Command Line Aggregate Advisor
Only for use by those with an Exalytics licence, the Summary Advisor was previously available in the Windows Administration Tool only but can now be run from the command line:
[oracle@demo setup]$ nqaggradvisor -h

Usage:
    nQAggrAdvisor -d <dataSource> -u <userName> -o <outputFile> -c <tupleInQuotes>
                  [-p <password>] [-F <factFilter>] [-z <maxSizeAggr>] [-g <gainThreshold>]
                  [-l <minQueryTime>] [-t <timeoutMinutes>] [-s <startDate>]
                  [-e <endDate>] [-C <on/off>] [-M <on/off>] [-K <on/off>]

Options:
    -d      : Data source name
    -u      : User name
    -o      : Output aggregate persistence script file name
    -c      : Aggregate persistence target - tuple in quotes: Fully qualified Connection pool, fully qualified schema name, capacity in MB
    -p      : Password
    -F      : Fact filter file name
    -z      : Max size of any single aggregate in MB
    -g      : Summary advisor will run until performance improvement for new aggregates drops below this value, default = 1
    -l      : The minimum amount of query time accumulated per LTS in seconds, before it is included for analysis, default = 0
    -t      : Max run time in minutes - 0 for unlimited, default = 0
    -s      : Statistics start date
    -e      : Statistics end date
    -C      : Prefer optimizer estimates - on/off, default = off
    -M      : Only include measures used in queries - on/off, default = off
    -K      : Use surrogate keys - on/off, default = on

Examples:
    nQAggrAdvisor -d "AnalyticsWeb" -u "Administrator" -p "ADMIN" -o "C:\temp\aggr_advisor.out.txt"
        -c "DW_Aggr"."Connection Pool","DW_Aggr".."AGGR",1000

    nQAggrAdvisor -d "AnalyticsWeb" -u "Administrator" -p "ADMIN" -o "C:\temp\aggr_advisor.out.txt" -F "C:\temp\fact_filter.txt" -g 10
        -c "TimesTen_instance1"."Connection Pool","dbo",2000 -s "2011-05-02 08:00:00" -e "2011-05-07 18:30:00"  -C on -M on -K off
Note that in the BIPLATFORM schema S_NQ_SUMMARY_STATISTICS is now called S_NQ_SUMMARY_ADVISOR.
HTML5 images
In previous versions of OBIEE graph images were rendered in Flash by default, and PNG on mobile devices. You could force it to use PNG for all images but would loose the interactivity (tooltips etc). Now in OBIEE 11.1.1.9 you can change the default from Flash to HTML5. This removes the need for a Flash plugin and is generally the way that a lot of visualisations are done on the web nowadays. To my eye there’s no difference in appearance:
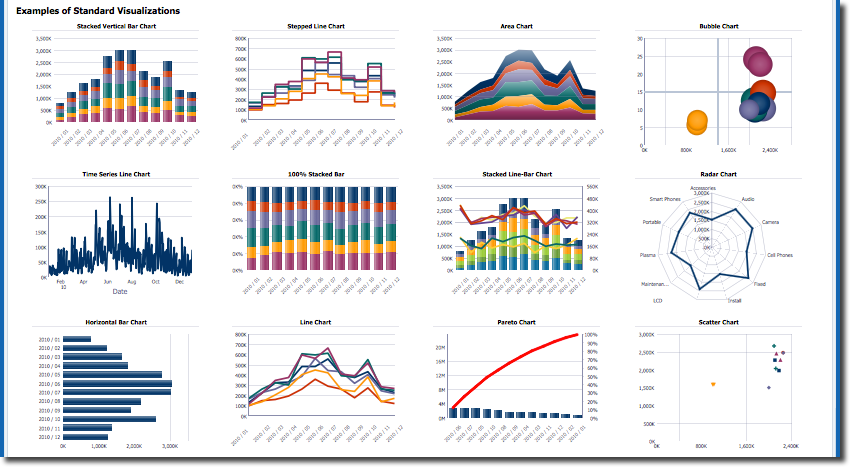
To use HTML5 graphs by default, edit instanceconfig.xml and under <Charts> section add:
<DefaultWebImageType>html5</DefaultWebImageType>
Note that html5 is case-sensitive. The config file should look something like this:
<?xml version="1.0" encoding="UTF-8" standalone="no"?>
<WebConfig xmlns="oracle.bi.presentation.services/config/v1.1">
   <ServerInstance>
   [...]
        <Views>
        [...]
            <Charts>
                <DefaultWebImageType>html5</DefaultWebImageType>
            [...]
            </Charts>
        [...]
        </Views>
    [...]
   </ServerInstance>
</WebConfig>
If Presentation Services doesn’t come back up when you restart it after making this change then check the stdout logfile console~coreapplication_obips1~1.log as well as the standard sawlog.log file, both of which you’ll find in $FMW_HOME/instances/instance1/diagnostics/logs/OracleBIPresentationServicesComponent/. The reason to check the console log file is that Presentation Services will refuse to start if the configuration supplied is invalid, and you’ll see an error message stating this here.
NQS ODBC functions
One for the Neos amongst you, a quick call of NQSGetSQLProcedures (as seen in SampleApp dashboard 7.90 NQS ODBC Procedures) and comparison with 11.1.1.7.150120 shows the following new & changed NQS ODBC calls. If this means nothing to you then it probably doesn’t need to, but if you’re interested in exploiting OBIEE functionality from all angles, documented or not, then these might be of interest. It goes without saying, these are entirely undocumented and unsupported, completely liable to change or be removed at any time by Oracle.
- Added
- NQSGetUserDefinedFunctions
- NQSPAFIntegration
- NQSSearchPresentationObjects
- NQS_GetAllCacheEntries
- NQS_GetOverallCacheInfo
- NQS_GetRepositories
- NQS_LoadNewBaseRP
- NQS_LoadNewRPVersion
- NQS_LockSessionAgainstAutoRPSwitchOver
- NQS_SetRPDReadOnlyMode
- NQS_SwitchOverThisSessionToNewRP
- SAPurgeCacheBySubjectArea
- SAPurgeCacheEntryByIDVector
- SAPurgeXSACache
- SASeedXSACache
- Modified
- NQSGetQueryLogExcerpt (additional parameter)
- SAPurgeInternalCache (additional enum)
- Removed
- NQSChangeSelfPassword
Web Services
Web Services are one of the best ways to integrate with OBIEE programatically. You don’t need to be building heavy java apps just to use them – you can create and send the necessary SOAP messages from python or even just send it from bash with curl.
There are 2.5 new WSDLs – two new ones (v9, v10) plus v8 which has changed. The new services are:
- KPIAssessmentService
- ScorecardAssessmentService
- ScorecardMetadataService
- UserPersonalizationService
You'll find documentation for the Web Services in the Integrator's Guide.
User Image Upload
Users can now upload their own images for use in Title views, conditional formats, etc. From an administration point of view this means you’ll want to be keeping an eye on /root/shared/custom/images/ in the Presentation Catalog, either on disk and/or through the OBIEE Catalog View, switch to Admin and enable “Show Hidden Items”:
QUERY_LIMIT_WARNING_INSTEAD_OF_ERROR
This new setting in NQSConfig.ini will warn users when they’re breaching defined query limits, but it won’t abort the query.
Pointless hacks
If you’re a geek like me, part of the fun of a new tool is simply poking around and seeing what’s new – not necessarily what’s useful. There’s plenty of great new stuff in 11.1.1.9, but let’s take a look at the “under the hood”, just Because Geek.
It was John Minkjan who first blogged several years about the xsd configuration schema files, and it is from this that we can find all the things that Presentation Services might be able to do – not just what it definitely can do, and not just what Oracle have documented that it can do. I wrote about some of these options a while back, and there are a few new ones in 11.1.1.9.
ALL OF THESE ARE COMPLETELY UNDOCUMENTED AND UNSUPPORTED. DO NOT USE THEM.
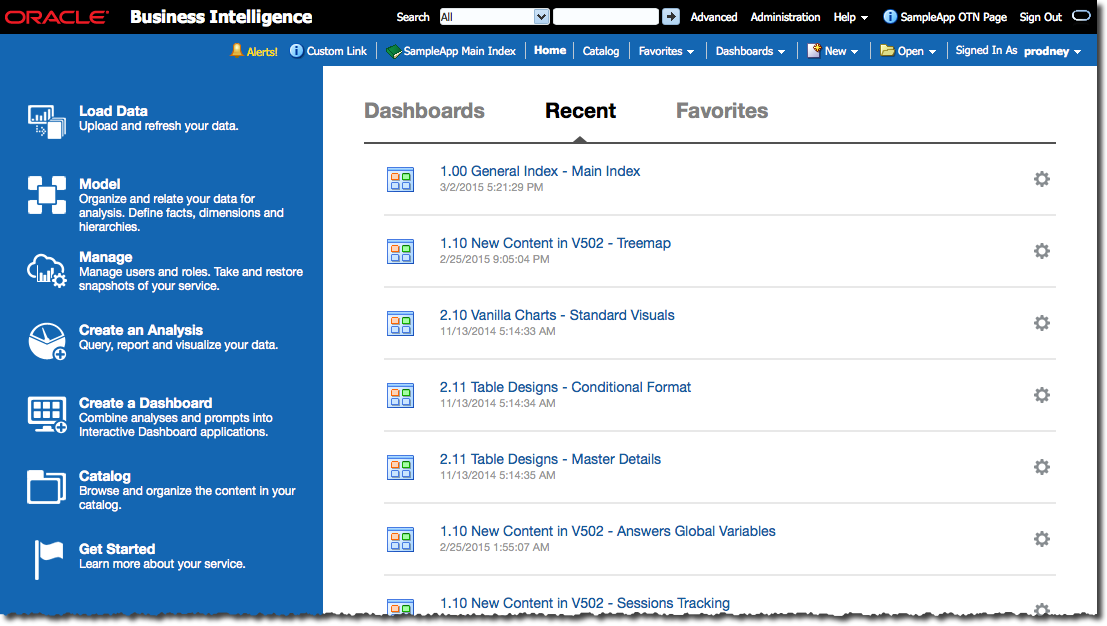
- EnableCloudBIEEHome sets the home page of OBIEE to be as it would be on BI Cloud Service (BICS). This is completely pointless since all the interesting stuff (Load Data, Model, Manage) is non-existent, even if it does give us a clue which application deployments are going to be supplying them (bimodeler and biserviceadministration respectively)
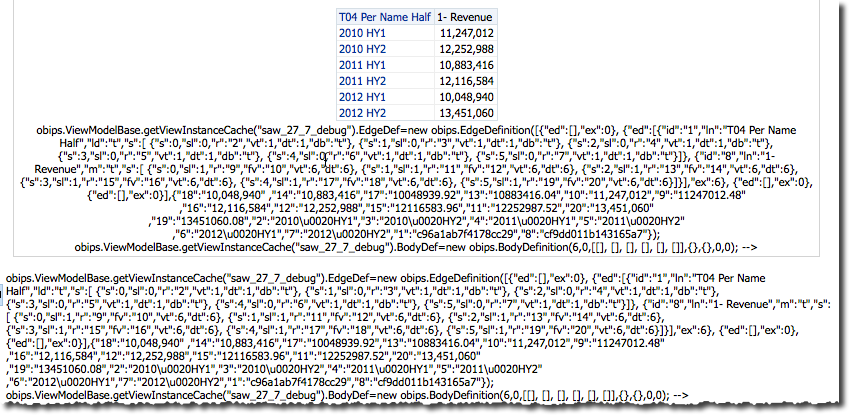
- GridViews/ShowDataModels outputs a bunch of debug data in Answers Table or Pivot Views:
- VirusScannerConfiguration - When a user uploads a custom image, this command will be called with it. For example, this simple script writes to a file the time and name of the file passed to it:
echo '---' >> /tmp/log.txt
date >> /tmp/log.txt
echo $1 >> /tmp/log.txt
If I save this as /tmp/test-script.sh and add it to instanceconfig.xml:
<VirusScannerConfiguration>
   <ScannerInvocationCommandLine>/tmp/test-script.sh</ScannerInvocationCommandLine>
</VirusScannerConfiguration>
When I upload an image I get a row written to my log file. That in itself isn’t useful, but it could be a handy hook maybe from an auditing point of view, or indeed, virus scanning:
[oracle@demo tmp]$ cat /tmp/log.txt
---
Wed May 20 16:01:47 EDT 2015
/app/oracle/biee/instances/instance1/tmp/OracleBIPresentationServicesComponent/coreapplication_obips1/defaultpool/sawserver_8673_5553759a_2-1.tmp