How Engaged Are Your OBIEE Users?

Following on from Jon's blog post “User Engagement: Why does it matter?”, I would like to take this one step further by talking about measurement. At Rittman Mead we believe that if you can't measure it, you can't improve it. So how do you measure user engagement?
Metrics
User engagement for OBIEE is like most web based products or services:
- both have users who access the product or service and then take actions.
- users of both use it repeatedly if they get value from those actions.
A lot of thought has gone into measuring the customer experience and engagement for web based products and services. Borrowing some of these concepts will help us understand how to measure user engagement for BI solutions.
We look at three metrics:
- Frequency of use
- Recency of use
- Reach of the system
Usage Tracking Data
OBIEE offers visibility of what its users are doing through its Usage Tracking feature, we can use this to drive our metrics.
Figure 1
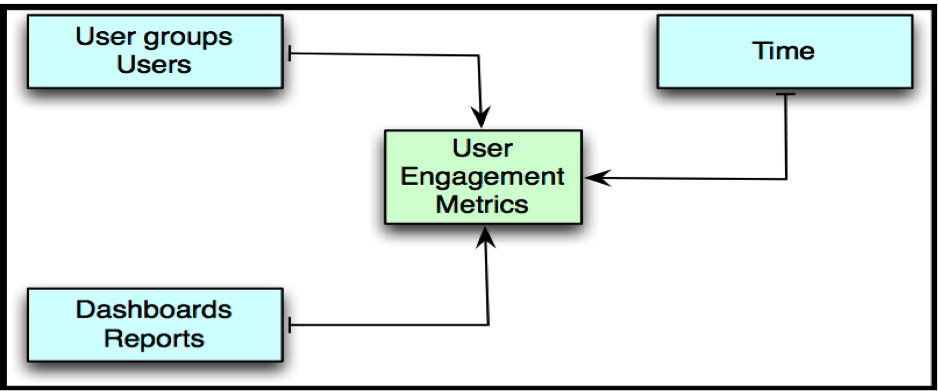
As we can see from Figure 1, the usage tracking data can support our three metrics.
Frequency of use
- Number of times a user or group of users visit in a specific period (Day / Month / Year)
- Number of times a dashboard / report is accessed in a specific period.
- How are these measures changing over time?
Recency of use
- How recently was a report / dashboard used by relevant user groups?
- What are the average days between use of each report / dashboard by relevant use group?
- Number of dashboards / reports used or not used in a specific period (Day / Month / Year)
- Number of users that have used or not used OBIEE in a specific period (Day / Month / Year)
- How are these changing over time?
Reach of the system
- Overall number of users that have used or not used OBIEE. This can be further broken down by user groups.
- How is it changing over time?
User engagement KPI perspective
We have compared BI solutions to web-based products and services earlier in this post. Let's look at some popular KPIs that many web-based products use to measure engagement and how they can be used to measure OBIEE engagement.
- Stickiness: Generally defined as the amount of time spent at a site over a given period.
- Daily Active Users (DAU): Number of unique users active in a day
- Monthly Active Users (MAU): Number if unique users active in a month.
DAU and MAU are also used as a ratio (DAU / MAU) to give an approximation of utility.
The R&D division of Rittman Mead has developed the Rittman Mead User Engagement Toolkit, a set of tools and reports to capture and visualise user engagement metrics. The example charts given below have been developed using the R programming language.
Figure 2 - DAU over time with a trailing 30-day average (Red line)
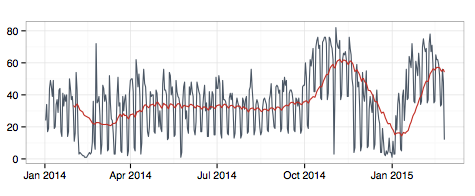
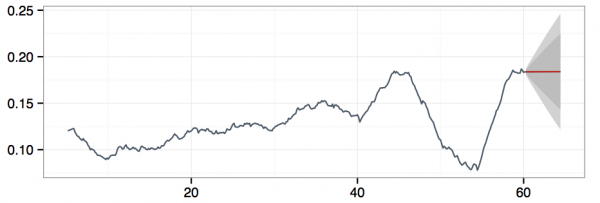
Figure 3 - Forecast DAU/MAU for 30 days after the data was generated
What Can You Do With These Insights?
Recall that Jon's blog post points out the folowing drivers of user engagement:
- User interface and user experience
- Quality, relevance, and confidence in data
- Performance
- Ability to use the system
- Accessibility – is the system available in the right way, at the right time?
There are several actions you can take to influence the drivers as a result of monitoring the aforementioned metrics.
- Identify users or groups that are not using the system as much as they used to. Understand their concerns and address the user engagement drivers that are causing this.
- Verify usage of any significant enhancement to the BI solution over time.
- Analyse one of the key drivers, performance, from usage data.
- Determine peak usage to project future hardware needs.
Conclusion
User engagement is the best way users can get value from their OBIEE systems. Measuring user engagement on an ongoing basis is important and can be monitored with the use of some standard metrics and KPIs.
Future blog posts in this series will address some of the key drivers behind user engagement in addition to providing an overview of the Rittman Mead User Engagement Toolkit.
If you are interested in hearing more about User Engagement please sign up to our mailing list below.