OBIEE 12c - Your Answers After Upgrading
Several blogs have already been written about new functionality in OBIEE 12c. Mark Rittman, for example, posted a good one here.
Now, I've personally had the chance to play with it for a few weeks, mostly in Answers and some with the RPD, and wanted to share my experience. With a sleek interface and many new functionalities, 12c brings some very useful features that users will appreciate. As with most new software releases, I expected to find issues that needed to be worked out. In general, I was pleasantly surprised with the UI, the speed, and the intuitiveness that came along with OBIEE 12c.
Here, I’ll share with you some of the new features within Answers:
Percent Calculation
If you’ve created lots of percent variance columns, it's probably second nature that you will create your formula and then multiply by 100. In 12c, you can create your percent calculation without multiplying it by 100, then set your % data formatting in the Column Properties. In the same spot where you specify how the data is displayed, you can check the x100 box, which in turn will automatically multiply your results from that column by 100. Pretty sleek solution to simplify your formulas.

Saved Columns
This feature is very well described here, so I will give a high level overview: 12c gives you a very easy way to save a complex formula into the catalog. If you’ve built a lot of logic in a column’s formula, and would like to reuse the logic in future reports, you will appreciate the opportunity of saving columns. I remember creating many financial calculations that had to be reused often, and until now there was no easy way to retrieve the column formulas. Trying to simplify my life, I ended up inventing “my own method” of saving complex calculations by saving different analyses that I named as “Master - Calculation” containing the columns that I reused often. I would start many reports based on these Master reports because they had my pre-built formulas; however, this was not a clean method for others to follow. OBIEE 12c gives you this clean and simple method for storing and reusing your most wanted columns. You do this by entering your formula in edit formula and choosing to “Save Column as” for future use.
Calculated Columns
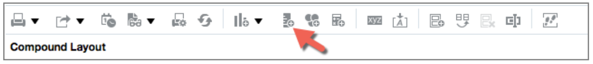
OBIEE 12c provides a more intuitive way to create calculated columns than previous versions. In 10g or 11g, you needed to add a “whatever” column to the query, and then go in Edit Formula to define the calculation for your new column. While this worked, most new users often wondered why they were “bringing in two revenue columns,” for example. In 12c, you can add only the needed columns to your Criteria, then go straight to Results. In the Results tab, there is a New Calculated Measure icon that brings you immediately to the Edit Formula screen where you can name your new measure and define its formula.
Measure Abbreviation
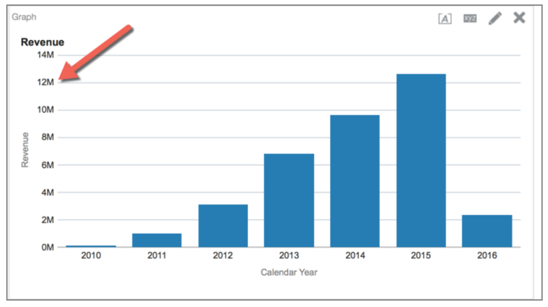
There is also a more intuitive abbreviation of the measures that are placed on a graph. In 11g, when you dragged an amount to an axis, you may recall that the numbers would show up exactly as the raw number. So, if your result was 12,000,000, then that was exactly what you would see on the graph to begin. If you wanted to improve your graph, then you needed to go to the Graph Properties and format the data from the axis to be abbreviated into, for our example above, millions (or 12M). To save you a step, 12c will automatically abbreviate your graph data in the most user-friendly way. So, if the data is 12,000,000, you automatically get 12M!
Heat Matrix
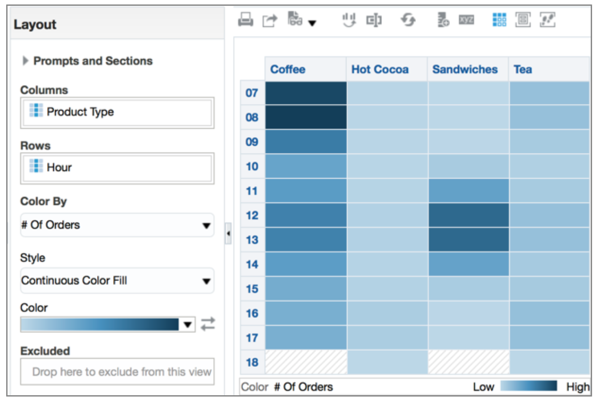
Easy to use heat matrix!—I mean it: easy. While in 11g, you would have to be somewhat visually savvy and spend a lot of time conditionally formatting. OBIEE 12c gives you a tool that allows you to create a meaningful heat matrix in a matter of minutes—wait—even seconds. All you need is to know the two dimensions and one measure that you would like to use, and drag and drop them. Choose from an array of color schemas and how you would like to use the colors. In no time, your heat matrix is ready.
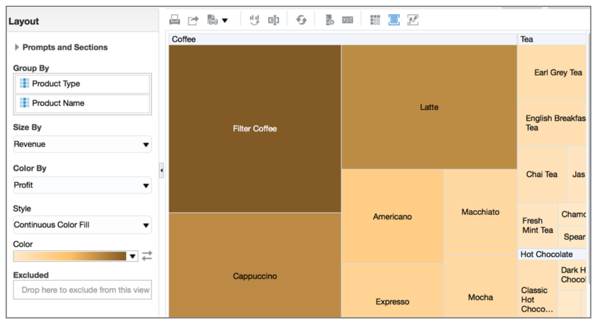
Treemaps
A new member of the OBIEE family is here to provide a visual solution for very complex activities. The Treemap provides a hierarchical structure that allows you to quickly spot patterns and outliers. At first, it may require a bit of head twisting to look at a graph like this, but remember, this is indeed a graph for complex activities. One of the most ideal usages for this new feature is the grouping by parent/children groups and the displaying of how two measures fair up inside each group.
Advanced Analytics
OBIEE 12c gives you the capability of working with statistical and R functions right from the 'Edit formula' pane. While I have found that this new feature was still not very user friendly, it's a lot easier than making this functionality work in 11g. For example, to create a simple Trendline with 11g, the developer had to slowly build each step of a calculation to find the slope of a line, and then find the Y intercept. With these answers in hand, the results had to be carefully placed on a graph, so that it could render meaningful results. If you require statistical graphs within OBIEE, 12c may be a great fit for you. For example, below is a graph showing four different Trendlines:

The Criteria for building these four lines would be very intense in 11g; but in OBIEE 12c, it contained only five columns: one for the Calendar Year, and one for each Trendline. The Trendlines were created one at a time, by inserting the new "Analytics" Function in the column's formula (see below).

Data Mashup
This is a dream come true to many of us, though it requires an optional data visualization license. With this new functionality, you are able to use OBIEE along with any excel spreadsheet (XSA) saved on your machine.
You can add a spreadsheet to OBIEE from two areas:
- When you are creating an analysis (in the Criteria tab, and then choosing to add data source as shown below), or
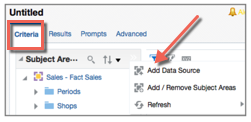
2. By going to the Visual Analyzer Home Page.
As this blog focuses on Answers, I will review the first option here.
There are three possible ways of analyzing a spreadsheet in Answers. You either want to:
- Analyze the spreadsheet by itself, or
- Use attributes from the spreadsheet along with fact data from your enterprise system, or
- Use fact data from your spreadsheet along with attributes and facts from your enterprise system.
For options 2 and 3 to work properly, it is important that your joins are properly matched (watch your cardinalities!) from your spreadsheet to your enterprise data. Also, as usual, option 3 will only work along with another fact table when the two tables are joined to a conformed dimension. Cardinalities and conformed dimensions are items that we generally take for granted when working on front-end OBIEE, because these points have been carefully handled during RPD modeling. Since the spreadsheet modeling has to be done in the front end, special caution must be used when modeling them in order to avoid "exploded" results, or simply inaccurate results.
Word of caution on placing an XSA sourced analysis in a shared folder:
Once you create an analysis using a spreadsheet and save it to a shared folder, you will receive this message:

Once you choose "YES," the spreadsheet will show as a new subject area—for you and for anyone who has access to the folder in which you placed the analysis, meaning that the catalog security just TOOK CONTROL of your spreadsheet! Below is a screenshot of how they show as new subject areas:
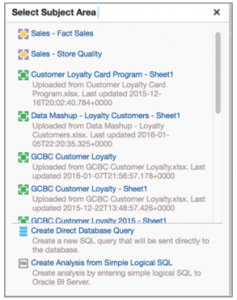
So, if your intent was to share an analysis from a XSA, but not necessarily share the entire spreadsheet to be reused, you may want to restrict your analysis to a folder with the specific securities that you would like to apply to your spreadsheet. BUT...think carefully before saving the analysis in a shared folder. If you realize that you made a mistake, just know that deleting your analysis from the incorrect folder will NOT remove your spreadsheet as an available subject area for other users. Remember, the catalog security took control of your spreadsheet, and it's not going to let it go! If you saved the analysis in a folder with incorrect permissions, you must delete the spreadsheet altogether from the tool, reload it, and then save the analysis in the correct folder (with the permissions that you want).
You will likely need in-depth information regarding mashup security once you are really working with it. Check out this Oracle doc for more info.
Word of caution when archiving an analysis containing a spreadsheet, or when moving that analysis between environments:
The username of the owner of the analysis gets embedded in the column formula, and so does the precise name that you gave your spreadsheet when you first loaded it. So, let's say that you are transitioning environments and the new environment does not contain your spreadsheets. If someone else has an archived catalog containing one of your mashup queries, they will get an error when retrieving results for your query, because the tool doesn't have your spreadsheet loaded yet. The only way for them to unarchive your analysis and retrieve results is for YOUR USER to log into OBIEE, load the original spreadsheet (saving it with the same exact name as before), and then saving the analysis in the proper shared folder once again.
Deleting the New Subject Area
One tricky thing in this new tool: even if you uploaded your spreadsheet (XSA) during an analysis in OBIEE, it can only be deleted from the “New Home Page,” which is the Home Page of Visual Analyzer. You can get to the “New Home Page” from the “Old Home Page”:

Once in the New Home Page, click on Data Sources. Choose your Data Source and delete it!

I confess that I had some trouble finding the delete button. Maybe I would have bumped into it had I played more with VA, but that was not the case. Regardless, I felt relieved that this button existed somewhere!
Data Mashup Performance
This was a bit of an issue, but mostly when combined with the Advanced Analytics functions. From my research and from talking to colleagues, I found that the following must be observed to optimize performance:
- Reduce the size of your spreadsheet, when possible.
- DB indexing on the field that you are joining.
- Proper cardinality on your mashup joins with your DB data.
- Set up caching for mashups on bi server.
Overall, the experience in OBIEE 12c Answers was very positive, and the new features could bring a great deal of time savings for any organization!
To learn more about all that OBIEE 12c has to offer, check out our upcoming bootcamps here.
Hope to see you then!