The Visual Plugin Pack for OBIEE

Last week we announced the Rittman Mead Open Source project, and released into open source:
- the excellent Insights project, a javascript API/framework for building a new frontend for OBIEE, written by Minesh Patel
- Enhanced usage tracking for OBIEE, to track click-by-click how your users interact with the application
Today it is the turn of the Visual Plugin Pack.....
What is the Visual Plugin Pack for OBIEE ?
Visual Plugin Pack (VPP) is a means by which users of OBIEE Answers can use custom JavaScript visualisations without having to write any javascript!
It is a framework that enables developers to build Javascript visualisation plugins, that report builders can then utilise and configure through native OBIEE user interface.
I want to point this out from the very start, that despite its name, the Visual Plugin Pack is not a pack of all-singing, all-dancing, super-duper visualisations for OBIEE.
Instead, VPP should be thought of as a framework that allows you to quickly develop and integrate all-singing, all-dancing, super-duper visualisations that will work natively within OBIEE.
Subtle difference, but an important one.
So what does it do ?
Essentially, VPP allows you to accelerate the development and deployment of custom, configurable and reusable OBIEE JavaScript visualisations.
Back in 2013 I wrote this post describing how to embed a D3 Visualisation within OBIEE. The same method will still work today, but it's a cumbersome process and requires heavy use of the narrative form, which let's be honest, is a painful experience when it comes to JavaScript development.
Some drawbacks with this method:
- Code editing in the Narrative view is not productive.
- Reusing visualisations in other analyses requires the copying and pasting of code.
- Basic Visualisation configuration changes, for example, width, height, colours, font etc requires code changes.
- Remapping Column bindings requires code changes.
- JavaScript library dependencies and load order can be tricky to manage.
The Visual Plugin Pack attempts to address these issues by abstracting away the complexities of the Narrative form and allowing developers to focus on visualisation code, not OBIEE integration code.
If you choose to use VPP for your visualisations then you will never have to touch the narrative form, all visualisation development can take place outside of OBIEE in your favourite code editor and deployed to Weblogic when you are done.
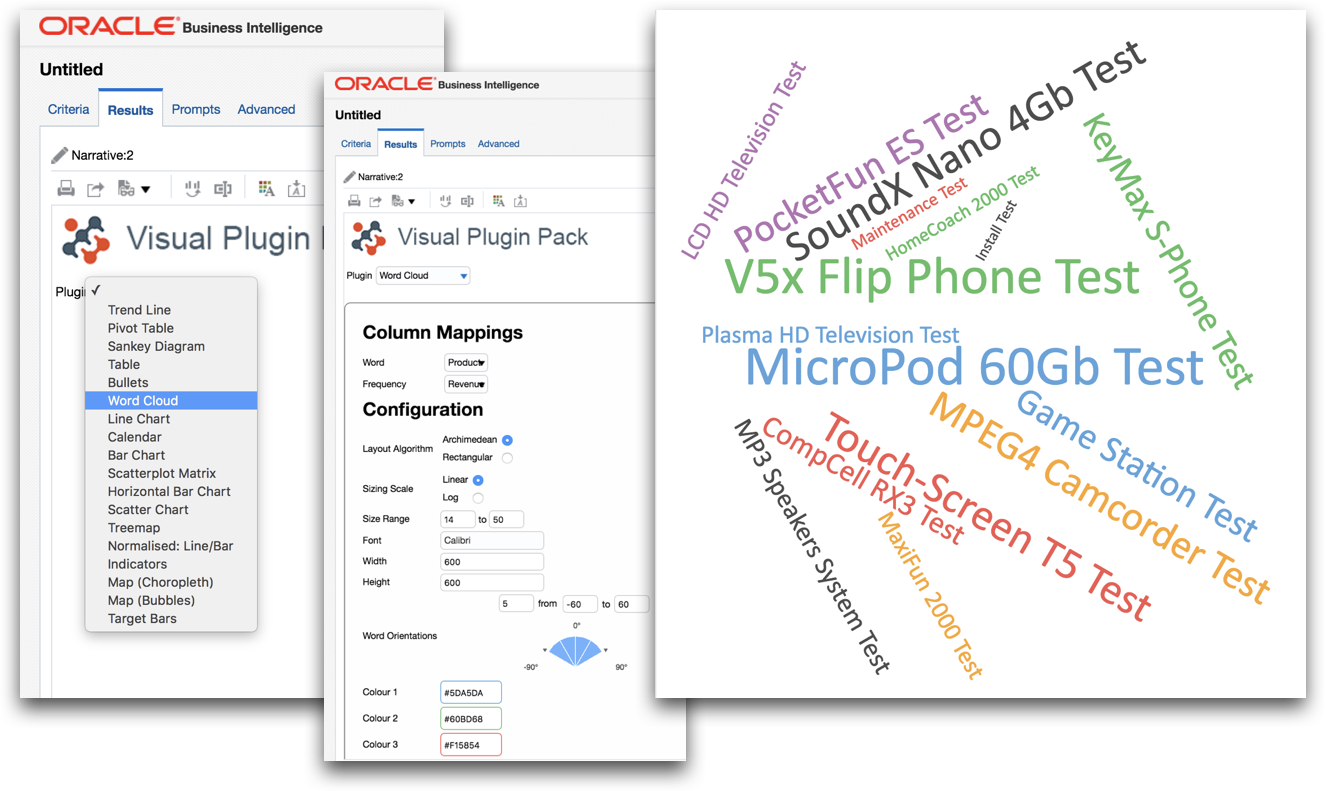
VPP also allows you to define design-time controls that affect column bindings and visualisation behaviour. The example visualisation below has been written to accept 5 column bindings and 1 configuration component, which controls the visualisation size. You can create as many column bindings and configuration components as you need
How do I get started ?
You can download or fork the repository from here.
Installation and developer guides can be found on the wiki:-
There are several visualisations that come bundled with VPP, some more polished than others, but they should serve as good examples that can be enhanced further.
Problems?
If you hit a problem please raise an issue on github. This is open source, so bear in mind that it's no-one's "job" to maintain the code - it's open to the community to use, benefit from, and maintain.
Summary
If you've got some in-house JavaScript skills and are looking to develop and integrate custom visualisations into OBIEE, then VPP can help alleviate a lot of the frustrations associated with the traditional method. Once you're up and running you'll be able to develop faster, integrate quickly and share your visualisations with all OBIEE report writers.
If you'd like to discuss how Rittman Mead can help with deployment or assist with custom visualisation development feel free to contact us.