Financial Reports - which tool to use? Part 2
Financials in BI Publisher##
I find it interesting that BI Publisher is mostly known for the creation of pixel perfect repeating forms (invoices, labels, checks, etc) and its ability to bursting them. To me, BI Publisher is the best kept secret for the most challenging reports known to mankind.
In my last blog - GHOST_URL/2017/02/financial-reports-which-tool-to-use-part-1/, I discussed some of the challenges of getting precisely formatted financial reports in OBIEE, as well as some pros and cons of using Essbase/HFR. Although we can work through difficult solutions and sometimes get the job done, BI Publisher is the tool that easily allows you to handle the strangest requirements out there!
If you have OBIEE, then you already have BI Publisher, so there is no need to purchase another tool. BI Publisher comes integrated with OBIEE, and they can both be used from the same interface. The transition between BI Publisher and OBIEE is often seamless to the user, so you don’t need to have concerns over training report consumers in another tool, or even transitioning to another url.
The BIP version that comes embedded with OBIEE 12c comes loaded with many more useful features like encryption and delivering documents to Oracle Document Cloud Service. Check out the detailed new features here:
http://www.oracle.com/technetwork/middleware/bi-publisher/new-features-guide-for-12-2-1-1-3074557.pdf
In BI Publisher, you can leverage data from flat files, from different databases, from an Essbase cube, from the OBIEE RPD, from one (or multiple) OBIEE analyses, from web services and more:
So, if you already have very complex OBIEE analyses that you could not format properly, you can use these analyses, and all the logic in them, as sources for your perfectly formatted BI Publisher reports.
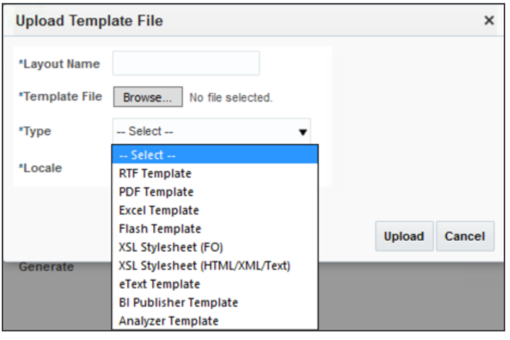
Every BI Publisher report consists of three main components:
-
Data Model - data source that you will use across one or more reports
-
Layout(s) - which will define how your data is presented
-
Properties - which are related to how it generates, displays and more
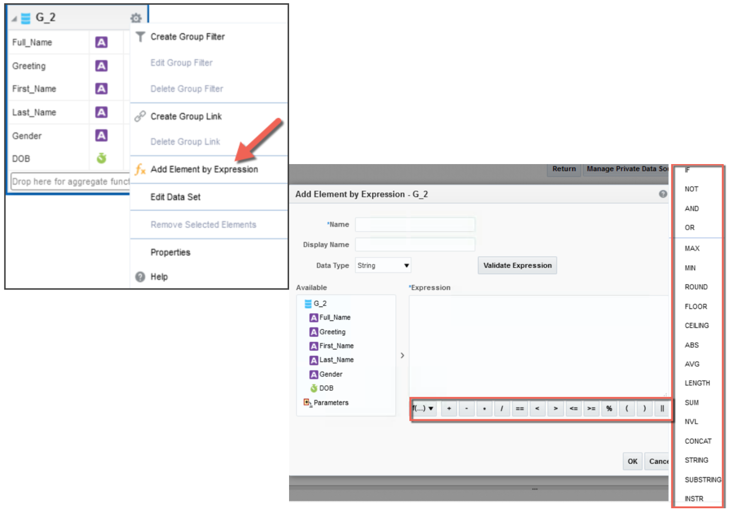
You start a BI Publisher project by creating a data model that contains the different data sets that you would like to use on your report (or across multiple reports). These data sets, which reside inside of your data model, can be of the same source or can come from multiple sources and formats. If you regularly use OBIEE, you can think of a data model as the metadata for one or more reports. It is like a very small, but extremely flexible and powerful RPD.
Inside the data model you can connect your data sets using bind variables (which creates a hierarchical relationship between data sets), or you can leave them completely disconnected. You can also connect some of your data sets while leaving others disconnected.
The most impressive component of this tool is that it will allow you to do math from the results of disconnected data sets, without requiring ETL behind the scenes. This may be one of the requirements of a very complex financial report, and one that is very difficult to accomplish with most tools. The data model can extract and transform data within a data set, or extract only, so that it can later be transformed during your report template design!
For example, within a data set, you can create new columns to suit most requirements - they can be filtered, concatenated, or have mathematical functions applied to them, if they come from the same data source.
If they do not come from the same source, you can transform your data using middle tier systems, such as Microsoft Word during your template creation. You can perform math and other functions to any result that comes from any of your data sets using an RTF template, for example.
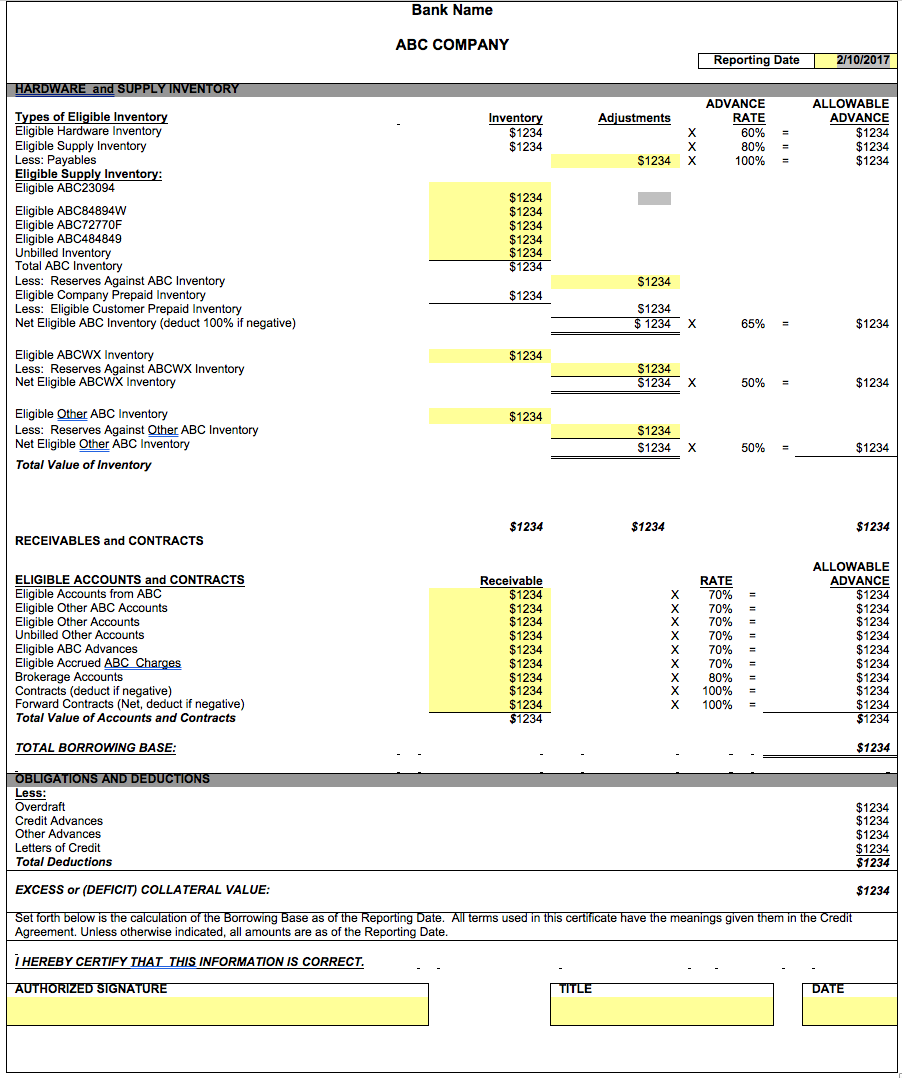
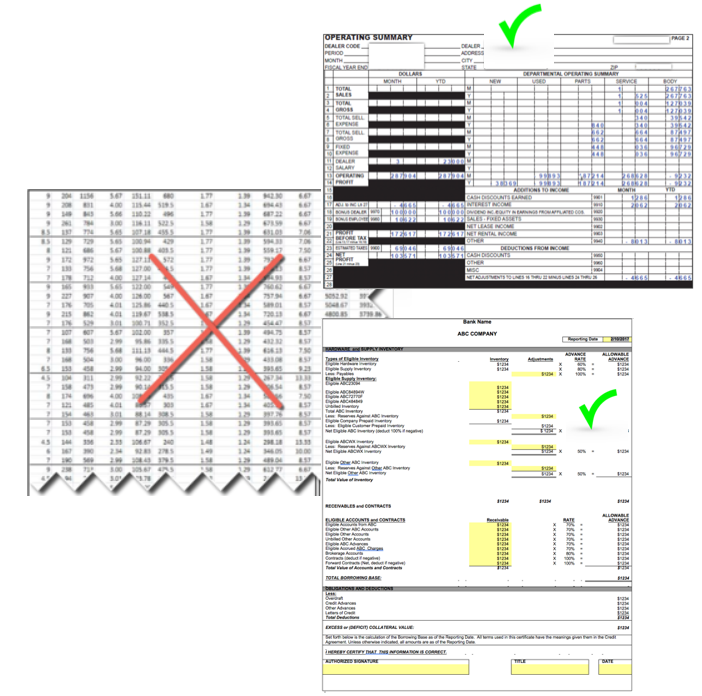
The example above was mentioned in Part 1 of this blog. It was created using BI Publisher and represents what I would call a "challenging report" to get done in OBIEE. The data model in this example consisted of several OBIEE analyses and their results were added/subtracted/multiplied as needed in each cell.
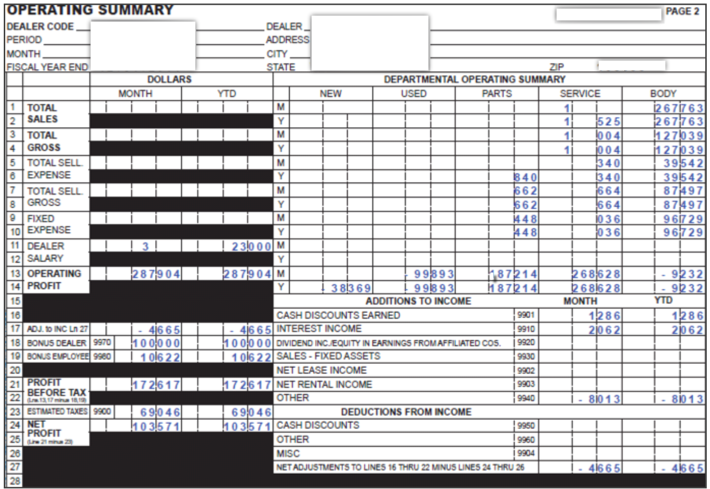
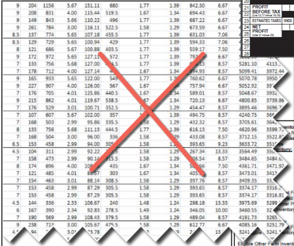
This second example was another easy transition into BI Publisher: the entire report contained 10 pages that were formatted entirely differently, one from the other. Totals from all pages needed to be added in some specific cells. Better yet, the user entered some measures at the prompt, and these measures needed to be accounted for in every sub-total and grand total. You may be asking: why prompt for a measure? Very good question indeed. In this case, there were very few measures coming from a disconnected system. They changed daily, and the preferred way for my client to deal with them was to enter them at the prompt.
So, do you always have to add apples to apples? Not necessarily! Adding apples and bananas may be meaningful to you.

And you can add what is meaningful with BI Publisher!
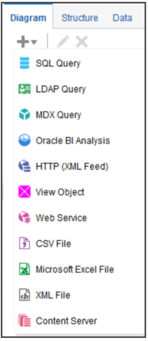
For example, here is a sample data model using sources from Excel, OBIEE and a database. As you see, two of these data sets have been joined, while the other two are disconnected:
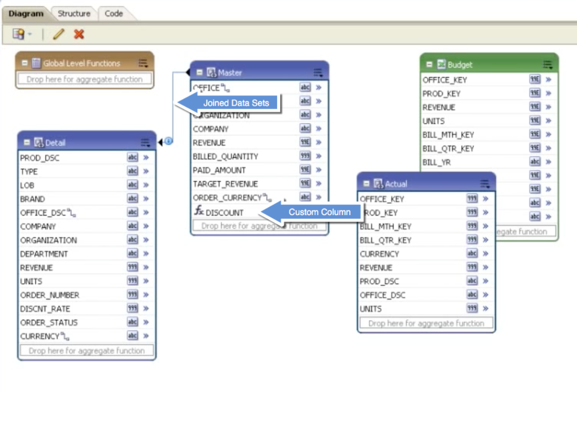
A data model such as this one would allow you to issue simultaneous queries across these heterogeneous sources and combine their results in the report template. Meaning, you can add anything that you would like in a single cell. Even if it involves that measure coming from the prompt! Goes without saying, you should have the exact purpose and logic behind this machination.
Once your data model is complete: your data sets are in place, you have created the relationships within them (where applicable), you created custom columns, created your parameters and filters, then you generate some sample data (XML) and choose how you will create your actual report.
As I mentioned, there are additional functionalities that may be added when creating the report, depending on the format that you choose for your template:
One very simple option is to choose the online editor, which has a bit more limited formatting capability, but will allow you to interact with your results online.
In my experience, if I had to cross the bridge away from OBIEE and into BI Publisher, it is because I needed to do a lot of customization within my templates. For those customizations, I found that working with RTF templates gave me all the additional power that I could possibly be missing everywhere else. Even when my financial report had to be read by a machine, BI Publisher/RTF was able to handle it.
The power of the BI Publisher data model combined with the unlimited flexibility of the RTF templates was finally the answer to eliminate the worst excel monsters. With these two, you can recreate the most complex reports, and do it just ONCE - not every month. You can use your existing format - that you either love, or are forced to use for some reason - and reuse it within the RTF. Inside of each RTF cell, you define (once!) what that cell is supposed to be. That specific cell, and all others, will be tested and validated to produce accurate results every month.
Once this work is done, you are done forever. Or well, at least until the requirements change… So, if you are battling with any one of these monsters on a monthly basis, I highly encourage you to take a step forward and give BI Publisher a try. Once you are done with the development of your new report, you may find that you have hours per month back in your hands. Over time, many more hours than what you spent to create the report. Time worth spending.