Getting Smarter in Renting with Tableau 10

Preface
Not a long time ago a friend of mine spent a significant amount of time trying to find a flat to rent. And according to what he said it wasn't an easy task. It took him a decent time and efforts to find something that is big enough (but not too big) not too far from a workplace, had required features and affordable at the same time. And as a specialist in data analysis, I prefer to think about this task as a data discovery one (yes, when you have a hammer everything looks like a nail). And I decided to see if a data analysis tool can help me understand the rental market better. I'm sure you've already read the name of this post so I can't pretend I'm keeping intrigue. This tool is Tableau 10.3.
The Data
The friend I was talking before was looking for a flat in Moscow, but I think that this market is completely unknown to the most of the readers. And also I'd have to spend a half of time translating everything into English so for this exercise I took Brighton and Hove data from http://rightmove.co.uk and got a nice JSON Lines file. JSON Lines files are basically the same JSON as we all know but every file has multiple JSONs delimited by a newline.
{json line #1}
{json line #2}
...
{json line #n}
That could be a real problem but luckily Tableau introduced JSON support in Tableau 10.1 and that means I don't have to transform my data to a set of flat tables. Thanks to Tableau developers we may simply open JSON Lines files without any transformations.
Typical property description looks like this:
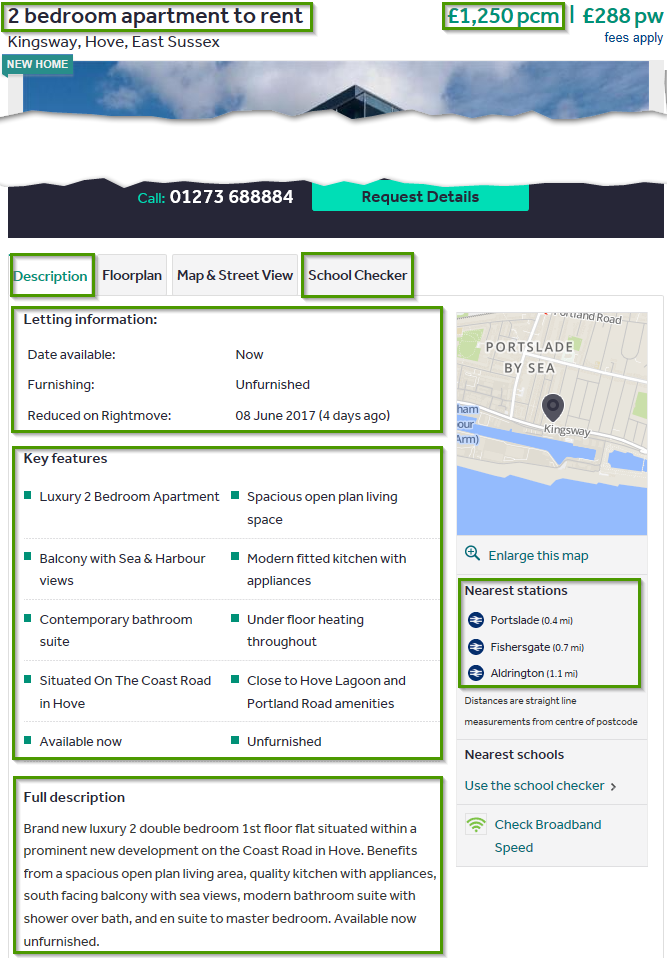
It has a few major blocks:
- Property name - 2 bedroom apartment to rent
- Monthly price - £1,250
- Description tab:
- Letting information - this part is more or less standard and has only a small number of possible values. This part has
Property name:Property valuestructure ('Date available':'Now'). - Key features - this part is an unformalized set of features. Every property may have its own unique features. And it is not a key-value list like Letting information, but a simple list of features.
- Full description - simply a block of unstructured text.
- Nearest stations - shows three nearest train stations (there could be underground stations too if they had it in Brighton).
- School checker - this shows 10 closest primary and 10 secondary schools. For this, I found a kind of API which brought me a detailed description of every school.
And finally, the JSON for one property has the following look. In reality, it is one line but just to make it more easy to read I formatted it to a human readable format. And also I deleted most of the schools' info as it is not as important as it is huge.
Property JSON
``` { "furnish":"Unfurnished", "key_features":[ "LARGE BRIGHT SPACIOUS LOUNGE WITH PATIO DOORS", "FULLY FITTED KITCHEN", "TWO DOUBLE BEDROOMS WITH WARDROBES", "A FURTHER SINGLE BEDROOM/OFFICE/STUDY", "A GOOD SIZED SHOWER ROOM ", "SINGLE GARAGE AND ON STREET PARKING", "EASY ACCESS TO THE CITY CENTRE OF CHICHESTER AND COMMUTER ROUTES. ", "TO ARRANGE A VIEWING PLEASE CONTACT US ON 01243 839149" ], "property_price_week":"£254 pw", "nearest_stations":[ { "station_name":"Fishbourne", "station_dist":"(0.4 mi)" }, { "station_name":"Chichester", "station_dist":"(1.2 mi)" }, { "station_name":"Bosham", "station_dist":"(1.7 mi)" } ], "letting_type":"Long term", "secondary_schools":{ "schools":[ { "distance":"0.6 miles", "ukCountryCode":"ENG", "name":"Bishop Luffa School, Chichester", ... }] } "url":"http://www.rightmove.co.uk/property-to-rent/property-66941567.html", "date_available":"Now", "date_reduced":"", "agent":"On The Move, South", "full_description":"We are delighted to bring to market, this fabulous semi detached bungalow ...
", "primary_schools":{ "schools":[ { "distance":"0.3 miles", "ukCountryCode":"ENG", "name":"Fishbourne CofE Primary School", }] } }, "property_address":[ "Mill Close, Chichester, West Sussex, PO19"], "property_name":"3 bedroom bungalow to rent", "date_added":"08 June 2017 (18 hours ago)", "property_price_month":"£1,100 pcm", "let_agreed":null, "unknownown_values":"", "deposit":"£1384" } ```The full version is here: 6391 lines, I warned you. My dataset is relatively small and has 1114 of such records 117 MB in total.
Just a few things I'd like to highlight. Letting information has only a small number of fixed unique options. I managed to parse them to fields like furnish, letting_type, etc. Key Features list became just an array. We have thousands of various features here and I can't put them to separate fields. Nearest stations list became an array of name and value pairs. My first version of the scrapper put them to a key-value list. Like this:
"nearest_stations":[
      "Fishbourne": "(0.4 mi)",
      "Chichester": "(1.2 mi)",
      "Bosham": "(1.7 mi)"
      ]
but this didn't work as intended. I got around one hundred of measures with names Fishbourne, Chichester, Bosham, etc. Not what I need. But that could work well if I had only a small number of important POIs (airports for example) and wanted to know distances to this points. So I changed it to this and it worked well:
"nearest_stations":[
      {
         "station_name":"Fishbourne",
         "station_dist":"(0.4 mi)"
      },
      {
         "station_name":"Chichester",
         "station_dist":"(1.2 mi)"
      },
      {
         "station_name":"Bosham",
         "station_dist":"(1.7 mi)"
      }
   ]
Connect to the Data
When I started this study my knowledge of the UK property rent market was close to this:

And it's possible or even likely that some of my conclusions may be obvious for anyone who is deep in the topic. In this blog, I show how a complete newbie (me) can use Tableau and become less ignorant.
So my very first task was to understand what kind of objects are available for rent, what are their prices and so on. That is the typical task for any new subject area.
As I said before Tableau 10 can work with JSON files natively but the question was if it could work with such a complex JSON as I had. I started a new project and opened my JSON file.
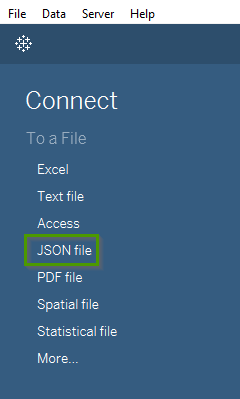
I expected that I will have to somehow simplify it. But in reality after a few seconds of waiting Tableau displayed a full structure of my JSON and all I had to do was selecting branches I need.
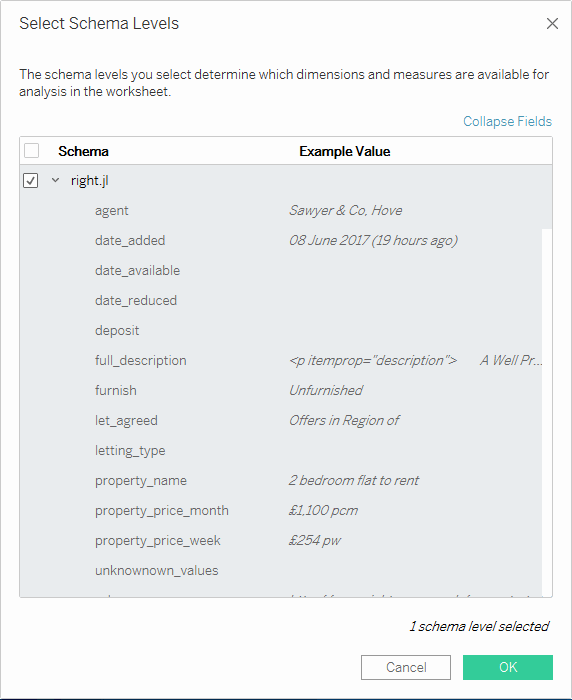
After a few more seconds I got a normal Tableau data source.
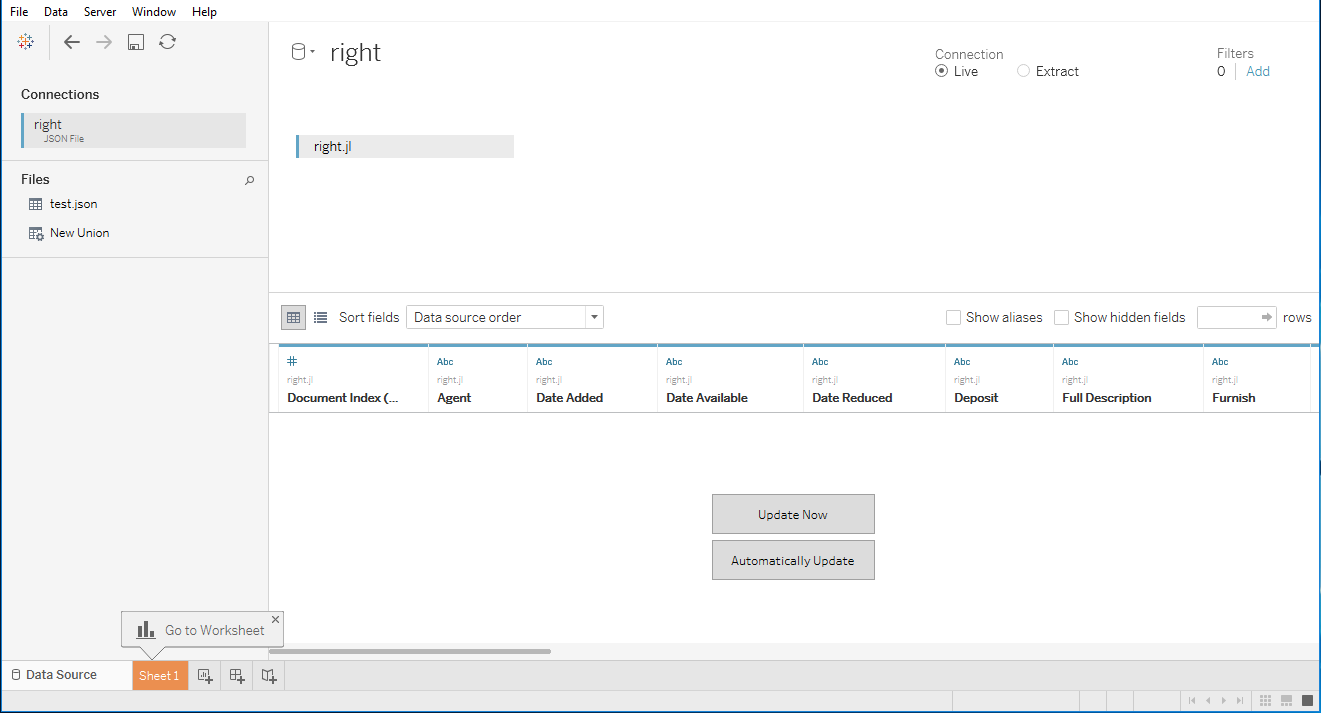
And this is how it looked like in analysis mode
First Look at the Data
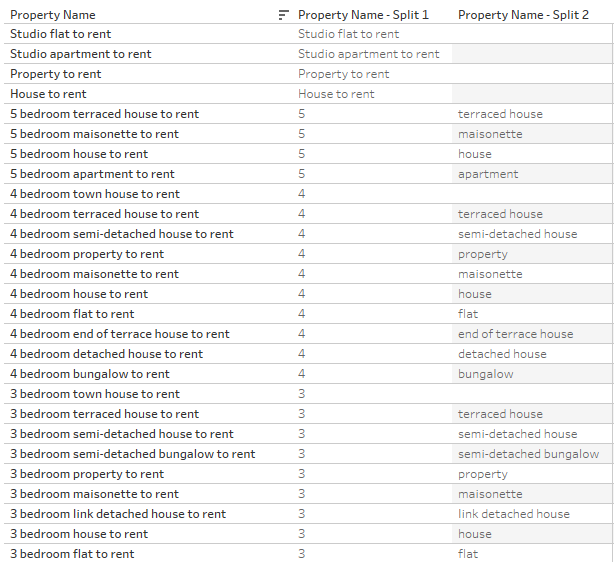
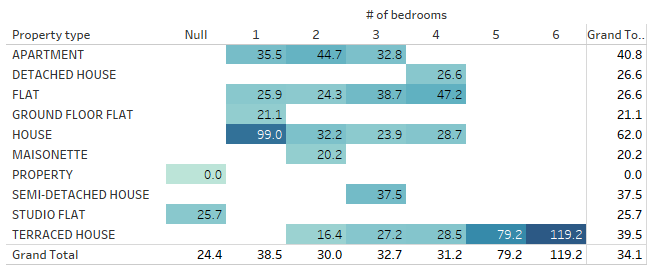
OK, let's get started. The first question is obvious: "What types of property are available for rent?". Well, it seems that name ('2 bedroom apartment to rent') is what I need. I created a table report for this field.
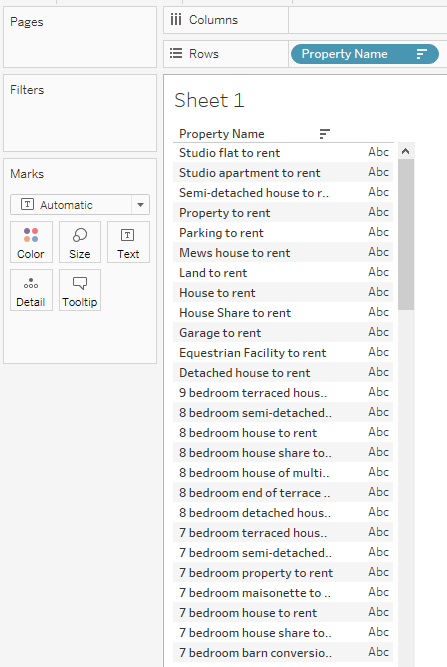
Well, it gives me the first impression of what objects are offered and what my next step should be. First of all the names are ending with "to rent". This just makes strings longer without adding any value. The word "bedroom" also doesn't look important. Ideally, I'd like to parse these strings into fields one of which is # of bedrooms and the second one is Property type. The most obvious action is to try Split function.
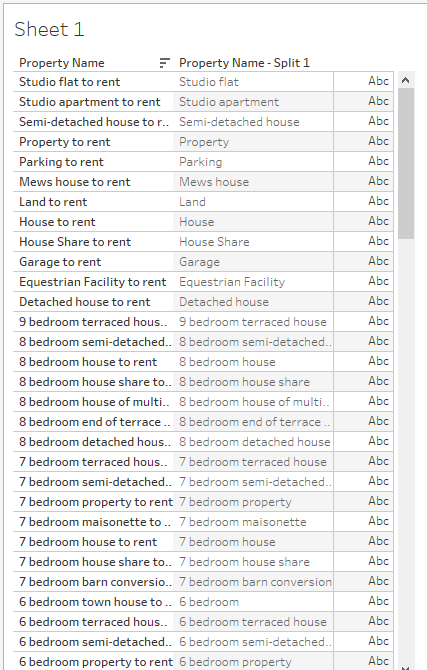
Well, it partially worked. This function is smart enough and removed 'to rent' part. But except for this, it gave me nothing. On other datasets (other cities) it gave me much better results but it still wasn't able to read my mind and did what I wanted:
But I spent 15 seconds for this and lost nothing and if it worked I'd saved a lot of time. Anyway, I'm too old to believe in magic and this almost didn't hurt my feelings.
Some people, when confronted with a problem, think “I know, I'll use regular expressions.” Now they have two problems.
Yes, this string literally asks some regular expressions wizardry.
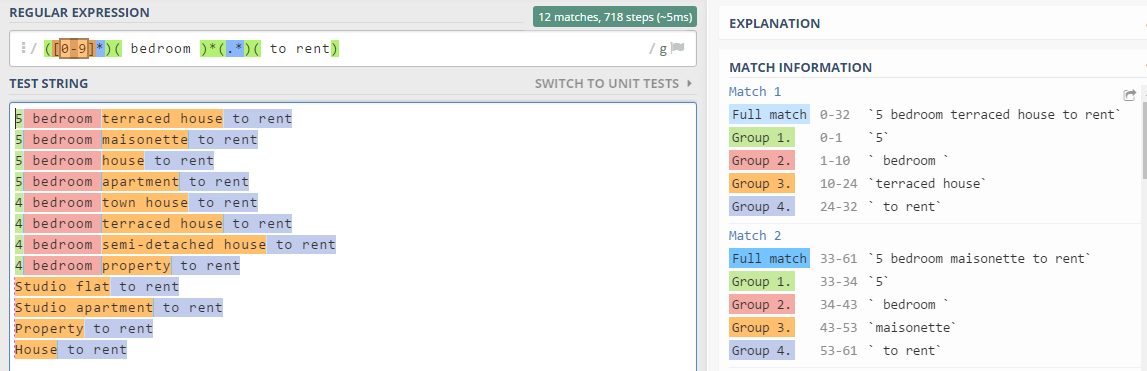
I can easily use REGEXP_EXTRACT_NTH and get what I want. Group 1 is the number of bedrooms and Group 3 is the property type. Groups 2 and 4 are just constant words.
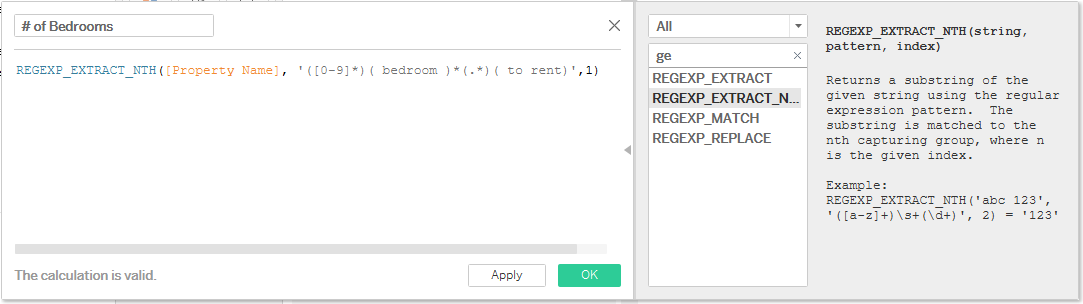
Explanation for my regular expression
I can describe most of the names in the following way: "`digit` **bedroom** `property type` **to rent**" and the rest are "`property type` **to rent**. So `digit` and **bedroom** are optional and `property type` **to rent** are mandatory. The expression is easy and obvious: `([0-9]*)( bedroom )*(.*)( to rent)`Regular expressions are one of my favourite hammers and helped me a lot for this analysis. And after all manipulations, I got a much better view of the data (I skipped some obvious steps like create a crosstab or a count distinct measure to save space for anything more interesting).
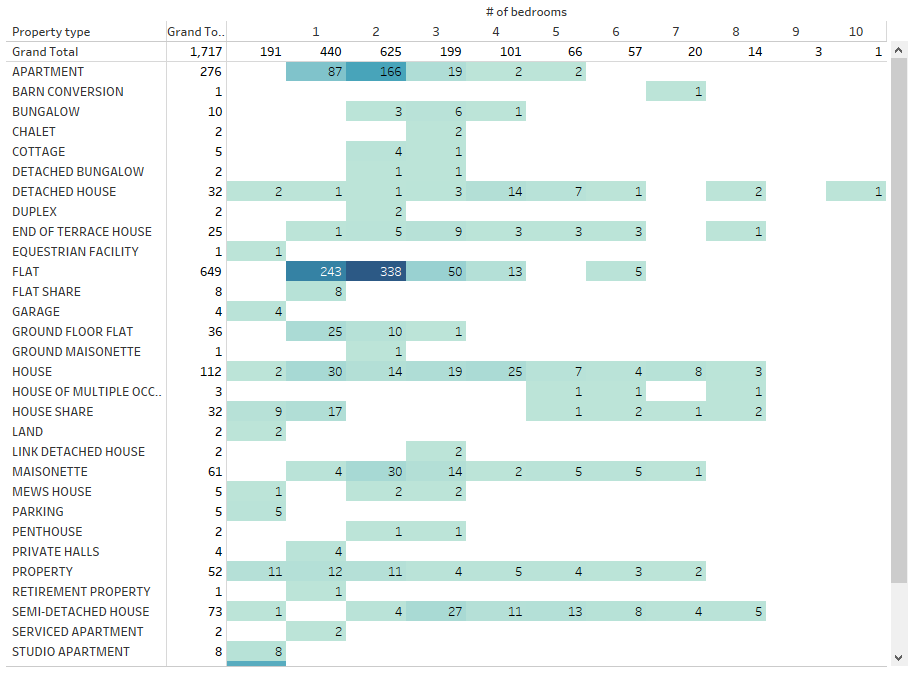
And while this result looks pretty simple it gives me the first insight I can't get simply browsing the site. The most offered are 1 and 2 bedroom properties especially flats and apartments. And if a family needs a bigger something with 4 or 5 bedrooms, well I wish them good luck, not many offers to chose from. Also if we talk about living property only we should filter out things like GARAGE, PARKING or LAND.
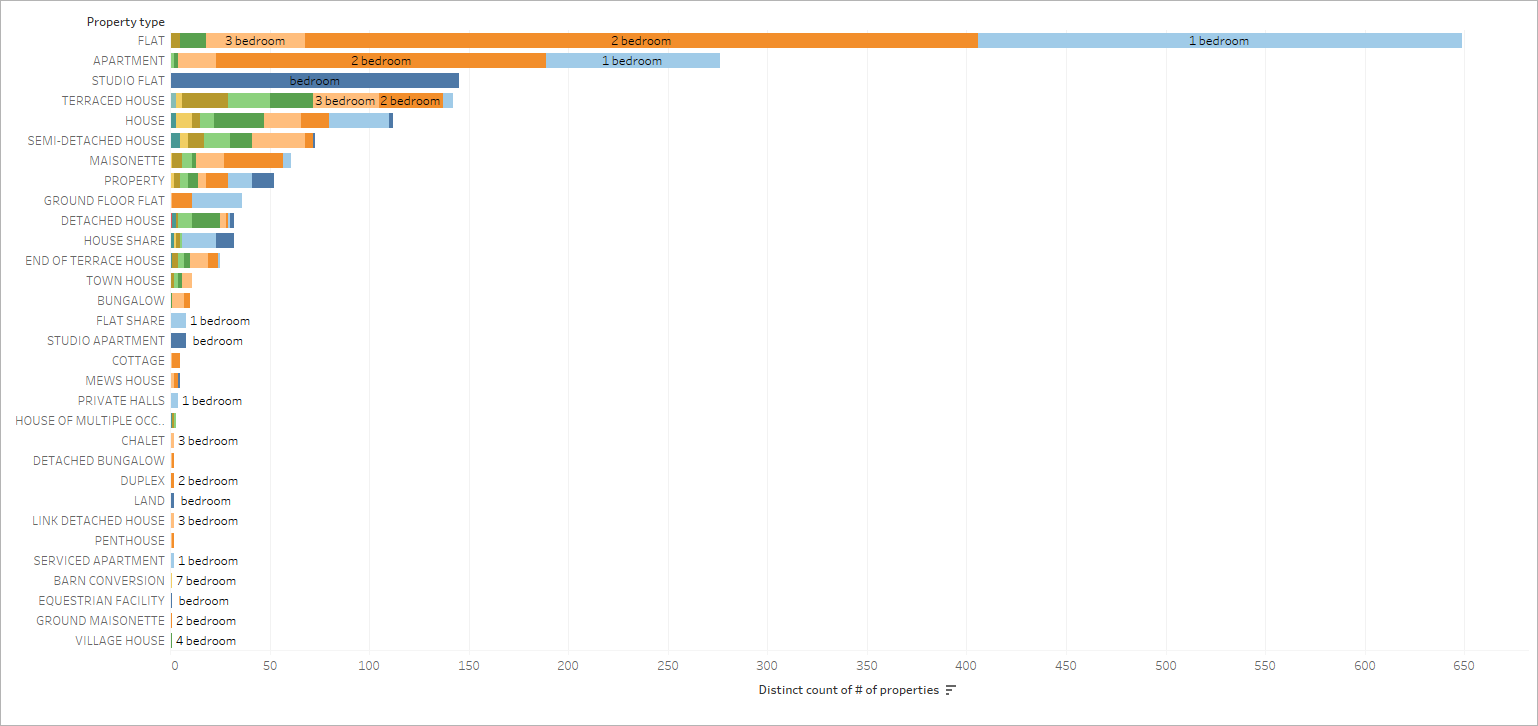
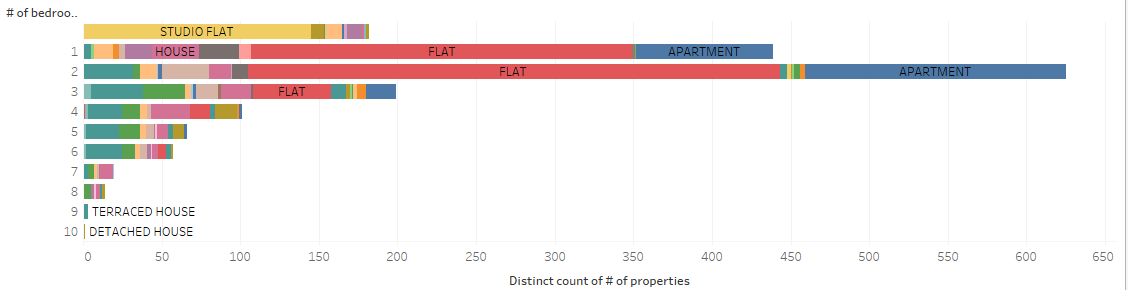
I think both charts work pretty well. The first one presents a nice view of how flats and apartments outnumber all other types and the second one gives a much better understanding of how many of 2 bedroom properties offered compared to all others.
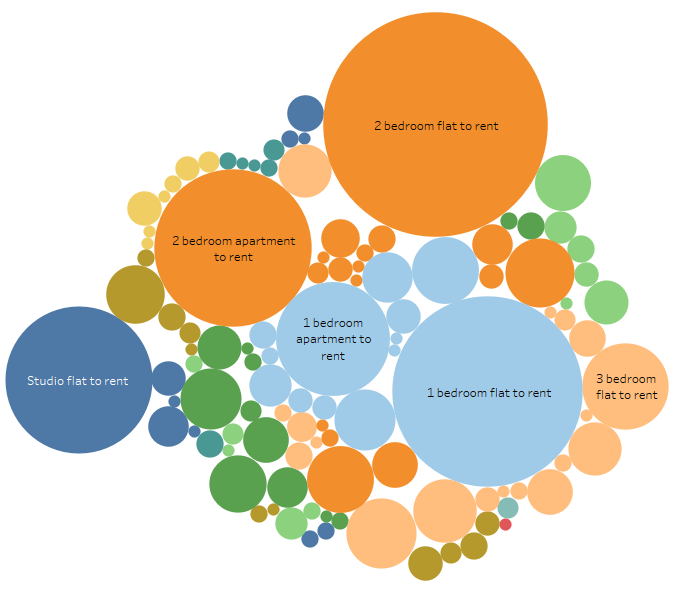
And while I'm not a big fan of fancy visualisations but if you need something less formal and more eye-catching try Bubbles chart. It's not something I'd recommend for an analysis but may work well for a presentation. Every bubble represents particular property type, colour shows a number of bedrooms and size shows the number of properties.
Going Deeper
The next obvious question is the price. How much do different properties cost? Is any particular one more expensive than average or less? What influences the price?
As a baseline, I'd like to know what is the average property price. And I obviously don't want just one figure for the city-wide price. It's meaningless. Let's start with a bar chart and see what is the range of prices.
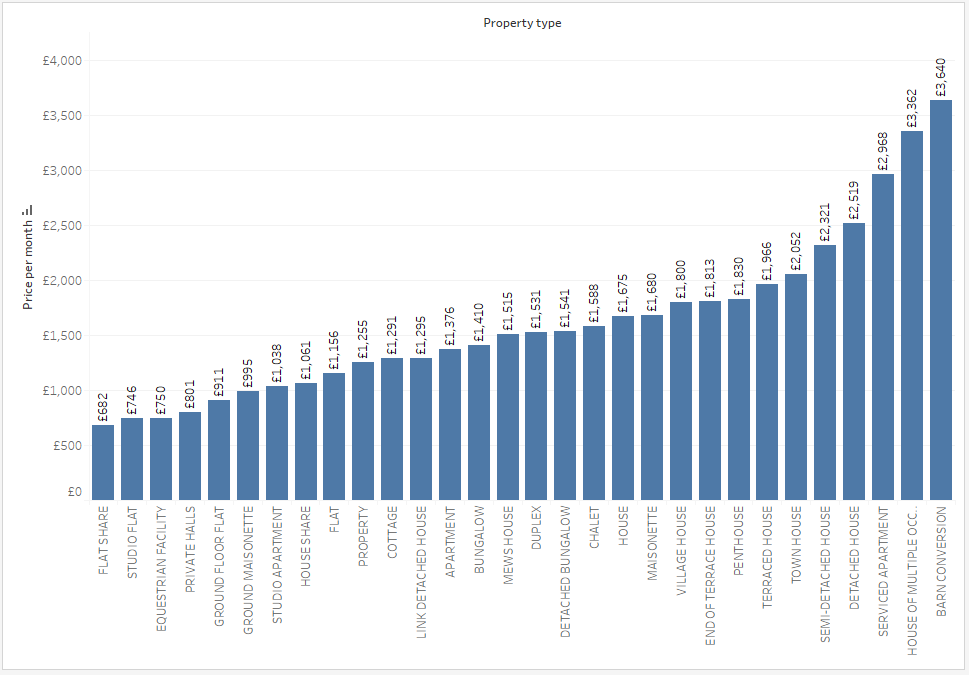
Well, we have a lot of options. Flat share costs less than £700 or we may choose a barn for more than £3600. Again a very simple result but I can't get it directly from the site.
The next obvious question is how the number of bedrooms affects the price. Does the price skyrockets with every additional bedroom or maybe more bedrooms mean smaller rooms and price increases not too fast?
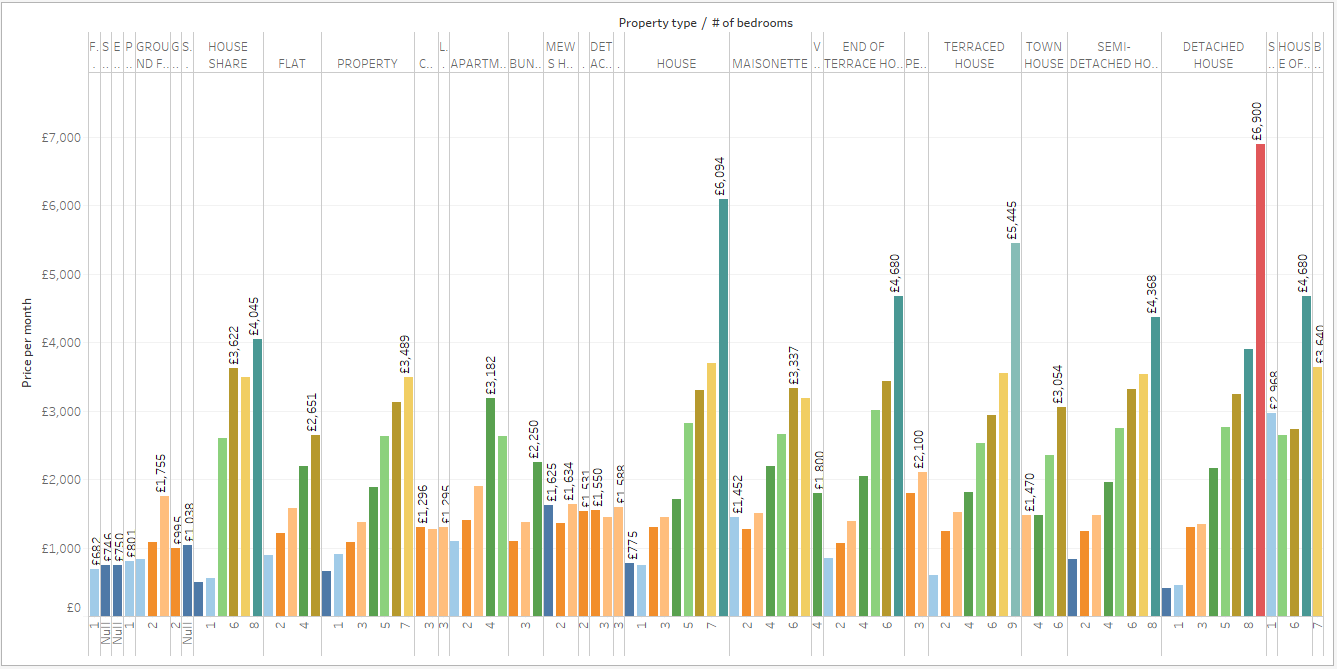
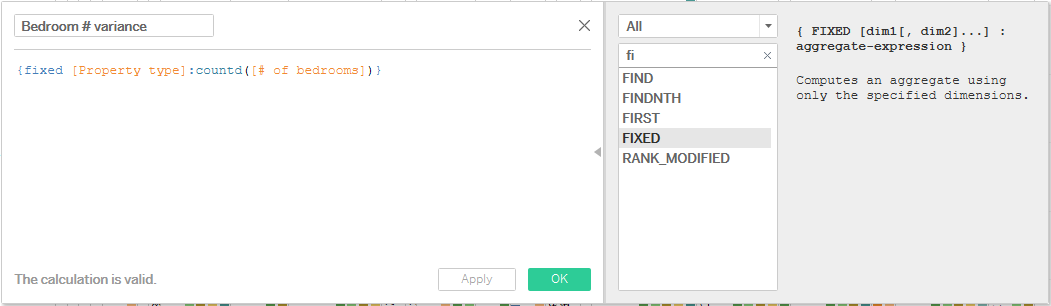
Well, this chart gives me the answer but it looks bad. Mostly because a lot of properties types don't have enough variance in room number. Studio flats have only one bedroom by definition and the only converted barn has 7 bedrooms. I'd like to remove types which don't have at least 3 options and see how the price changes. For this, I created a new computed field using fixed keyword. It counts the number of bedroom options by property type.
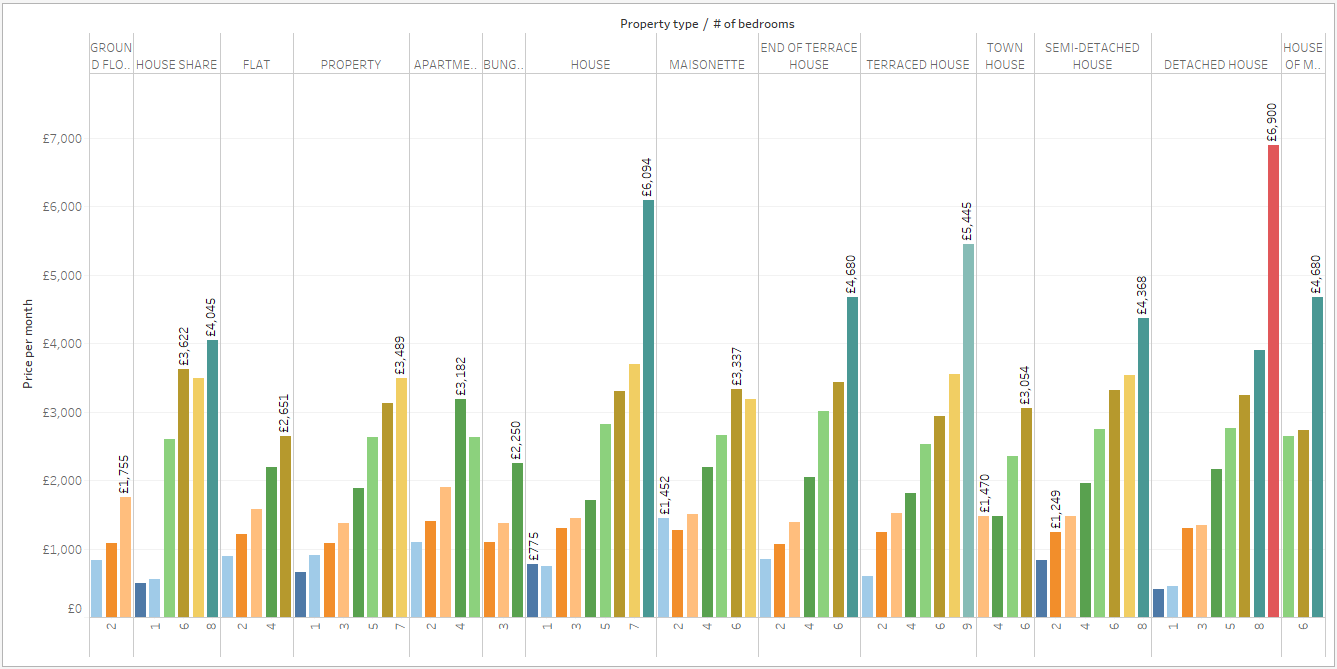
And then I use it in the filter 'Bedroom # variance' at least 3. Now I have a much more clean view. And I can see that typically more bedrooms mean significantly higher price with a few exceptions. But in fact, these are not actual exceptions just a problem of a small dataset. I can say that increase in # bedrooms certainly means a significant increase in price. And one more insight. Going above 7 bedrooms may actually double the price.
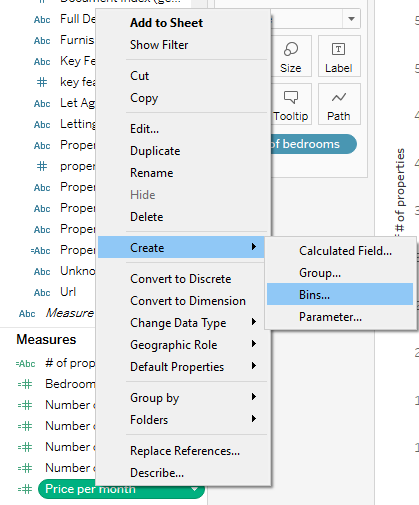
Averages are good but they hide important information of how prices are distributed. For example, six properties priced £1K and one £200 give average £885. And looking at average only may make you think that with £900 you may choose one of 7 options. It's very easy to build a chart to check this. Just create a new calculation called Bins and use in a chart.
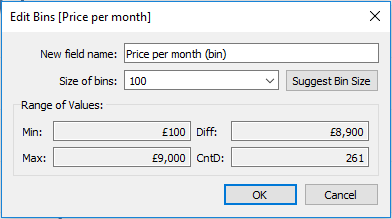
With £100 bins I got the following chart. It shows how many properties have price falling to a particular price range. For example, the £1000 bin shows # of properties with prices £1000-£1100.
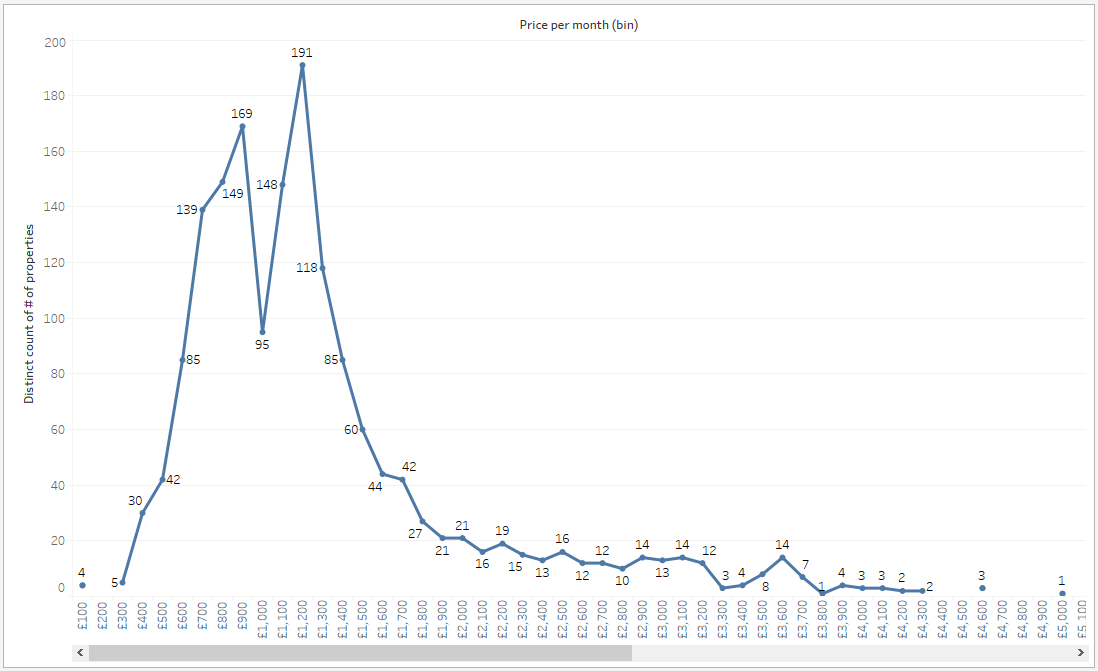
The distribution looks more or less as expected but the most interesting here is that £1000-£1100 interval seems to be very unpopular. Why? Let's add # of bedrooms to this chart.
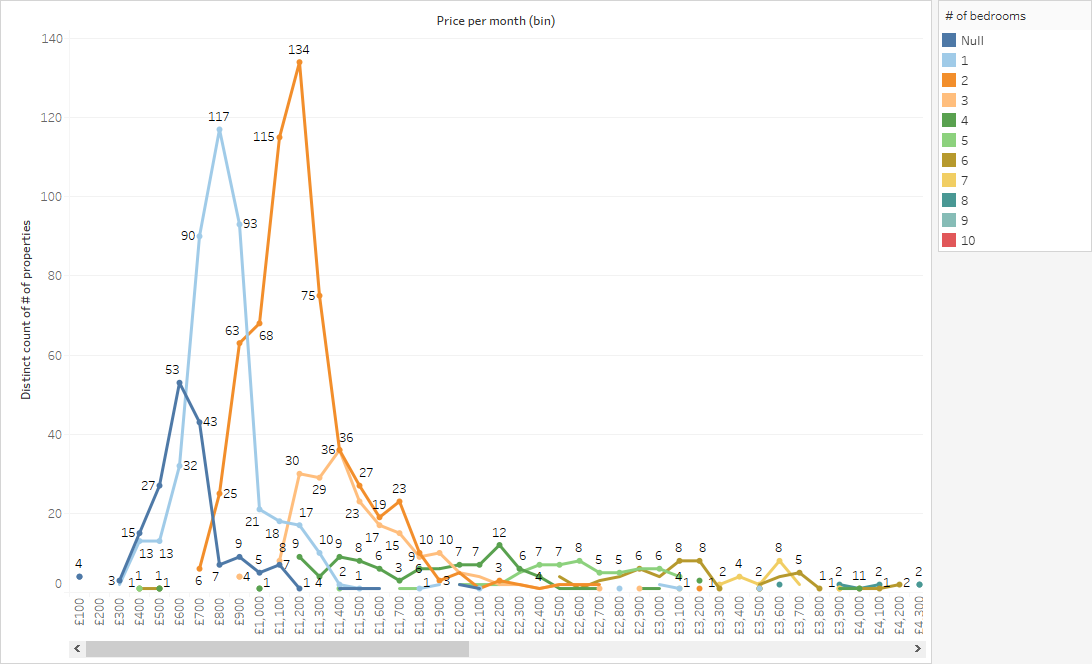
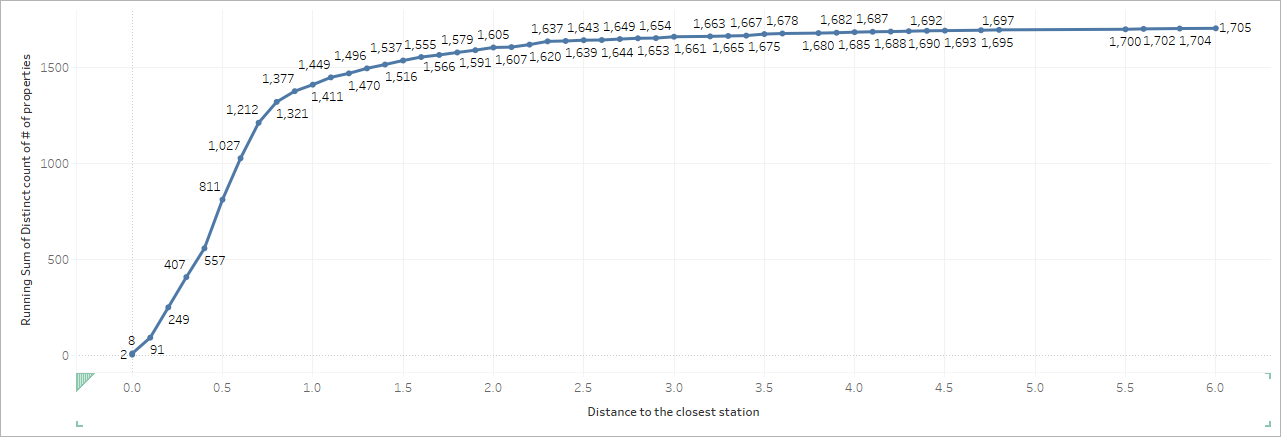
£1000 is too expensive for 1 bedroom and studios but too cheap for two. Simple. What else can we do here before moving further? Converting this chart to a running total gives a cool view.
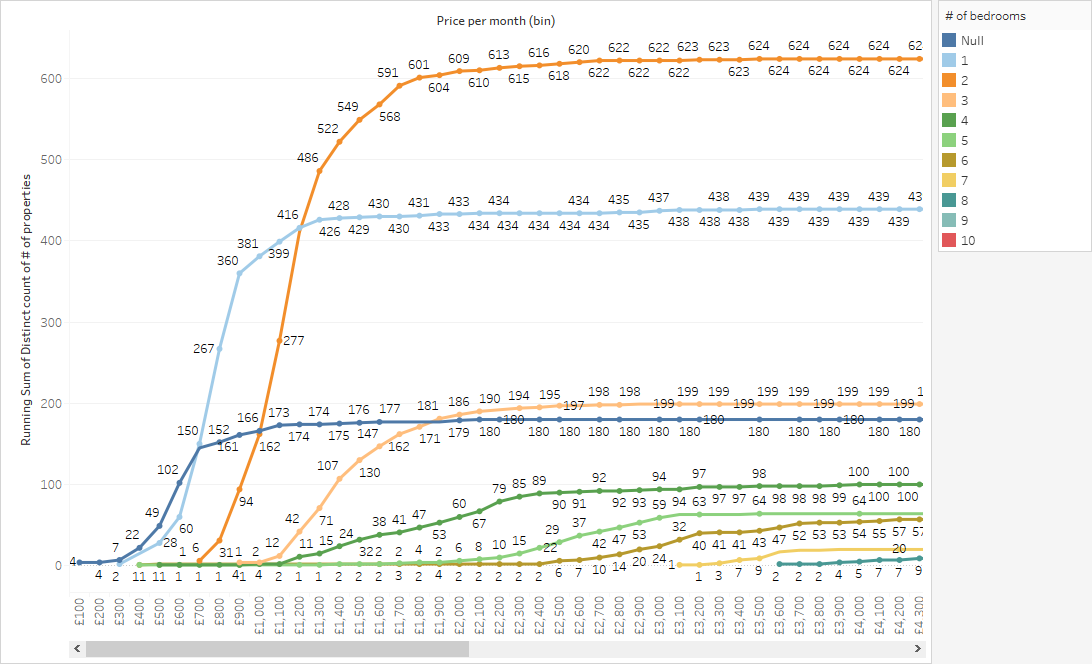
What can this chart tell us? For example, if we look at the orange line (2 bedrooms) we will find that with £1200 we may choose among 277 of 624 properties. With £1400 budget we have 486 of 624. Further £200 increase in budget won't significantly increase the number of possibilities and if the change from £1200 to £1400 almost doubled the number of possibilities, the next £200 give only 63 new options. I don't have a ready to use insight here, but I got a way to estimate a budget for a particular type of property. With budget £X I will be able to choose one of N properties.
Why It Costs What It Costs
OK, now I know a lot of statistics about prices. And my next question is about factors affecting the price. I'd like to understand does a particular property worth what it cost or not. Of course, I won't be able to determine exact price but even hints may be useful.
The first hypothesis I want to check is if a train station near raises the price or it isn't any important. I made a chart very similar to the previous one and it seems that Pareto principle works perfectly here. 80% or properties are closer than 20% of the maximum distance to a station.
But this chart doesn't say anything about the price it just gives me the understanding of how dense train stations are placed. I'd say that most of the properties have a station in 10-15 minutes of walking reach and therefore this should not significantly affect the price. My next chart is a scatter plot for price and distance. Every point is a property and its coordinates on the plot determined by its price and distance to the nearest station. Colour shows # of bedrooms.
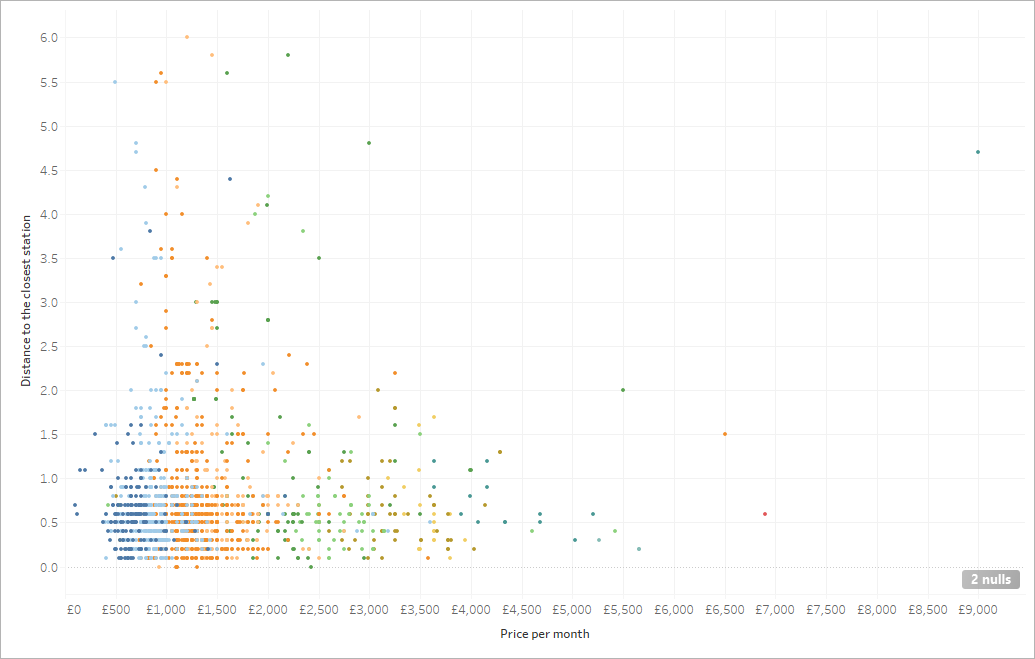
I'd say that this chart shows no clear correlation between price and distance. And a more classical line chart shows that.
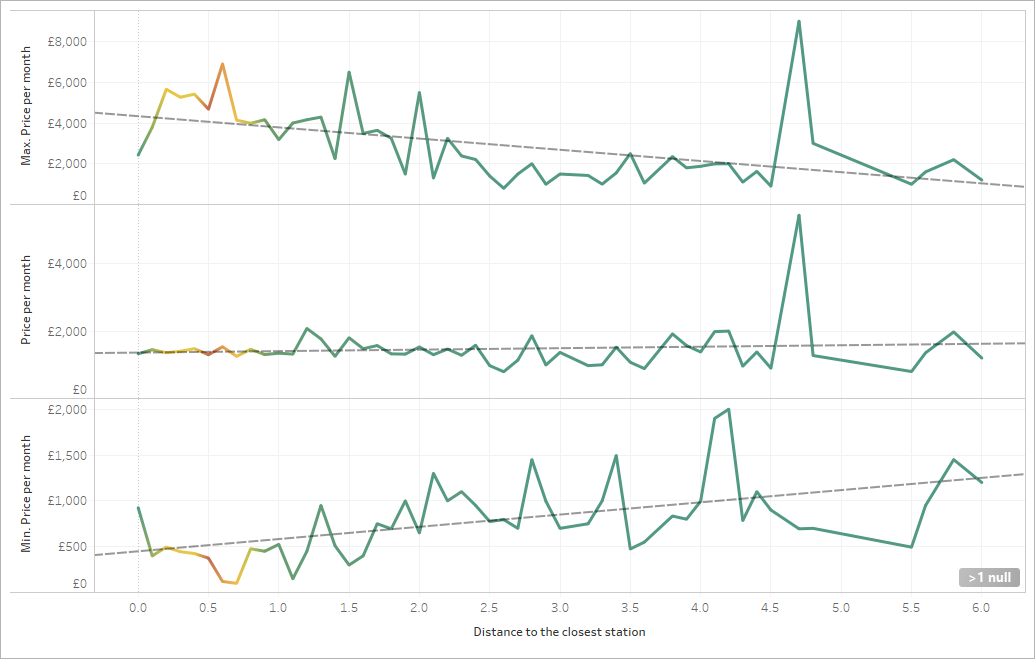
The maximum price slightly decreases with distance, minimum price on the contrary increases. Average price more or less constant. I think the hypothesis is busted. There is no clear correlation between the distance a tenant have to walk to a station and the price he has to pay. If you want to rent something and the landlord says that the price is high because of a train station near, tell him that there are stations all around and he should find something more interesting.
What about furnishings? Does it cheaper to get an unfurnished property or a landlord will be happy to meet someone who shares his taste?
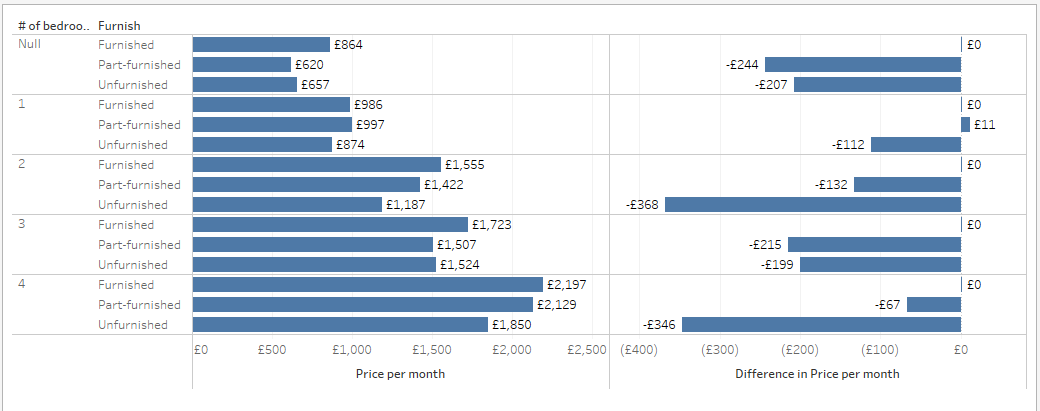
Unfurnished property is definitely cheaper. And it's interesting that in some cases partly furnished even cheaper than completely unfurnished. But at least for furnished/unfurnished, we can see a clear correlation. When you see a furnished one for the price of unfurnished this may be a good pennyworth.
Another thing I'd like to check. Can we expect I lower price for a property not available immediately? Or is, on the contrary, the best price is offered for already unoccupied properties?
As always start with a general picture. What is the average time of availability by property types?
For most popular types it is about one month and if you have a house you typically publish it two or three months in advance. And what is about the price? One more chart that I like in Tableau. In the nutshell, it is a normal line chart showing an average price by days before property availability. But the thickness of lines shows the number of properties at the same time. So I can see not only the price but reliance too. A thick line means it was formed by many properties and a thin line may be formed by few properties and move up or down significantly then something changes. It would be very interesting to get a historical data and see how much time properties stay free or how long it takes before the price is reduced, but unfortunately, I don't have this data.
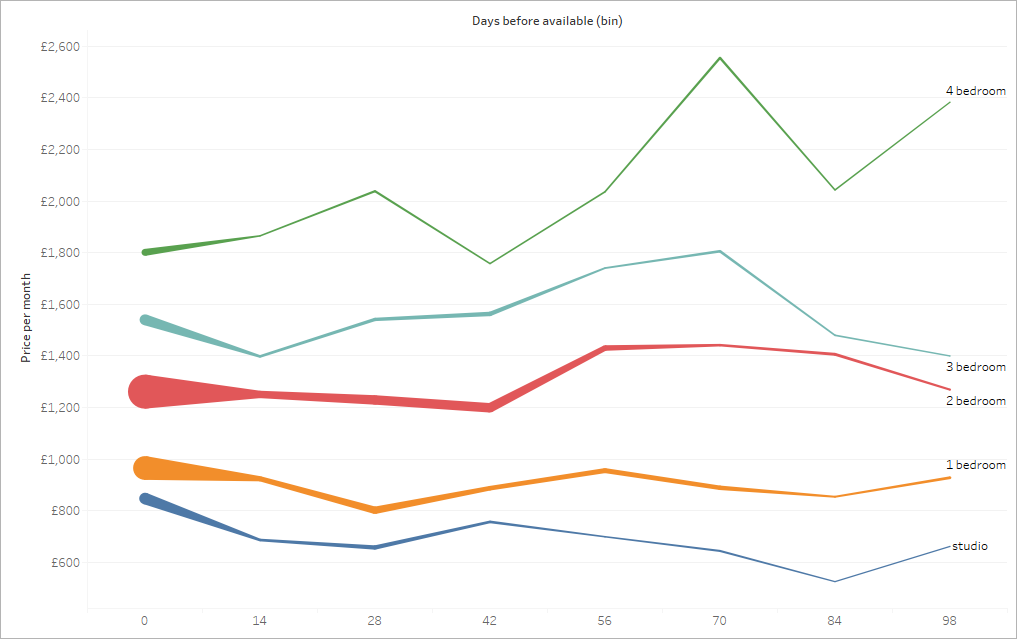
And looking at this chart I'd say that there is no statistically significant dependency for price and availability date. Renting a property available in the distant future won't save you money* (*=statistically).
And the last thing I'd like to investigate is the Key features. What do landlords put as the key features of their properties? How do they affect the price?
The list of popular Key features surprised me.
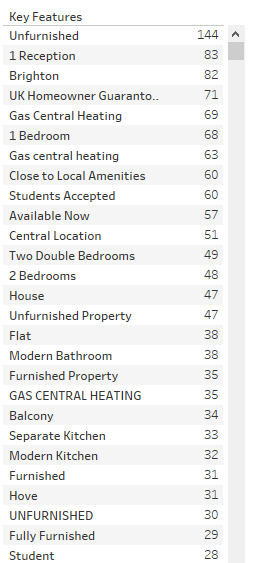
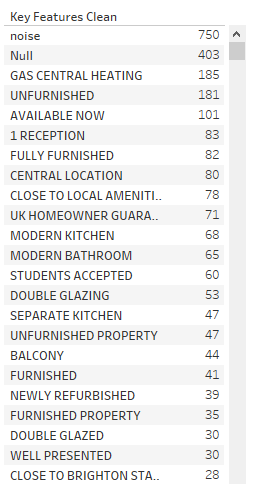
'Unfurnished' looks good to me, it is a really significant part of the deal. But 'Brighton'? For properties in Brighton? '1 Bedroom'. How many bedrooms can '1 bedroom flat to rent' have? Oh, there is a key feature saying '1 bedroom' now I know. But jokes aside. I had to make a lot of cleaning on this data before I could use it. There are six ways to write 'Modern kitchen'. Make everything upper case, then remove quotes, strip spaces and tabs, remove noisy features like 'stylish 1 bedroom apartment' and so on. After this, I got a slightly better list with approximately 3500 features instead of 4500. Note how all variants of writing 'GAS CENTRAL HEATING' now combined into one most popular feature. But there are still too many features. I'm sure that there should be not more than a hundred of them. Even at this screenshot you may see 'Unfurnished' and 'Unfurnished property' features.
When I need a visualisation for this amount of points, bar charts or tables won't play well. My weapon of choice is Scatter plot. Every point is a particular feature, axes are minimum and average prices of it, size is determined by the number of properties declaring to have this feature and the colour is the maximum price. So if a feature is located high on the plot it means that in average it will be expensive to have it. If this feature at the same time located close to the left side even cheap properties may have it. For example, if you want a swimming pool be ready to pay at least £3000 and £7000 in average. And the minimum price for tumble dryer is £3250 but average £3965. The cheapest property with a dryer is more expensive than with a pool, but in average pools are more expensive. That is how this chart works.
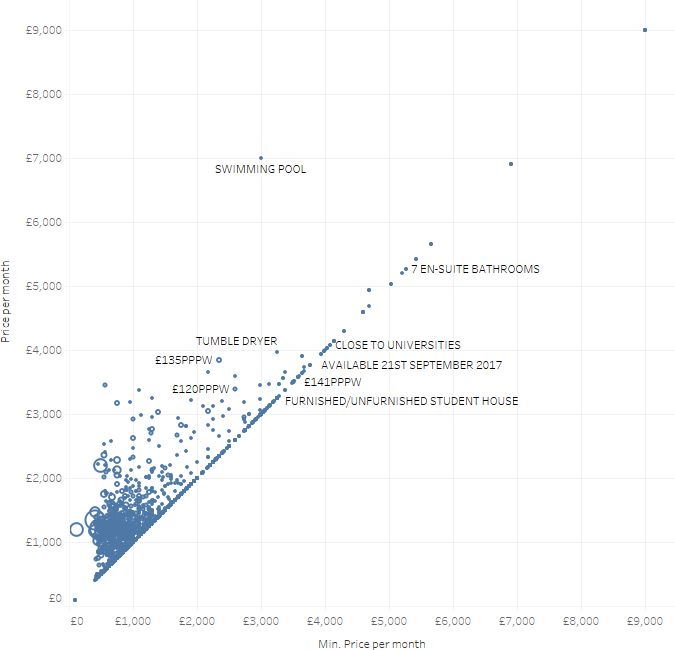
The problems of this chart are obvious. It is littered with unique features. Only one property has 4 acres (the point in top right corner). And actually not so many swimming pools are available for rent in Brighton. I filtered it by "# of properties > 25" and here is how prices for the most popular features are distributed.
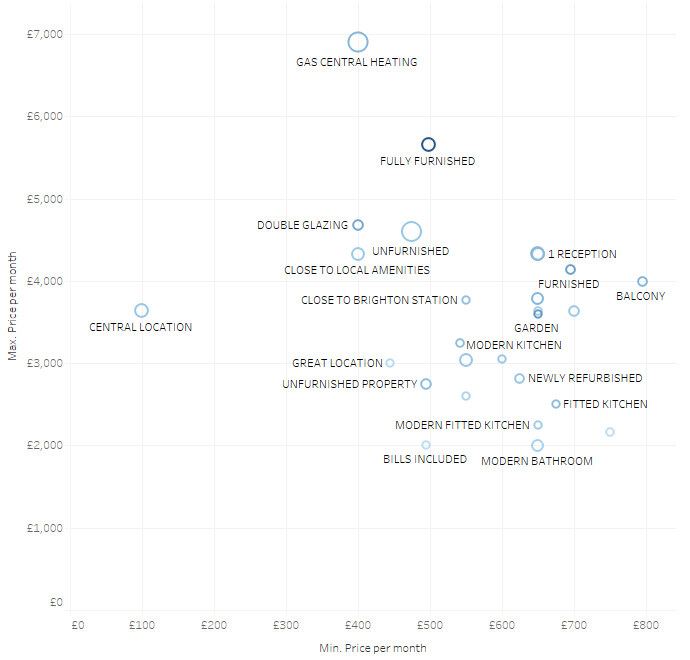
Central location will cost you at least £100 and £1195 in average and for Great location be ready to pay at least £445 and £1013 in average. Great location seems to be less valuable than the central one.
And now I can see how a particular feature impacts prices. For example 'GAS HEATING'. I made a set with all variants of heating I could find ('GAS CENTRAL HEATING', 'GAS HEAT' and so on). Now I can analyse how this feature impacts properties. And here is how it impacts the price of flats. Blue circles are properties with gas heating and orange are without.
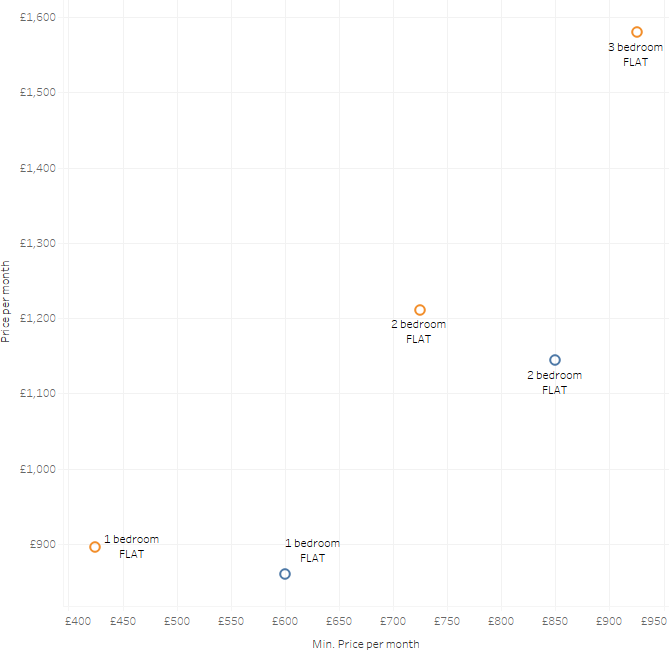
Very interesting in my opinion. The minimum price of properties with gas heating (blue circles) is higher than without. That is expected. But average price for properties without gas heating is higher.
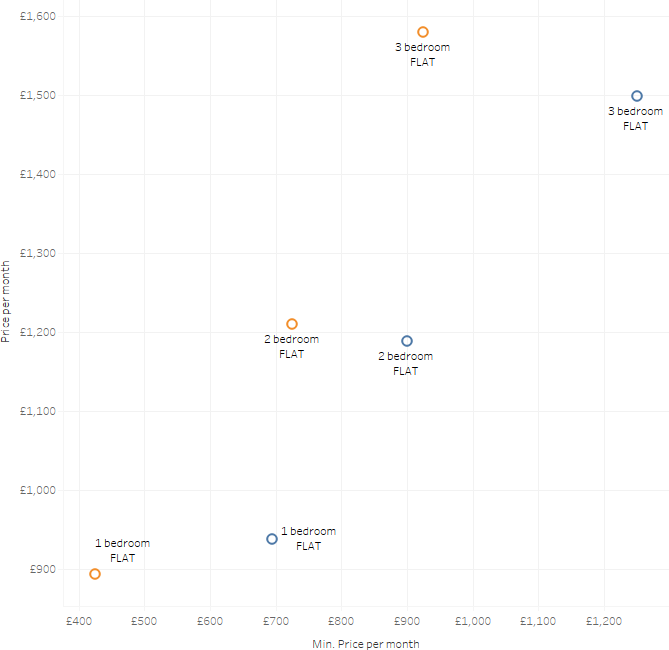
And here are kitchen appliances. For 1 bedroom flats, they increase both minimum and average prices significantly. But for bigger flats minimum price with appliances is higher and average price is lower. Possible this option is important for relatively cheap properties, but its weight is not that big for the bigger ones.
Summary