Unify - An Insight Into the Product

Monday, 12 Jun saw the official release of Unify, Rittman Mead's very own connector between Tableau and OBIEE. It provides a simple but powerful integration between the two applications that allows you to execute queries through OBIEE and manipulate and render the datasets using Tableau.
Why We Made It
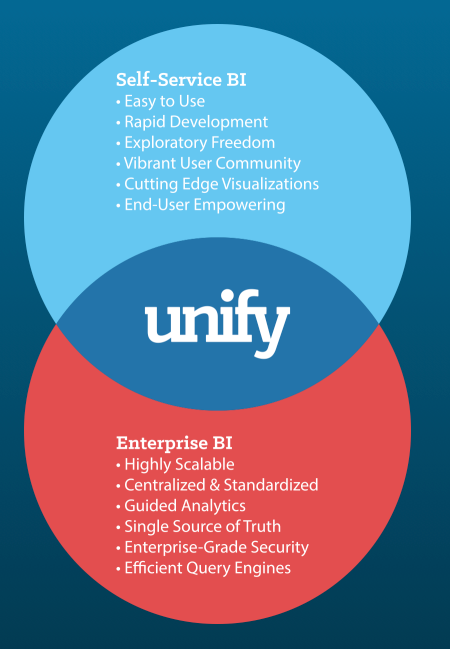
One of the first questions of course would be why we would want to do this in the first place. The excellent thing about OBI is that it acts as an abstraction layer on top of a database, allowing analysts to write efficient and secure reports without going into the detail of writing queries. As with any abstraction, it is a trade of simplicity for capability. Products like Tableau and Data Visualiser seek to reverse this trade, putting the power back in the hands of the report builder. However, without quoting Spiderman, care should be taken when doing this.
The result can be that users write inefficient queries, or worse still, incorrect ones. We know there will be some out there that use self service tools as purely a visualisation engine, simply dropping pre-made datasets into it. If you are looking to produce sustainable, scalable and accessible reporting systems, you need to tackle the problem both at the data acquisition stage as well as the communication stage at the end.
If you are already meeting both requirements, perhaps by using OBI with Data Visualiser (formerly Visual Analyser) or by other means then that's perfectly good. However, We know from experience that there are many of you out there that have already invested heavily into both OBI and Tableau as separate solutions. Rather than have them linger in a state of conflict, we'd rather we nurse them into a state of symbiosis.
The idea behind Unify is that it bridges this gap, allowing you to use your OBIEE system as an efficient data acquisition platform and Tableau as an intuitive playground for users who want to do a a bit more with their data. Unify works by using the Tableau Web Data Connector as a data source and then our customised software to act as an interface for creating OBIEE queries and them exporting them into Tableau.
How It Works
Unify uses Tableau's latest Web Data Connector data source to allow us to dynamically query OBIEE and extract data into Tableau. Once a dataset is extracted into Tableau, it can be used with Tableau as normal, taking advantages of all of the powerful features of Tableau. This native integration means you can add in OBIEE data sources just as you would add in any others - Excel files, SQL results etc. Then you can join the data sources using Tableau itself, even if the data sources don't join up together in the background.
First you open up Tableau and add a Web Data Connector source:
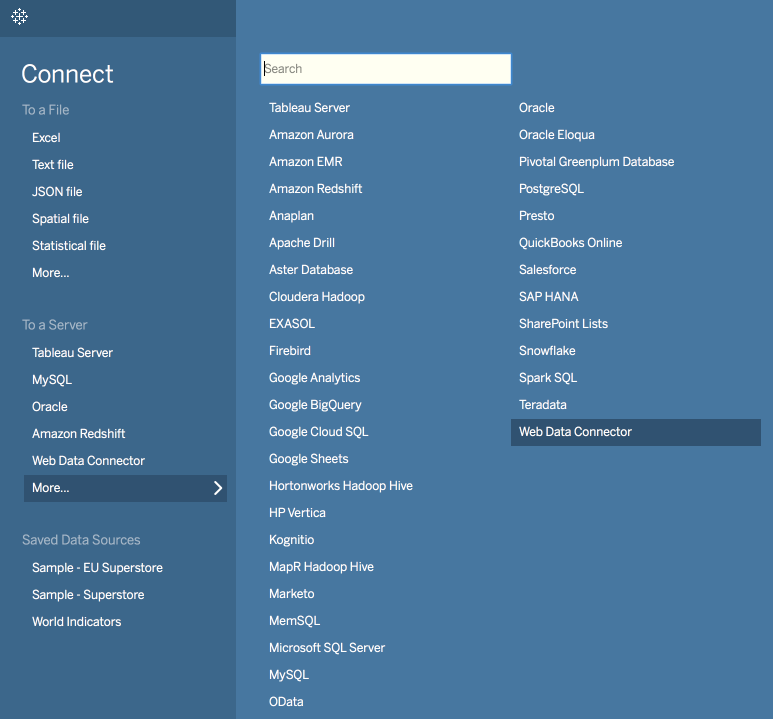
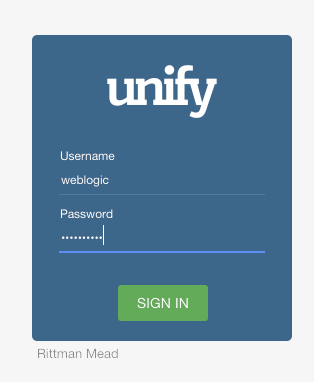
Then give the link to the Unify application, e.g. http://localhost:8080/unify. This will open up Unify and prompt you to login with your OBIEE credentials. This is important as Unify operates through the OBIEE server layer in order to maintain all security permissions that you've already defined.
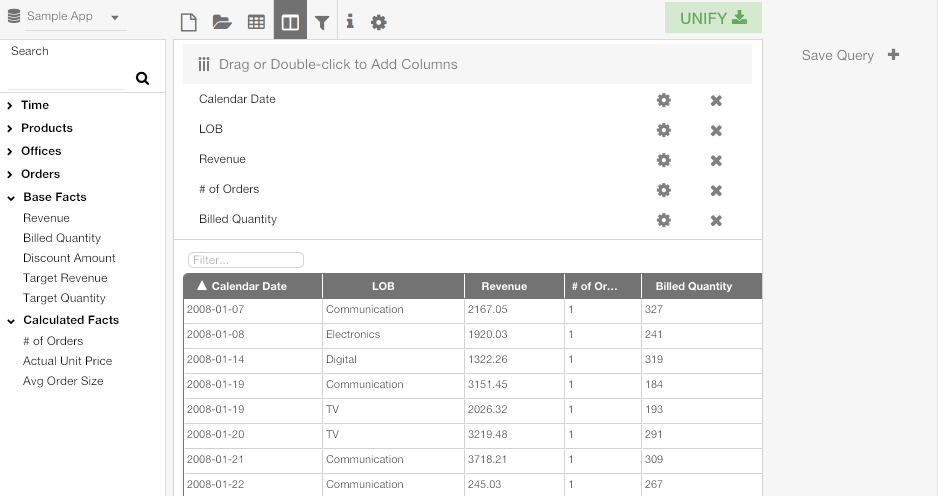
Now that the application is open, you can make OBIEE queries using the interface provided. This is a bit like Answers and allows you to query from any of your available subject areas and presentation columns. The interface also allows you to use filtering, column formulae and OBIEE variables much in the same way as Answers does.
Alternatively, you can open up an existing report that you've made in OBIEE and then edit it at your leisure. Unify will display a preview of the dataset so you can tweak it until you are happy that is what you want to bring into Tableau.
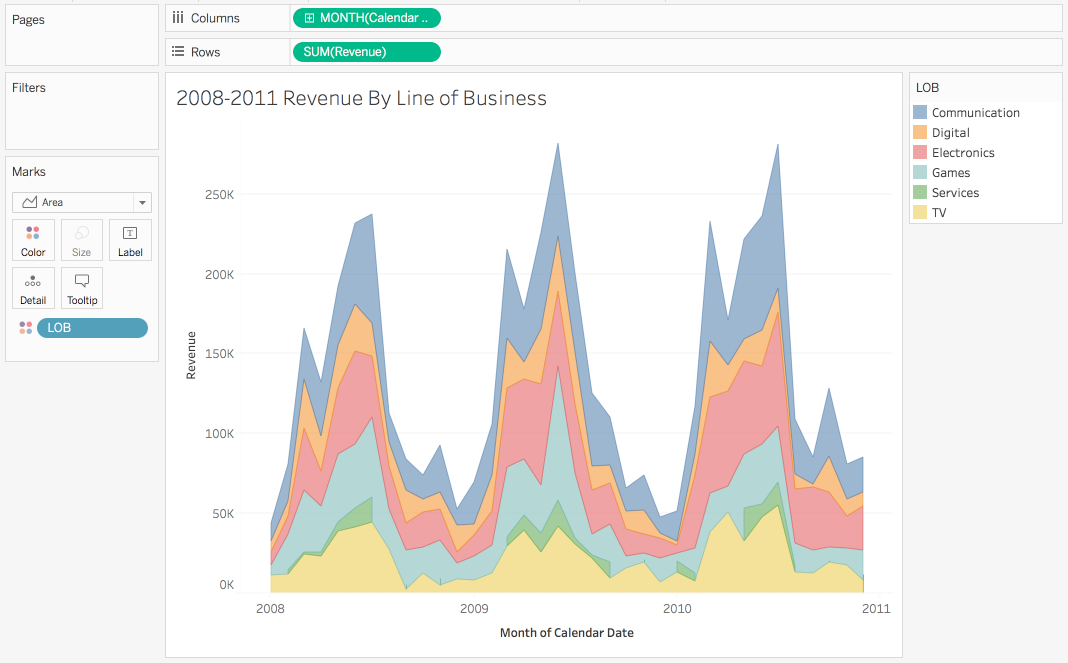
Once you're happy with your dataset, click the Unify button in the top right and it will export the data into Tableau. From this point, it behaves exactly as Tableau does with any other data set. This means you can join your OBIEE dataset to external sources, or bring in queries from multiple subject areas from OBIEE and join them in Tableau. Then of course, take advantage of Tableau's powerful and interactive visualisation engine.
Unify Server
Unify comes in desktop and server flavours. The main difference between the two is that the server version allows you to upload Tableau workbooks with OBIEE data to Tableau Server and refresh them. With the desktop version, you will only be able to upload static workbooks that you've created, however with the server version of Unify, you can tell Tableau Server to refresh data from OBIEE in accordance with a schedule. This lets you produce production quality dashboards for your users, sourcing data from OBIEE as a well as any other source you choose.
Unify Your Data
In a nutshell, Unify allows you to combine the best aspects of two very powerful BI tools and will prevent the need for building all of your reporting artefacts from scratch if you already have a good, working system.
I hope you've found this brief introduction to Unify informative and if you have OBIEE and would like to try it with Tableau, I encourage you to register for a free desktop trial. If you have any questions, please don't hesitate to get in touch.