Oracle Data Visualization Desktop v3


The ODTUG Kscope17 conference last week in San Antonio was a great event with plenty of very interesting sessions and networking opportunities. Rittman Mead participated during the thursday deep dive BI session and delivered three sessions including a special "fishing" one.
— Andrew Fomin (@fomin_andrew) 28 giugno 2017
In the meantime Oracle released Data Visualization Desktop 12.2.3.0.0 which was presented in detail during Philippe Lions session and includes a set of new features and enhancements to already existing functionalities. Starting from new datasources, through new visualization options, in this post I'll go in detail on each of them.
Data Sources
The following new datasources have been introduced:
- Oracle Docs: Oracle's content sharing cloud product
- OData: Open Data Protocol, a standard protocol for RESTful APIs.
- JDBC
- ODBC
The latter two (still in beta) are very relevant since they enable querying any product directly exposing JDBC or ODBC connectors (like Presto) without needing to wait for the official support in the DVD list of sources.
Still in DVD v3 there is no support for JSON or XML files. In my older blog post I wrote how JSON (and XML) can be queried in DVD using Apache Drill, however this solution has Drill installation and knowledge as a prerequisite which is not always achievable in end users environment where self-service BI is happening. I believe future versions of DVD will address this problem by providing full support to both data sources.
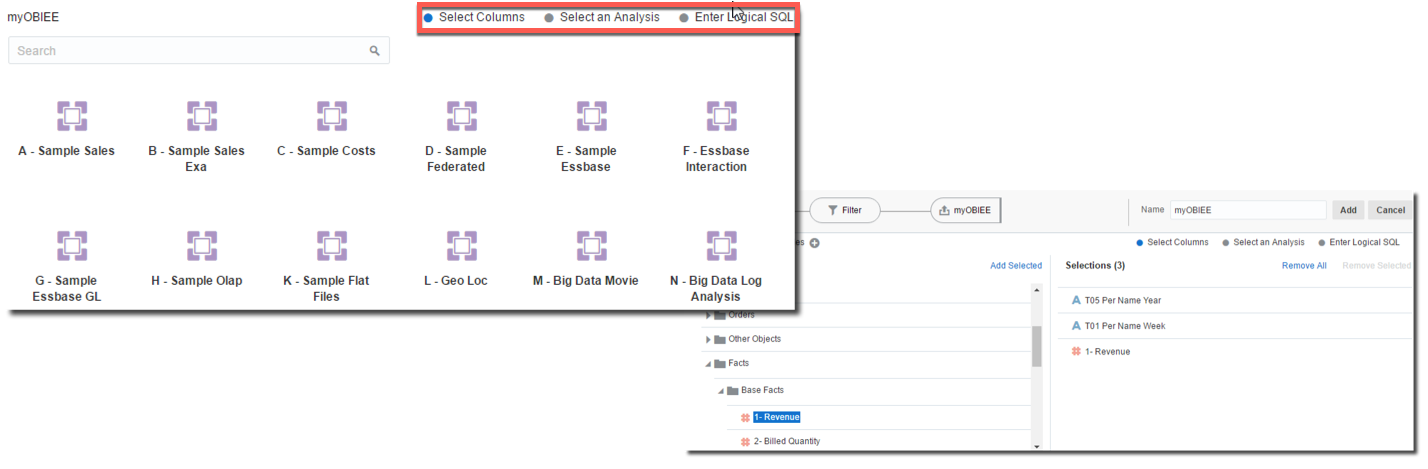
Connection to OBIEE
One of the most requested new features is the new interface to connect to OBIEE: until DVD v2 only pre-built OBIEE analysis could be used as sources, with DVD v3 OBIEE Subject Areas are exposed making them accessible. The set of columns and filters can't be retrieved on the fly during the project creation but must be defined upfront during datasource definition. This feature avoids move back and forth from OBIEE to DVD to create an analysis in as datasource, and then use it in DVD.
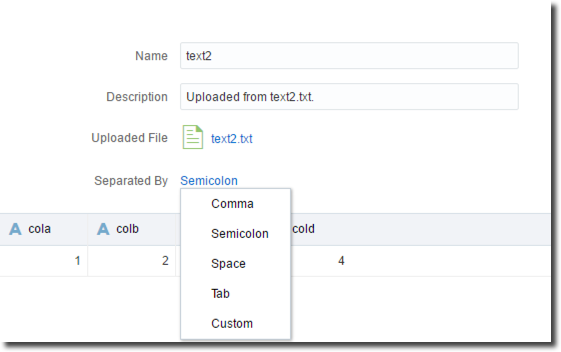
Another enhancement in the datasource definition is the possibility to change the column delimiter in txt sources, useful if the datasource has an unusual delimiters.
Data Preparation
On the data-preparation side we have two main enhancements: the convert-to-date and the time grain level.
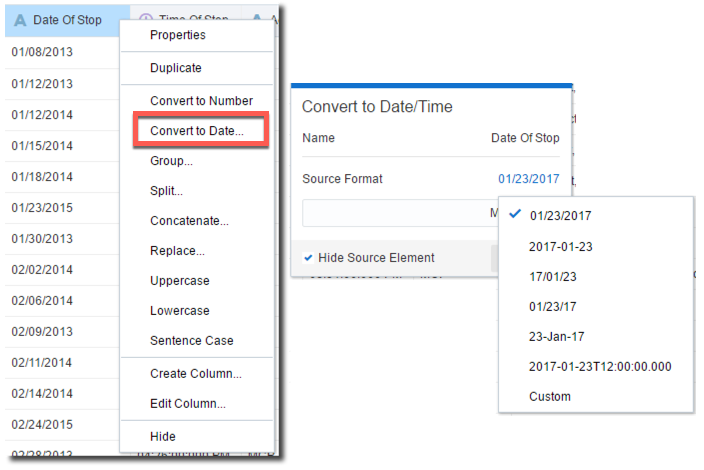
The convert-to-date feature enhances ability for columns to date conversion including the usage of custom parsing strings. Still this feature has some limits like not being able to parse dates like 04-January-2017 where the month name is complete. For this date format a two step approach, reducing the month-name and then converting, is still required.
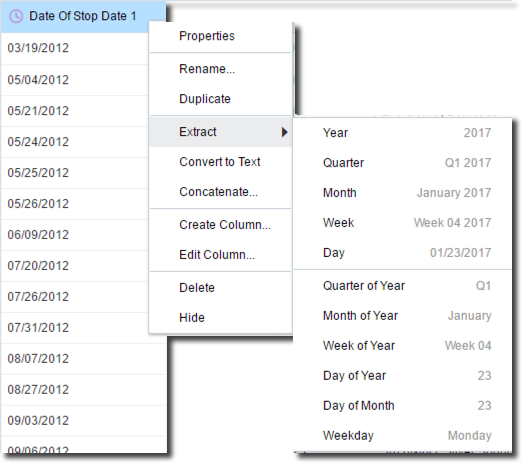
The second enhancement in the data preparation side is the time grain level and format, those options simplify the extraction of attributes (e.g. Month, Week, Year) from date fields which can now be done visually instead of writing logical SQL.
The Dataflow component in DVD v3 has an improved UI with new column merge and aggregation functionalities which makes the flow creation easier. Its output can now be saved as Oracle database or Hive table eliminating the need of storing all the data locally.
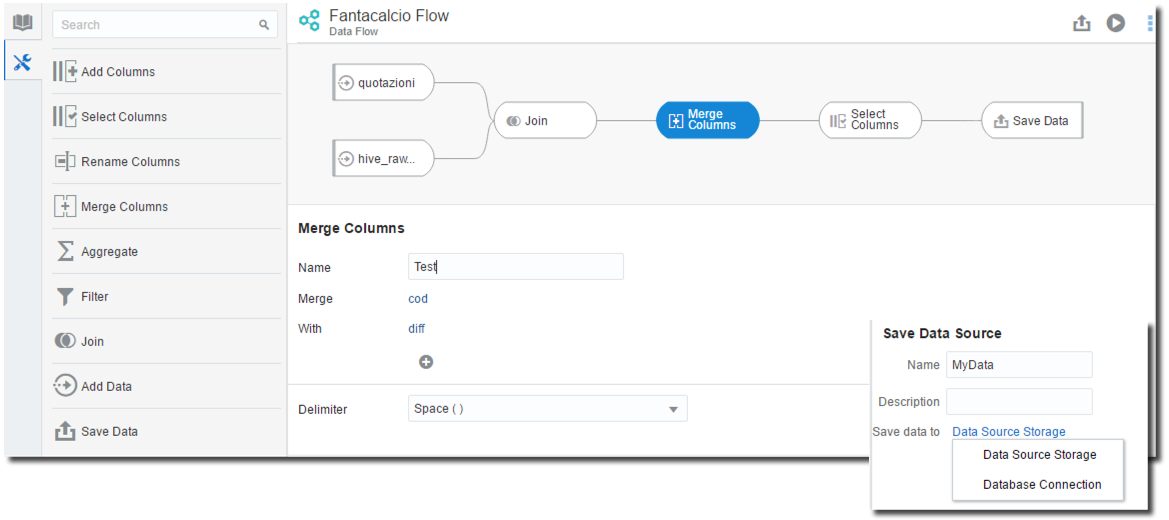
It's worth mentioning that Dataflow is oriented to self-service data management: any parsing or transformation happens on the machine where DVD is installed and its configuration options are limited. If more robust transformations are needed then proper ETL softwares should be used.
New Visualization Options
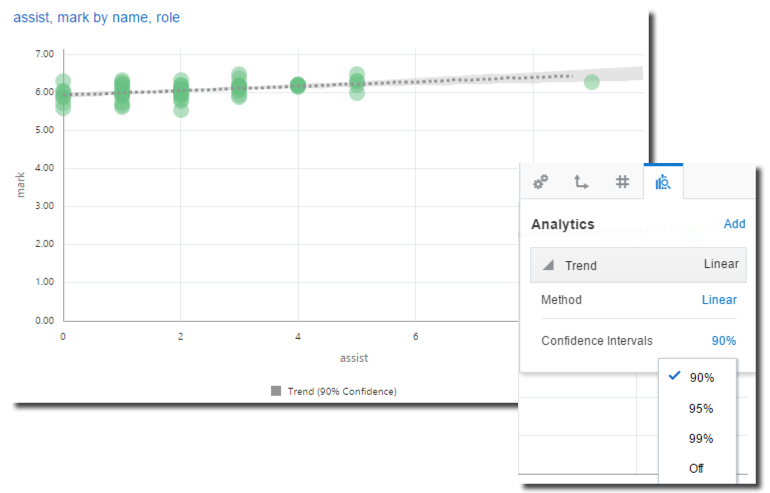
There are several enhancement on the visualization side, with the first one being the trendlines confidence levels which can be shown, with fixed intervals (90%, 95% or 99%)
Top N and bottom N filtering has been added for each measure columns expanding the traditional "range" one.
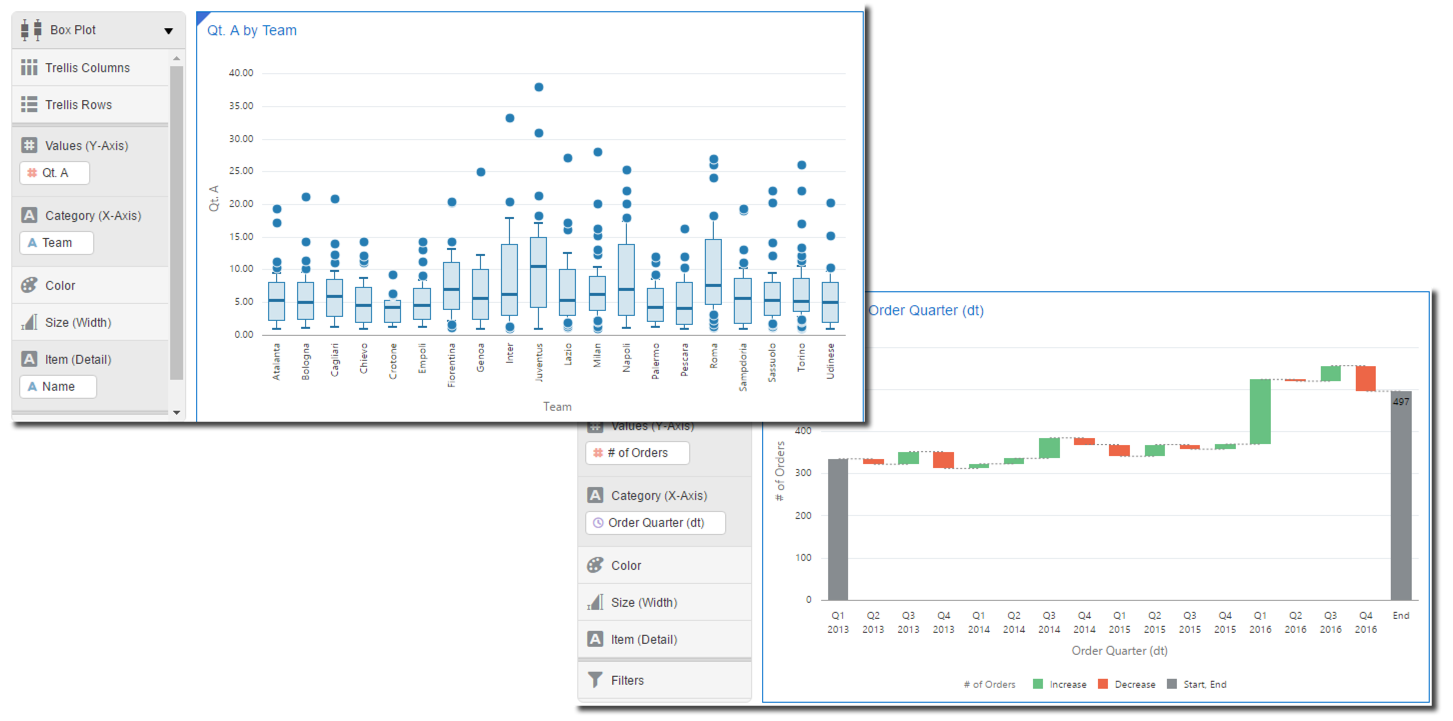
Two new visualizations have also been included: waterfall and boxplot are now default visualizations. Boxplots were available as plugin in previous versions, however the five number summary had to be pre-calculated; in DVD v3 the summary is automatically calculated based on the definition of category (x-axis) and item (value within the category).
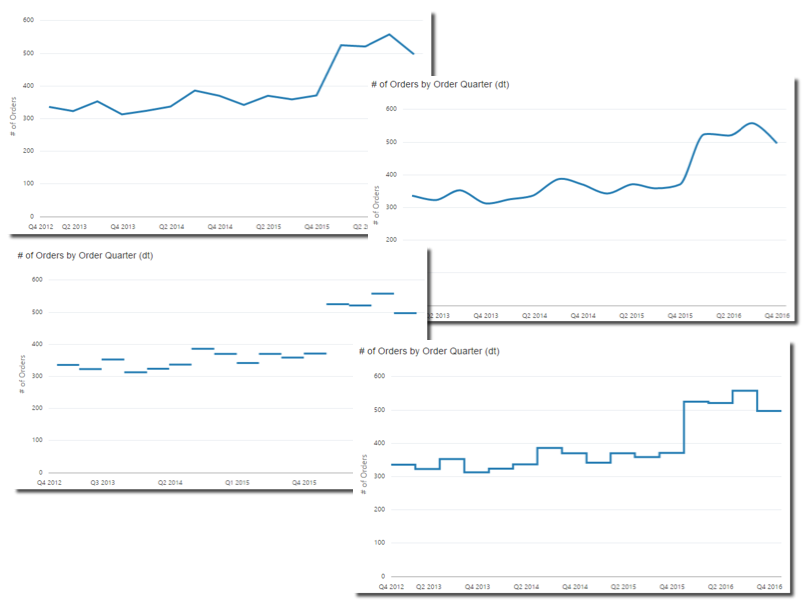
Other new options in the data visualization area include: the usage of logarithmic scale for graphs, the type of interpolation line to use (straight, curved, stepped ...), and the possibility to duplicate and reorder canvases (useful when creating a BI story).
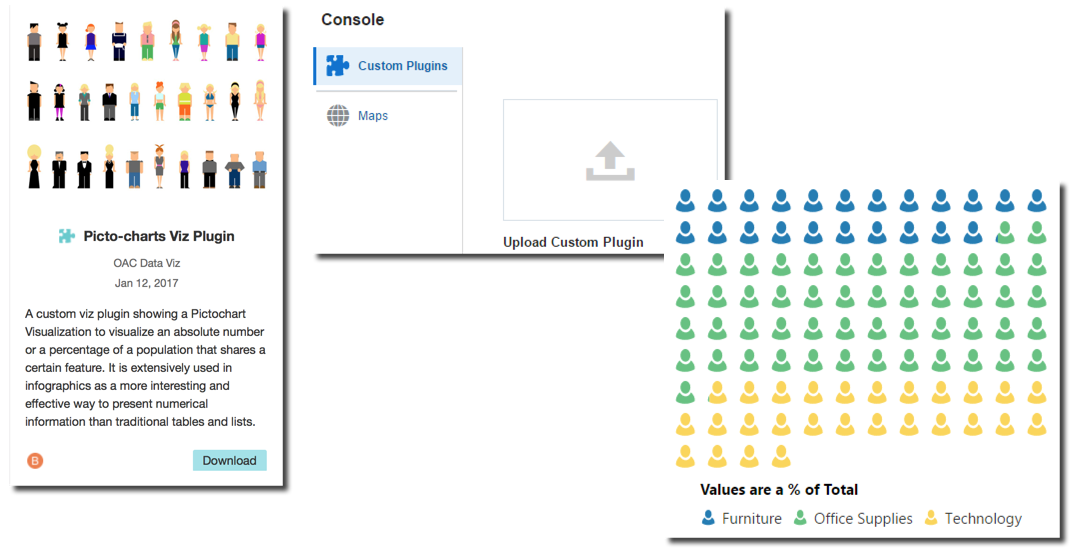
Console
The latest set of enhancements regard the console: this is a new menu allowing end users to perform task like the upload of a plugin that before were done manually on the file system.
The new Oracle Analytics Store lists add-ins divided into categories:
- PlugIn: New visualizations or enhancement to existing ones (e.g. auto-refresh, providing a similar behaviour to OBIEE's slider)
- Samples: Sample projects showing detailed DVD capabilities
- Advanced Analytics: custom R scripts providing non-default functionalities
- Map Layers: JSON shape files that can be used to render custom maps data.
The process to include a new plugin into DVD v3 is really simple: after downloading it from the store, I just need open DVD's console and upload it. After a restart of the tool, the new plugin is available.
The same applies for Map Layers, while custom R scripts still need to be stored under the advanced_analytics\script_repository subfolder under the main DVD installation folder.
As we saw in this blog post, the new Data Visualization Desktop release includes several enhancement bringing more agility in the data discovery with enhancements both in the connections to new sources (JDBC and ODBC) and standard reporting with OBIEE subject areas now accessible. The new visualizations, the Analytics Store and the plugin management console make the end user workflow extremely easy also when non-default features need to be incorporated. If you are interested in Data Visualization Desktop and want to understand how it can be proficiently used against any data source don't hesitate to contact us!