Creating Alerts Using Siebel (OracleBI) Delivers
The other week I went through a walkthrough of Siebel Answers and Siebel Intelligence Dashboards, and I mentioned at the time that it was possible to use reports generated by these two tools as the basis for an alerting mechanism. Within Siebel Analytics (and Oracle BI Suite Enterprise Edition) alerting is provided via Siebel Delivers, and in this posting I'll go through how you set it up and put an alerting mechanism together.
First of all, assuming you've installed Siebel Analytics 7.8 and your license key includes Siebel Delivers, you need to configure a database account to store data that the Siebel Scheduler uses. This can be in an Oracle database, and therefore I created an account called S_NQ_SCHED (the recommended account name) and ran some provided scripts to create the necessary tables:
SQL> conn system/password@ora10g
Connected.
SQL> create user s_nq_sched
  2  identified by password
  3  default tablespace users
  4  temporary tablespace temp
  5  quota unlimited on users
  6  /
User created.SQL> grant connect 2 , create table 3 , create view 4 , create procedure 5 to s_nq_sched 6 /Grant succeeded.SQL> conn s_nq_sched/password@ora10g Connected. SQL> @c:\SiebelAnalytics\Schema\SAJobs.Oracle.sqlTable created....Commit complete.SQL> @c:\SiebelAnalytics\Schema\SAACCT.Oracle.sqlTable created.Index created.Index created.Index created.
My database, Siebel Analytics and Siebel Analytics Web installations are all on the same (virtual) machine, by the way, running Windows XP SP2.
Next I need to set up a TNSNAMES entry to point to the user account I've just set up, like this:
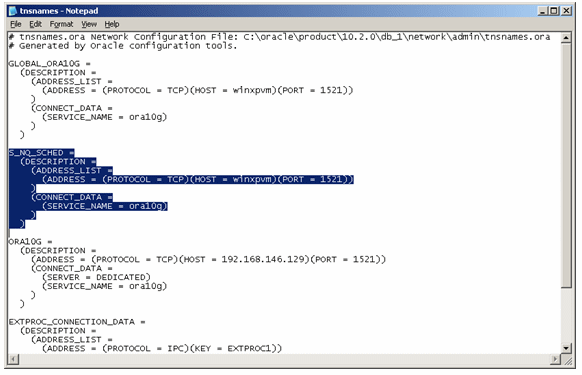
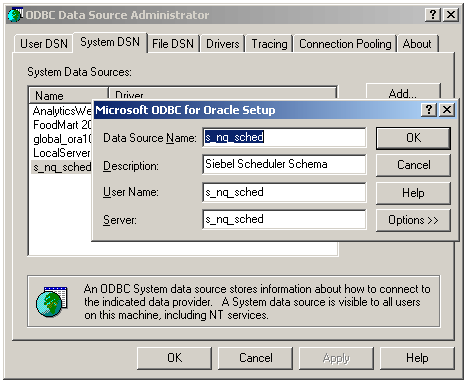
Now, I set up an ODBC System Data Source to point through to this user, using the TNSNAMES.ORA entry I just created.
The final configuration step is to go into the Siebel Analytics Administration tool, and choose Configuration Options from the Job Manager:
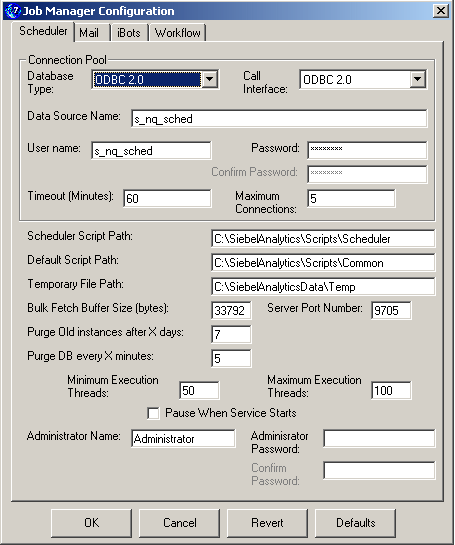
Using this screen, I entered the name of the data source, passed across the username and password, and that was more or less it.
Now we're at the point where we can put an alert together. The next step then is to go into the Siebel Analytics Web client, and create an exception report, in my case one that returns all those Warehouses that have sold less than 20,000 units.
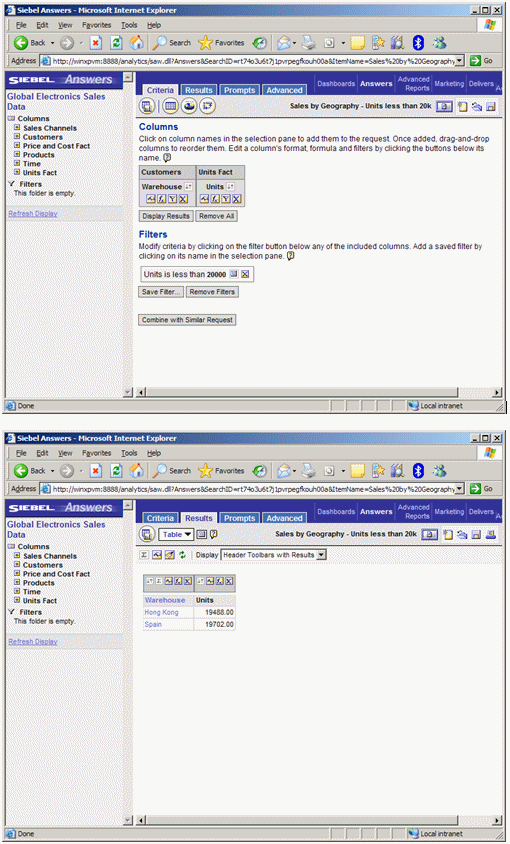
This report tells me which warehouses have sold less than 20,000 units; I'm now going to set up an alert that runs this report, and if any warehouses fall below the 20,000 limit, have the scheduler send the report out to anyone who subscribes to the alert.
The next step then is to click on the "Delivers" link at the top of the page, and create what's called an iBot. An iBot is a process that runs to a schedule and performs a task, which can be as simple as running my alert, or as complex as anything I can put together as a script. iBots are also the way you pre-seed the cache - you run iBots that then run commonly accessed reports after you've done a data load, and then the data your users will require will be in the cache when they come to run their reports;
Once Delivers is running, it's time to create the iBot. The Delivers home page gives you a list of availalble iBots on the left-hand side, and options to create new iBots, customise subscriptions and so on in the main area of the page.
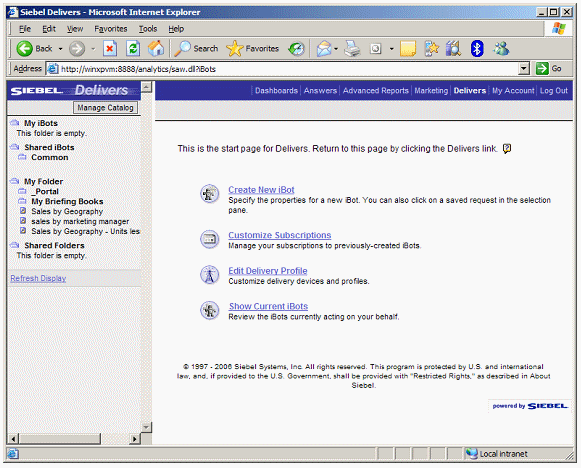
The obvious next step then is to create a new iBot, and so I click on the first link. I'm then presented with the elements that make up an iBot process.
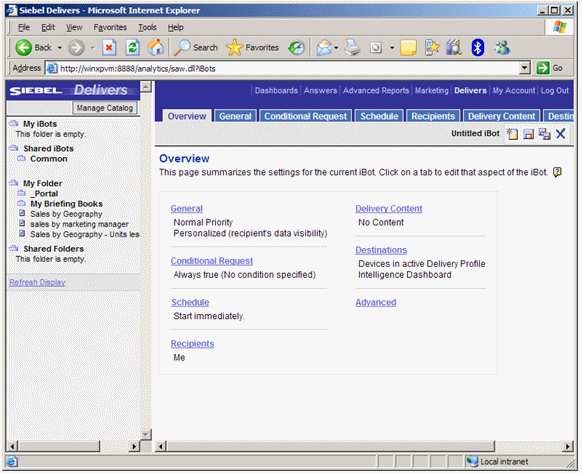
For this simple example, I leave the priority as standard, and the data visibility as personalised, so that the alert subscriber will only see the data they're scoped for, as opposed to the data the iBot creator can view. The interesting bit is the "Conditional Request" section though, as this is where we create the test condition for the alert.
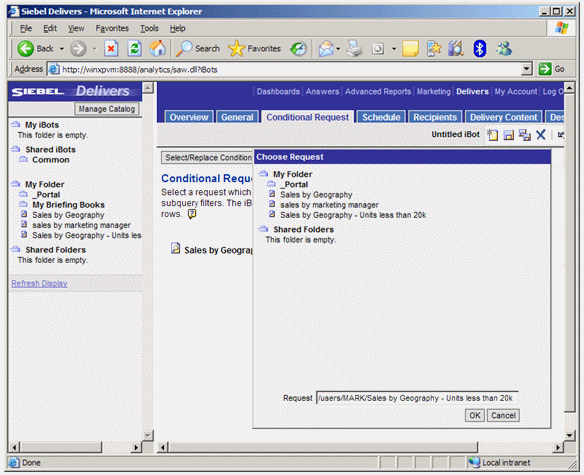
The way you accomplish this is to select a Siebel Answers report (or a "request" in Siebel Analytics jargon) which will be run when the iBot executes. If the report returns one row or more, the iBot condition is satisfied and the process runs. Therefore, like the report I picked earlier, you want one that runs and has a filter that corresponds to the alert you want to create.
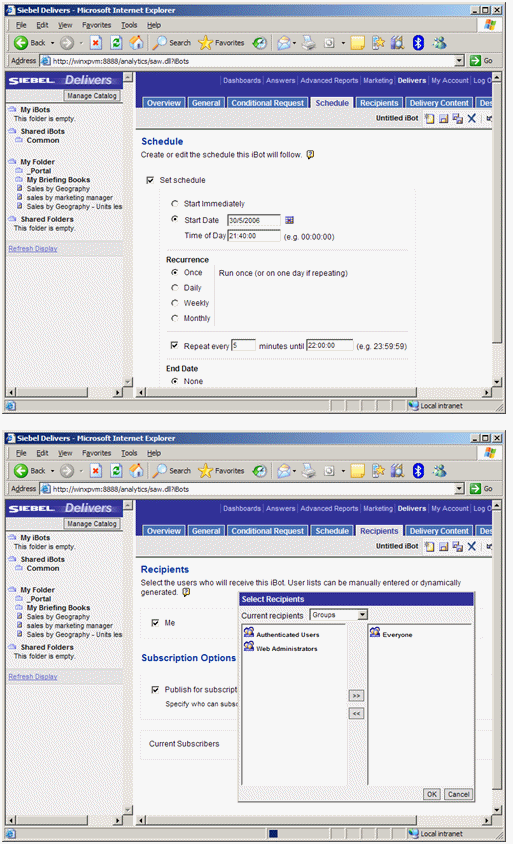
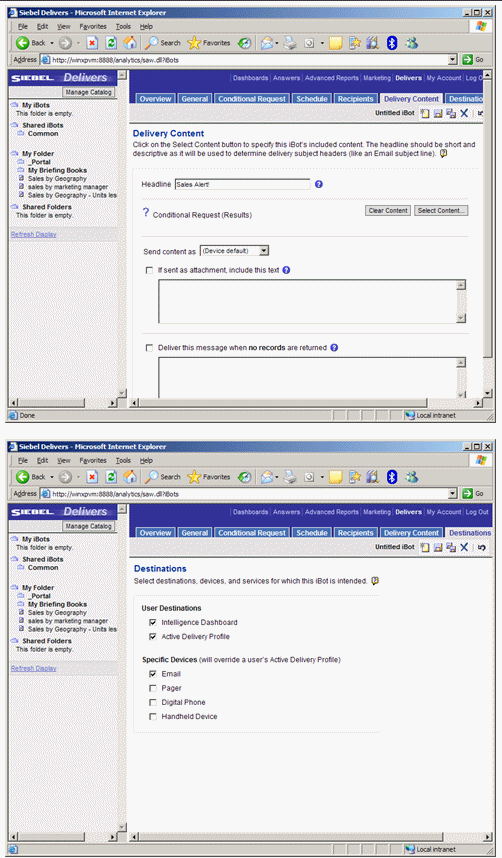
Once the request has been defined, the next step is to define the iBot schedule, the recipients (the default is just you), the delivery content, which is usually the request that you selected earlier, and the destinations.
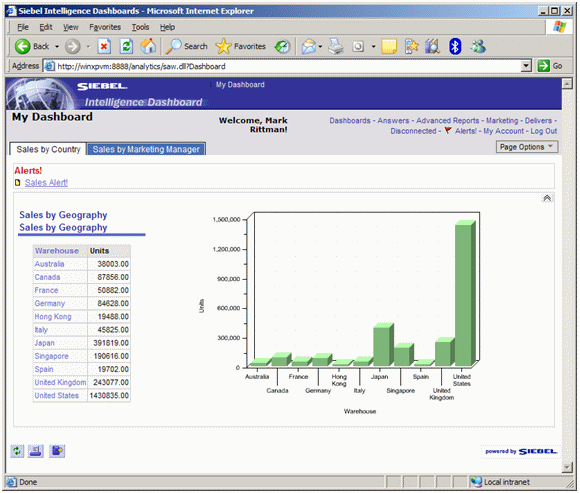
Then, after waiting for the iBot to start up, I check back on my dashboard page, and yes, the alert is there, just under the tabs and also up on the top right-hand side of the page, along with the other Siebel Analytics application names:
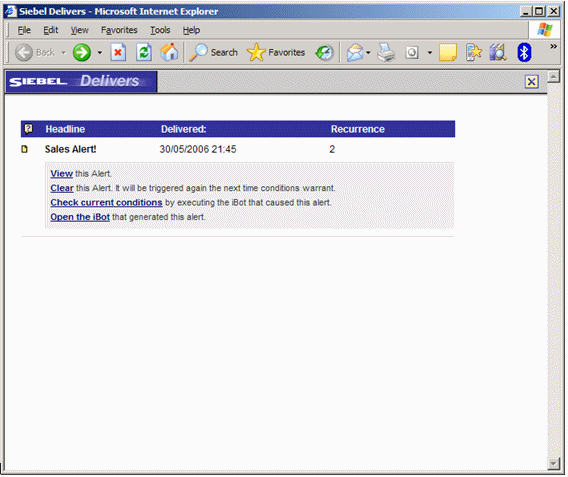
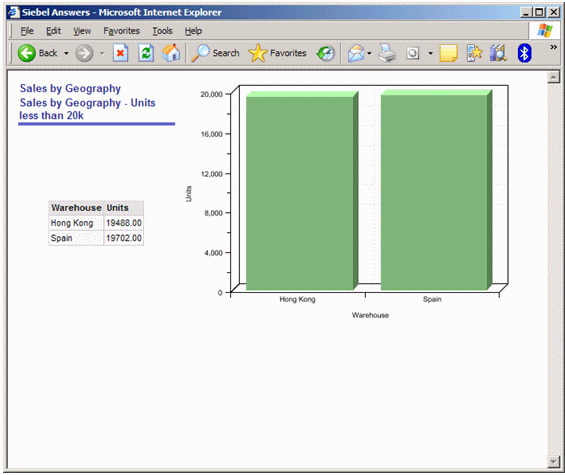
When I click on the alert, I first get a page that lists out all of my current alerts, and then when I click on one, I can see the figures that triggered the iBot.
If I'd got a mail server set up, I could have delivered the alert as an email, but for the time being, this will do. It wasn't all that difficult to set up (once you've gone through the scheduler configuration process) and as long as you've got the reports on hand on which to base the alerts, it doesn't take all that long to get up and running.