Adding Parameter Drop-Downs To OracleBI Dashboards
In this next series of postings, I'm going to go through some of the more advanced features of OracleBI Answers and OracleBI Interactive Dashboards, and look at:
- Adding a control to a dashboard page that passes a parameter value to the reports that are embedded within it;
- Creating a view selector, so that users can switch between different views of the data within a report;
- Creating a column selector so that users can choose which measure to view in a crosstab;
- Configuring a report within a dashboard to drill in place, rather than launching out to a new Web page;
- Drilling from one report to another, and
- Using the guided analytics feature to display links to reports and dashboards based on an OracleBI Delivers alert.
Thanks to Bas Roelands from Oracle Netherlands for passing on these tips at the end of the Netherlands BI seminar.
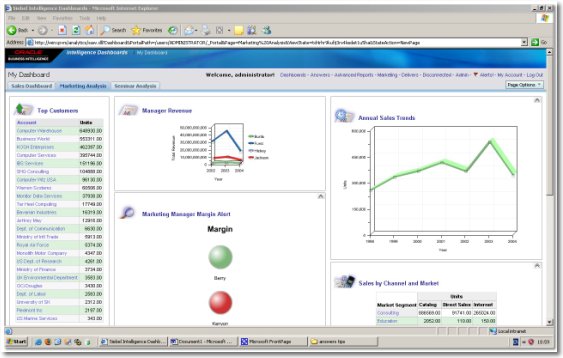
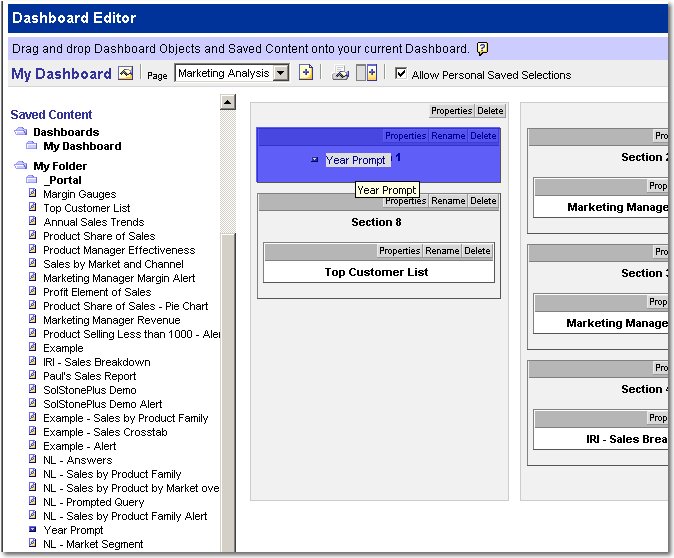
For the first tip, I'm going to start off with a dashboard page with a number of reports on it. Currently, these reports are for all years, but I'd like to add a drop-down list to the top of the report that allows me to view the reports for a particular year. Here's what the dashboard looks like at the moment.
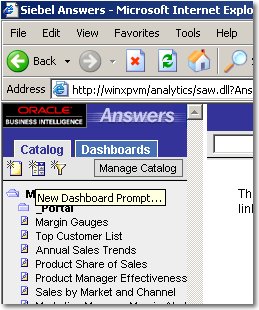
To add the drop-down list, the first thing I do is switch over to Answers and then, in the Catalog view on the left-hand side of the page, press the "New Dashboard Prompt" button to create a new dashboard prompt (it's the middle button in the screenshot), like this:
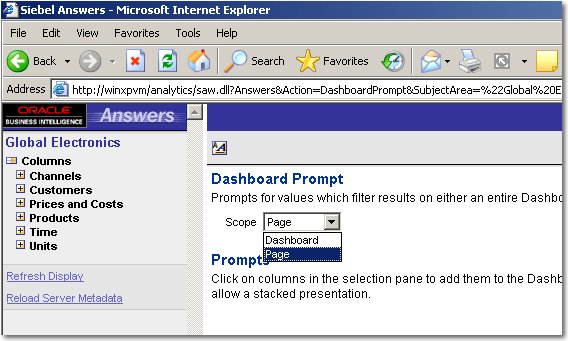
I then select Global Electronics as my subject area from the pop-up dialog, and on the next page, define the scope of my prompt as just being the dashboard page, not the whole dashboard.
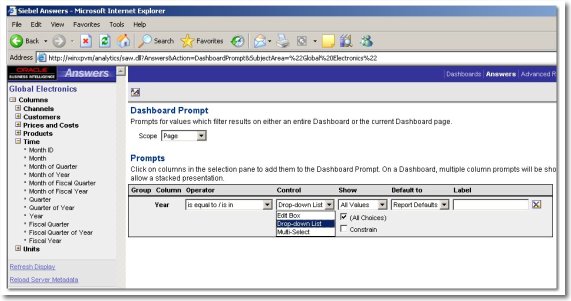
Then, using the list of available tables and columns on the left-hand side, I pick the column that I want to use with the prompt - in my case, "Year".
I then save the dashboard prompt, and call it "Year Prompt".
Now, I need to include the prompt on my dashboard. I go back over to the dashboard application, make some space for the prompt and then drag it, from the catalog, on to the dashboard page.
Now, when I save the dashboard and view the page again, the control is added - but at this stage it won't affect any of the reports.
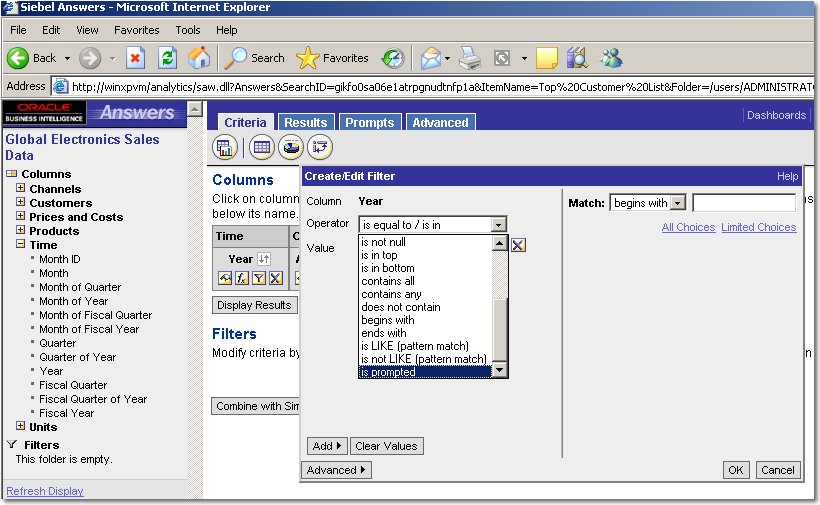
To get the reports to respond to the Year prompt, I have to add filters in to each of them. I'll start off by amending the Top Customer report just below it.
After I bring up the report in Answers, I add a column for Year, and add a filter on it using the value "is prompted". This picks up on the value in the dashboard prompt.
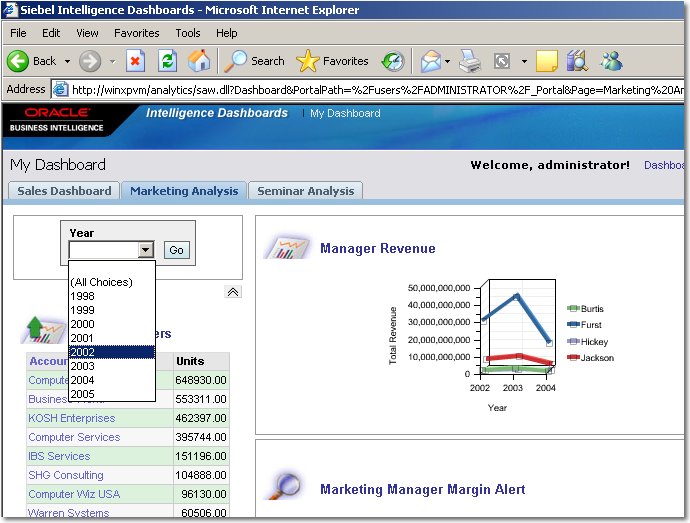
Now, when I go back to the dashboard and use the drop-down list, the values in the report change to reflect the year I select.
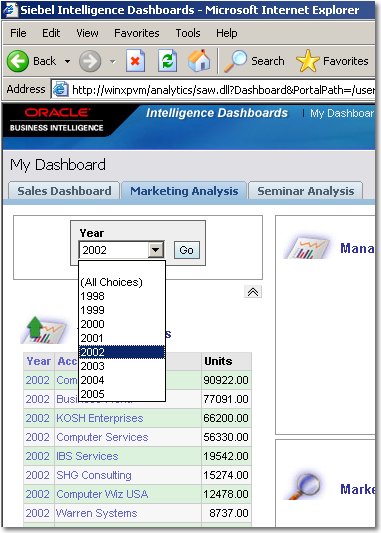
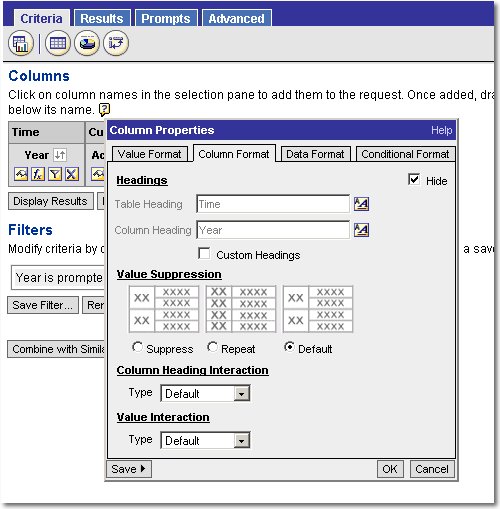
Finally, now I know it's working, I go back to the request and hide the year column so that it's not displayed in the dashboard.
Next, I want to change the Manager Revenue report that currently displays a line graph, to one where the user can select from several visualizations of the data. Currently, it looks like this:
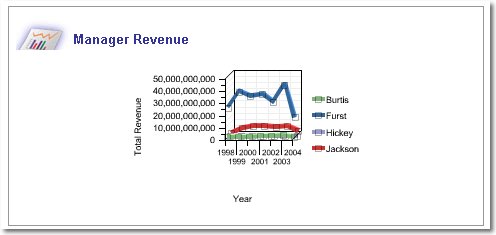
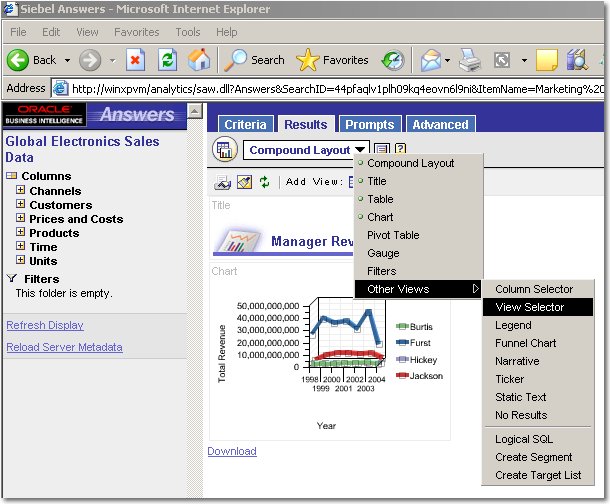
which is revenue per year broken down by marketing manager. What I'd like to do is add another drop-down box above the the graph, allowing the user to switch to a crosstab view of the data, or a bar chart. To do this, I go back into Answers and add another view to the request, a "View Selector".
Then, when defining the view selector, I select the various charts and the crosstab view that are associated with this request.
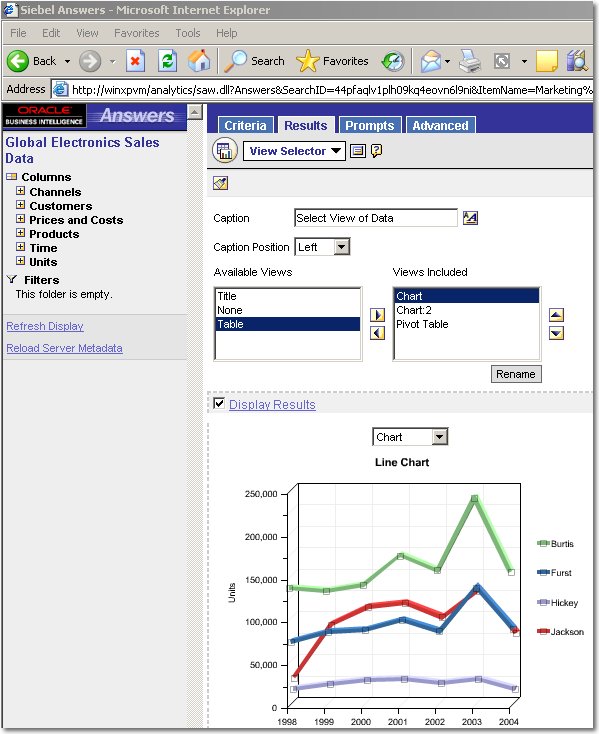
Now, I go back to the compound view and add this view selector in.
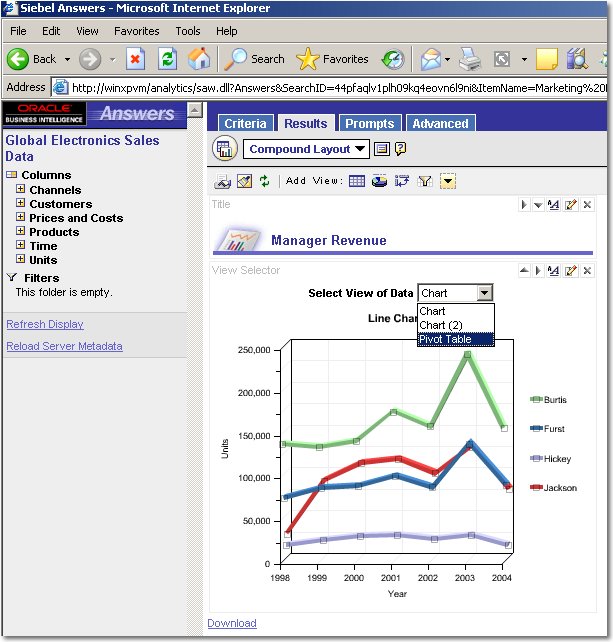
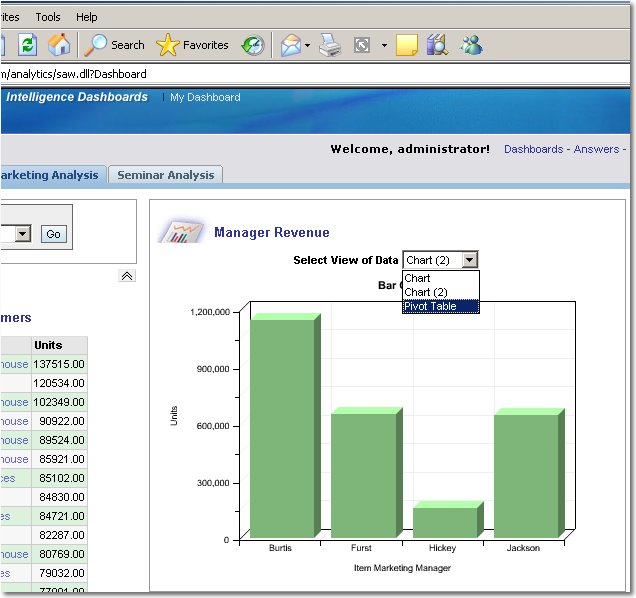
Now, when I go back to the dashboard, the Manager Revenue chart has a view selector above it, which allows me to switch between a line chart, a bar chart and a crosstab.
Tomorrow, I'll look at how guided analytics works with BI Suite Enterprise Edition.