Integrating Oracle OLAP and ApEx
A demo I've seen at several Oracle events over the past year is one where ApEx (Application Express) is linked in with Oracle OLAP. The idea is that the charting and reporting capability of ApEx is used against the SQL views over an Analytic Workspace, giving you the ease of development of ApEx combined with the fast access provided by Oracle OLAP multi-dimensional datatypes. I'd heard that Marty Gubar, one of the Oracle OLAP Product Management team, had put the demo together so I zipped over an email and Marty kindly send it over for me to take a look. As I'm holed up in a hotel in Cork running an OWB course for most of this week, I started pulling the demo apart to see how it worked, in case anyone else was interested in linking these two products together.
I'm using the 11g release of Oracle OLAP, although the technique should work with versions going back to 10g (and possibly 9iR2). It uses the SQL views access method, where data from an analytic workspace can be accessed through an SQL view that in turn makes use of the OLAP_TABLE, or in 11g CUBE_TABLE, table function. To take an example, a view over the customer dimension in the Global analytic workspace, when created using Oracle Database 11g, looks like this:
create view "CUSTOMER_SHIPMENTS_VIEW"
("DIM_KEY", "LEVEL_NAME", "LONG_DESCRIPTION",
"SHORT_DESCRIPTION", "PARENT", "TOTAL",
"CUSTOMER_TOTAL_ID", "REGION", "CUSTOMER_REGION_ID",
"WAREHOUSE", "CUSTOMER_WAREHOUSE_ID",
"SHIP_TO", "CUSTOMER_SHIP_TO_ID")
AS
  SELECT
    "DIM_KEY",
    "LEVEL_NAME",
    "LONG_DESCRIPTION",
    "SHORT_DESCRIPTION",
    "PARENT" /* ,
    "DEPTH" */,
    "TOTAL",
    "CUSTOMER_TOTAL_ID",
    "REGION",
    "CUSTOMER_REGION_ID",
    "WAREHOUSE",
    "CUSTOMER_WAREHOUSE_ID",
    "SHIP_TO",
    "CUSTOMER_SHIP_TO_ID"
  FROM TABLE(CUBE_TABLE('GLOBAL.CUSTOMER;SHIPMENTS') )
;
Once views like this are defined over the OLAP dimensions and cube, you can get to the data in the cube using SQL queries like this:
select
  cu.long_description customer,
  cu.dim_key customer_key,
  cu.parent customer_parent,
  round(f.profit_rank_cust_sh_paren,0) prof_cust_rank_parent,
  round(f.profit_share_cust_sh_pare,1) prof_cust_sh_parent,
  round(f.profit_share_cust_sh_tota,1) prof_cust_sh_level,
  round(f.profit,0) profit,
  round(f.gross_margin,1) gross_margin
FROM time_calendar_view t,
 product_primary_view p,
 customer_shipments_view cu,
 channel_primary_view ch,
 units_cube_view f
WHERE t.level_name = 'CALENDAR_YEAR'
 AND t.calendar_year = 'CY2006'
 AND p.dim_key = 'TOTAL'
 AND cu.parent = 'TOTAL'
 AND ch.dim_key = 'TOTAL'
 AND  t.dim_key = f.time
 AND  p.dim_key = f.product
 AND  cu.dim_key = f.customer
 AND  ch.dim_key = f.channel
If you use these queries in conjunction with ApEx, you can start to put together reports and flash charts based off just a SELECT statement and a few button presses:
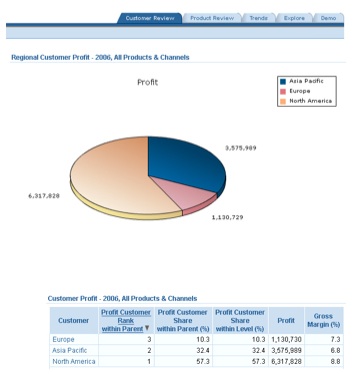
Moreover, you can turn any of the dimension member names and attributes into hyperlinks, and quickly putting a drill feature in place that lets users drill down the hierarchy to explore the data set.
So, how do you create these reports in ApEx, how do you put the SQL together and how do you put the drilling in place. After pulling the application apart and a few email exchanges with Marty, here's how it works.
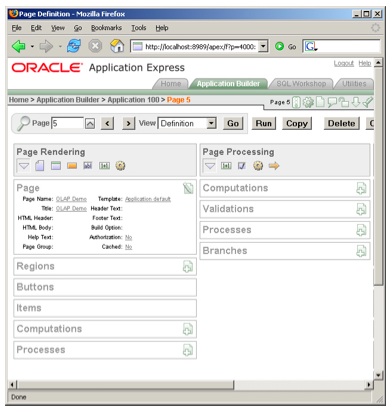
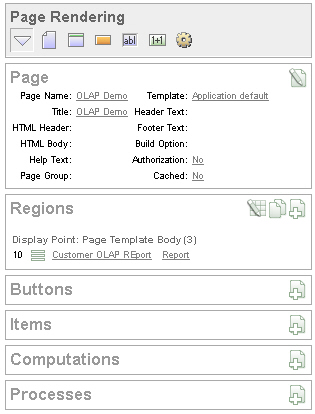
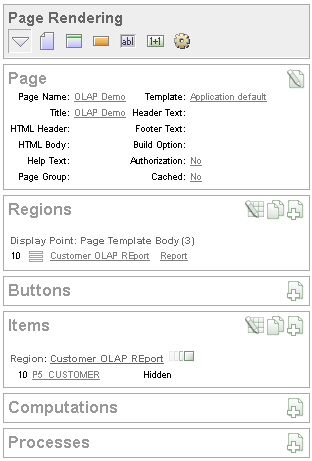
Within ApEx, I took the demo put together previously and within the application created a new page component. I selected "Blank Page" as the page type, accepted the page number ("5") and gave it an alias "olap_demo". I then named the page "OLAP Demo" and added it to the existing tab set. After allowing ApEx to create the new page, I'm presented with the follow page edit screen.
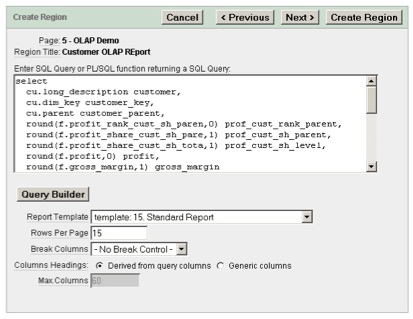
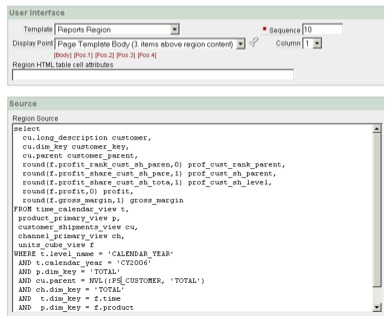
I now create a new Region, and make it of type Report / SQL Report. I give the report the name "Customer OLAP Report" and enter the SELECT statement above to generate the report data.
Once the region is created, I go back to the page editor and check the new page details. The new region I've just created, along with the report that I've added to it, is shown in the display.
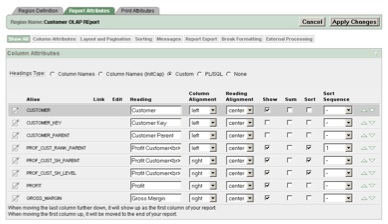
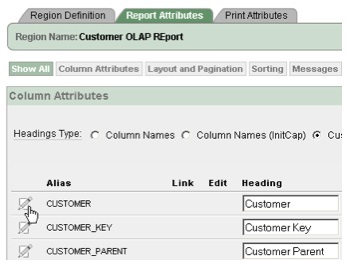
If I now go back into the report definition and click on the Report Attributes tab, I can fine-tune the display of the column names, orientate the headers and data either left or right, and - this is an important bit - hide the second and third columns in the report, "customer key" and "parent", as these will in fact be used for the drill-down navigation later.
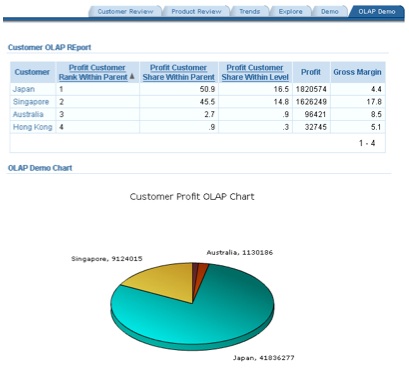
Now If I run the application and show the report, it looks like this:
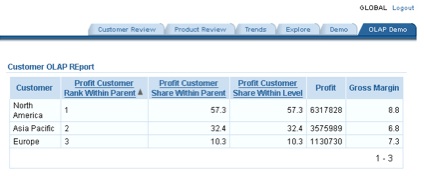
Not bad, the report layout looks nice and the results came back in an instant. So how do you add the ability to drill?
If you take a look back at the original SQL statement, one of the columns in the SELECT list is the "cu.dim_key" Customer Key (the key value for the dimension member in the OLAP cube)
select
  cu.long_description customer,
  cu.dim_key customer_key,
  cu.parent customer_parent,
...
Further on down the SELECT statement, we filter on the "cu.parent" parent ID, with the filter currently set to to "TOTAL", meaning that in it's current form the query will return all customer dimension members whose parent is total, i.e. the customers just down from the top level, which in our case are the three regions North America, Asia Pacific and Europe - this "selection via a hierarchy" is one of the key benefits of working with a dimensional model.
The next step in making the report drillable though is to turn the first column, the customer name (which may in fact be a customer, or a country, or a region) into a hyperlink that passes the customer ID back to the report and filters the parent ID on this value, rather than "Total". This way, when you click on the link it'll drill down the report, each time filtering the report on the customer that has been selected and actually showing the customers that are the "children" of the selected one.
To do this, I first go back into the page definition and create a new item. I select type "Hidden" and call it P5_CUSTOMER (the page number is 5, hence the name)
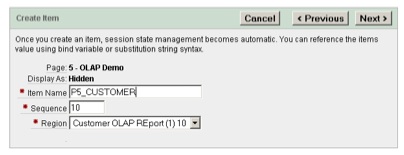
This item is going to hold the value of the customer that's been clicked on. The page definition now looks like this:
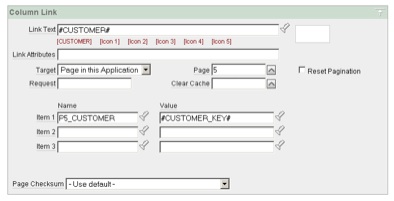
To populate the item at click time, I go back to the report definition, click on the Report Attributes column, and click on the Customer column to define the link it's going to use.
I then define the link as displaying the name of the customer (which again, might be a region, or a country, or a customer), and when clicked, passes the value of the Customer Key to the P5_CUSTOMER item that I've just defined, and navigates to the same page in the application.
Now I go back to the SELECT statement, and alter the parent ID filter so that it filters on this item value, if it's present:
select
  cu.long_description customer,
  cu.dim_key customer_key,
  cu.parent customer_parent,
  round(f.profit_rank_cust_sh_paren,0) prof_cust_rank_parent,
  round(f.profit_share_cust_sh_pare,1) prof_cust_sh_parent,
  round(f.profit_share_cust_sh_tota,1) prof_cust_sh_level,
  round(f.profit,0) profit,
  round(f.gross_margin,1) gross_margin
FROM time_calendar_view t,
 product_primary_view p,
 customer_shipments_view cu,
 channel_primary_view ch,
 units_cube_view f
WHERE t.level_name = 'CALENDAR_YEAR'
 AND t.calendar_year = 'CY2006'
 AND p.dim_key = 'TOTAL'
 AND cu.parent = NVL(:P5_CUSTOMER, 'TOTAL')
 AND ch.dim_key = 'TOTAL'
 AND  t.dim_key = f.time
 AND  p.dim_key = f.product
 AND  cu.dim_key = f.customer
 AND  ch.dim_key = f.channel
Notice the NVL(:P5_CUSTOMER, 'TOTAL') bit - this applies the value in the P5_CUSTOMER item to the parent ID filter if it's present, otherwise it uses the value "TOTAL" which will lead to the three high-level regions being displayed by default.
Now when I display the report again, the customer column has a hyperlink:
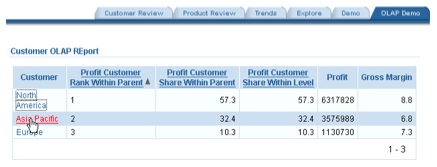
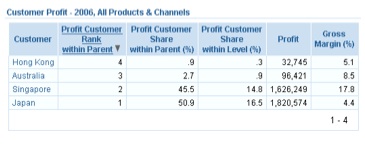
When I click one of the linked customers, the report refreshes to show the customers (in this case, countries) below this customer (which is in fact a region).
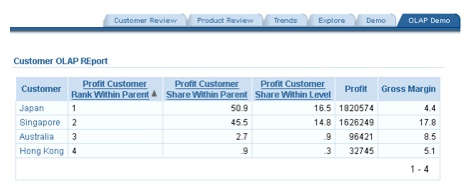
All of this, again, is lightening fast, and all through a simple SELECT statement with a filter on the parent ID of each customer, plus filters on the other dimensions, allowing us to quickly drill down a customer hierarchy.
So what about the flash charts then? Well this is pretty straightforward, and I start off by adding another region to the page, this time of type Chart / Flash Chart.
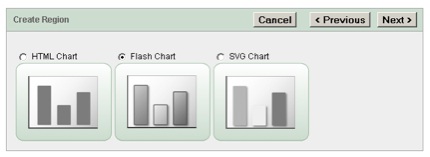
I then name the chart and then preview it, selecting 3D Bar Chart as the chart type.
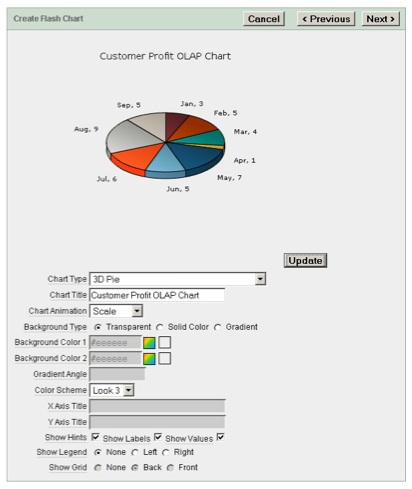
Then I type in the SQL statement on which the chart will be based:
SELECT
 null link,
 cu.long_description "Region",
 f.sales "Sales"
FROM time_calendar_view t,
 product_primary_view p,
 customer_shipments_view cu,
 channel_primary_view ch,
 units_cube_view f
WHERE t.level_name = 'CALENDAR_YEAR'
 AND t.calendar_year = 'CY2006'
 AND p.dim_key = 'TOTAL'
 AND cu.parent = NVL(:P5_CUSTOMER,'TOTAL')
 AND ch.dim_key = 'TOTAL'
 AND t.dim_key = f.time
 AND p.dim_key = f.product
 AND cu.dim_key = f.customer
 AND ch.dim_key = f.channel;
Notice how I'm filtering again on the :P5_CUSTOMER item, so that the chart will show the profit breakdown of customer dimension member that's been selected in the report, i.e. the report and chart are linked. Now, when I finally display the flash chart, together with the report, they're in sync and accessing data from the analytic workspace.
So, not a bad feature actually and one that was surprisingly easy to put together. It's one of the occasions where the SQL access feature in Oracle OLAP really comes through - a traditional SQL application like ApEx can get to the data in the OLAP cube really easily, and we're able to build an application in about half an hour that's got lightening fast response time and pretty good visuals. It's obviously not a replacement for a full ad-hoc query tool, or Oracle Dashboards, but for a canned set of reports with interactivity and graphing running against a pre-summarized OLAP cube containing a range of dimensional and time-series calculations, it's pretty impressive.