Taking a Look at ApEx 3.1 Interactive Reports
The latest copy of Oracle Magazine dropped through the door yesterday, and as I was looking through it last night I noticed an article on the new Interactive Reporting feature in ApEx 3.1. Ever on the lookout for new BI and reporting technologies, I downloaded the Apex 3.1 installer from OTN, copied it onto my laptop and installed it over my Oracle 11g ApEx installation on the train up to work.
I won't go into the full details of how you set an ApEx interactive report up, David Peake's article in the magazine does this very well, but I thought I'd give some though to how well this new feature works and whether it's a substitute for Discoverer, Oracle Reports or the reports in Oracle Portal.
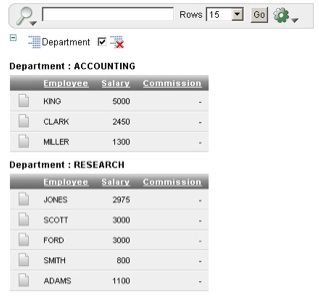
Taking a look at Interactive Reports first, once you've defined your report using a SELECT statement or by pointing to a table, ApEx displays the data for the end-user as a tabular list, like this:
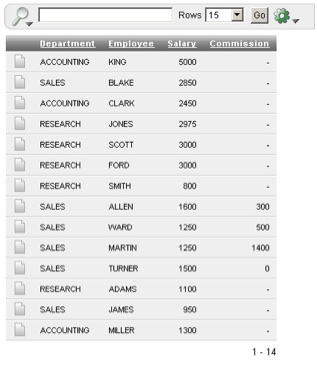
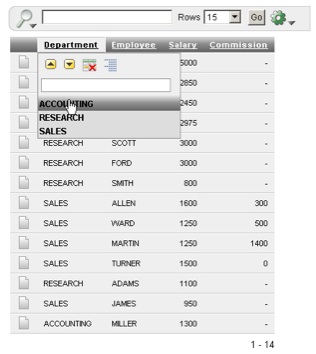
Clicking on any of the column headers brings up a list of actions: sort ascending, sort descending, control break, hide column, and filter on a value.
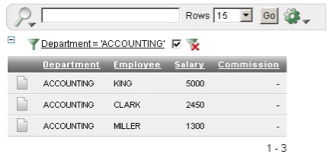
Selecting a filter value applies that filter to the report.
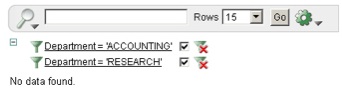
Strangely, selecting two filter values seems to filter on both of them being true and no data gets returned, I'd have expected this to be an OR rather than an AND.
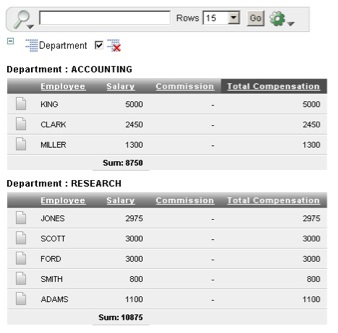
The Control Break feature splits the report up into sections, on for each value in the column that's been broken on.
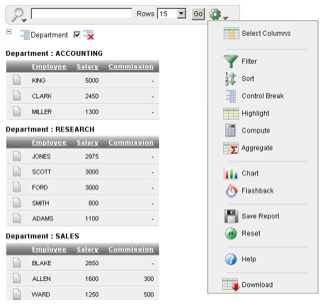
The Action Menu down the right-hand side brings up a number of functions, such as filter, aggregate, highlight (conditional format), chart and compute (calculate).
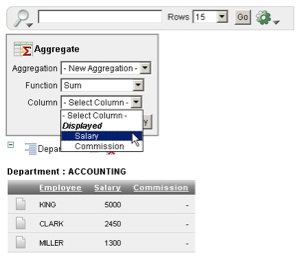
Aggregate lets you SUM, for example, all the values in a column.
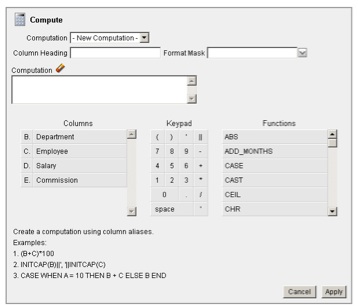
Compute lets you create a calculated column based on other columns in the report, and Oracle database functions.
Once you've added your aggregations and computations you can see the final result.
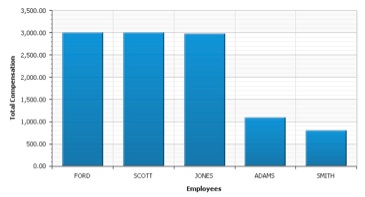
There's even a charting capability, with a fairly simple to use dialog for creating bar, line and pie charts.
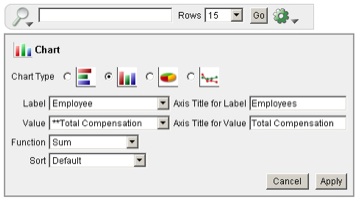
The charts themselves don't look too bad either.
I covered some of the charting and dashboard capabilities in ApEx back towards the end of last year, in this article on Oracle OLAP and ApEx. So is ApEx a viable alternative to Discoverer, Portal or BI Publisher for those customers who want to do some reporting and dashboarding?
Well it's certainly an option for those customers who have a couple of developers willing roll their sleeves up an learn ApEx. If you've not got the budget for a full BI tool, but you've got some developers or a DBA who can put some SELECT statements together and run through ApEx's report building wizards, then you can certainly put something together that looks smart, and in the case of ApEx 3.1, gives users a degree of interactivity too. Using ApEx's controls, you can add drop-down menus, radio button menus and so forth and tie them to multiple reports and chart, and you can create multi-tabbed dashboard pages in much the same way as with Oracle Portal.
What you do lose though is the ability for end-users to develop their own reports and dashboards, but if you're happy for these to be put together and maintained by your development team (which, let's face it, is how most smaller organizations work anyway) then ApEx is quite a neat environment, and it has the advantage of keeping your architecture simple (it all runs through the database, in 11g you don't even need a standalone Apache server) and lets you re-use your Oracle database and PL/SQL skills.