Taking a Look at Hyperion Web Analysis
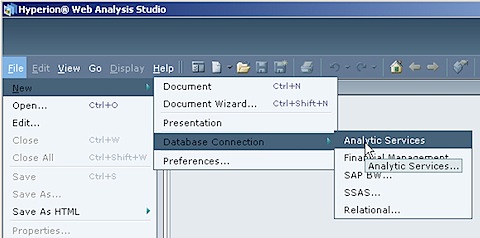
Whilst Oracle BI Answers is a pretty good ad-hoc query tool, it's not really an OLAP tool and Oracle's current recommendation if you want that sort of thing is to use Hyperion Web Analysis, which comes bundled with the latest version of OBIEE, OBIEE "Plus". Hyperion Web Analysis connects to Essbase, Microsoft Analysis Services and SAP B/W, generates MDX statements and provides a proper OLAP-style multi-dimensional query environment. So how does it work? I generated an Essbase cube off of the data warehouse I built in my series of "future OBIEE architecture" postings the other week (here, here and here), installed WebAnalysis and gave it a test drive.
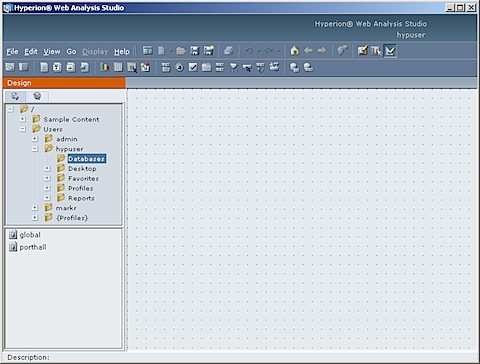
Web Analysis has a server element, which you install along with Essbase, Shared Services and the rest of the System 9 stack, and a client element which runs as a Java applet in your browser. I started up the Web Analysis Studio application and created a connection through to my Essbase cube.
Once my connection is defined, I can then start creating my report. I start off by creating a new document, which gives me a blank page and a set of controls and buttons to work with. This is called the "Document Designer" mode, and I can switch from this to the "Analyze" view and the "Desktop" view to view my data, once I've started laying it out.
If you look at the top of the screen, below the application menu, there's a series of buttons that let you add crosstabs, graphs and other data views to your report:
<div style="text-align: center;">
  <img src="/blog/content/images/2016/05/03112wa3.jpg" width="250" height="57" alt="wa3.jpg" />
</div>

<div style="text-align: center;">
  <br />
</div>

<div style="text-align: left;">
 <br /> There's also buttons to add controls (sliders, drop-down lists, radio buttons and the like) to your report - which makes Web Analysis a bit like a cross between Express Web Agent, Sales Analyzer and Express Objects, if you used these tools in the past.
</div>

<div style="text-align: left;">
  <br />

  <div style="text-align: center;">
    <img src="/blog/content/images/2016/05/03109wa4.jpg" width="394" height="54" alt="wa4.jpg" /><br />
  </div>

  <div style="text-align: left;">
    <br />
  </div>

  <div style="text-align: left;">
   <br /> A report (or "document") in Web Analysis can consist of a single crosstab or graph, or a set of crosstabs and graphs, optionally with buttons and menus to filter the data. You can even add "Save" buttons and other application-style controls to make it into a bit of an "Executive Information System", if that's your bag.
  </div>

  <div style="text-align: left;">
    <br />
  </div>

  <div style="text-align: left;">
   <br /> To add a crosstab to the document, you click on the Spreadsheet button and drag it onto the page. A dialog then comes up prompting you to select an existing data source (if you've already added other data to your document) or to create a new one.
  </div>

  <div style="text-align: left;">
    <br />

    <div style="text-align: center;">
      <img src="/blog/content/images/2016/05/03111wa5.jpg" width="480" height="361" alt="wa5.jpg" /><br />
    </div>

    <div style="text-align: center;">
      <br />
    </div>

    <div style="text-align: center;">
      <br />
    </div>

    <div style="text-align: left;">
      <br />
    </div>

    <div style="text-align: left;">
      <br />If you add a new data source, you get prompted to pick one of your database (Essbase) connections, and once you do so, a classic OLAP-style crosstab builder dialog is shown that prompts to you select dimensions and measures for your crosstab.
    </div>

    <div style="text-align: left;">
      <br />

      <div style="text-align: center;">
        <img src="/blog/content/images/2016/05/03108wa6.jpg" width="480" height="360" alt="wa6.jpg" /><br />
      </div>

      <div style="text-align: center;">
        <br />
      </div>

      <div style="text-align: center;">
        <br />
      </div>

      <div style="text-align: left;">
        <br />
      </div>

      <div style="text-align: left;">
      <br />  When you drop a dimension on to the rows or columns area, you are prompted to make your dimension member selection, in pretty much the same way as Discoverer for OLAP, Oracle Sales Analyzer and the like.
      </div>

      <div style="text-align: left;">
        <br />

        <div style="text-align: center;">
          <img src="/blog/content/images/2016/05/03110wa7.jpg" width="480" height="363" alt="wa7.jpg" /><br />
        </div>

                  <div style="text-align: left;">
         <br /> You can select the measures you want to see by repeating this process for the Accounts dimension, which lists out all the measures in your cube.
        </div>

        <div style="text-align: left;">
          <br />

          <div style="text-align: center;">
            <img src="/blog/content/images/2016/05/03105wa8.jpg" width="480" height="363" alt="wa8.jpg" /><br />
          </div>

          <div style="text-align: center;">
            <br />
          </div>

          <div style="text-align: center;">
            <br />
          </div>

          <div style="text-align: left;">
            <br />
          </div>

          <div style="text-align: left;">
         <br />   The "Options" button at the bottom of the dialog lets you filter the dimension members, select just the top and bottom N, like you can do in Discoverer Plus OLAP (though not as nicely as Discoverer does).
          </div>

          <div style="text-align: left;">
            <br />
          </div>

          <div style="text-align: left;">
            <br />

            <div style="text-align: center;">
              <img src="/blog/content/images/2016/05/03103wa9.jpg" width="446" height="235" alt="wa9.jpg" />
            </div>

            <div style="text-align: center;">
              <br />
            </div>

            <div style="text-align: center;">
              <br />
            </div>

            <div style="text-align: left;">
              <br />
            </div>

            <div style="text-align: left;">
           <br />   Once you finish selecting the dimension members and measures, the crosstab is displayed on the page (document), with controls so that you can move it around, resize it and so on.
            </div>

            <div style="text-align: left;">
              <br />

              <div style="text-align: center;">
                <img src="/blog/content/images/2016/05/03102wa10.jpg" width="480" height="364" alt="wa10.jpg" /><br />
              </div>

              <div style="text-align: center;">
                <br />
              </div>

              <div style="text-align: center;">
                <br />
              </div>

              <div style="text-align: left;">
                <br />
              </div>

              <div style="text-align: left;">
               <br /> I then repeat the process to add another crosstab, and a bar and pie chart.
              </div>

              <div style="text-align: left;">
                <br />

                <div style="text-align: center;">
                  <img src="/blog/content/images/2016/05/03101wa11.jpg" width="480" height="355" alt="wa11.jpg" /><br />
                </div>

                <div style="text-align: center;">
                  <br />
                </div>

                <div style="text-align: center;">
                  <br />
                </div>

                <div style="text-align: left;">
                  <br />
                </div>

                <div style="text-align: left;">
              <br />    The buttons, sliders, radio buttons and so on at the top of the screen allows users to modify the dimension member selection (including measures, which are part of the Accounts dimension) for a given report data source. I add a set of tickboxes to the first report to allow users to select which company types are included in the crosstab.
                </div>

                <div style="text-align: left;">
                  <br />

                  <div style="text-align: center;">
                    <img src="/blog/content/images/2016/05/0399wa12.jpg" width="480" height="352" alt="wa12.jpg" /><br />
                  </div>

                  <div style="text-align: center;">
                    <br />
                  </div>

                  <div style="text-align: center;">
                    <br />
                  </div>

                  <div style="text-align: left;">
                    <br />
                  </div>

                  <div style="text-align: left;">
                  <br />  Then when I add it to the document, users can interact with the data and make dimension member selections. I repeat the process and add a slider for years, and a drop-down list for measures, and then switch to the Analyze view to see the results.<br />
                  </div>

                  <div style="text-align: left;">
                    <div style="text-align: center;">
                      <br />
                    </div>

                    <div style="text-align: center;">
                      <br /><img src="/blog/content/images/2016/05/03100wa131.jpg" width="480" height="388" alt="wa13.jpg" />
                    </div>


                  <div style="text-align: left;">
                  <br />  So there you go, an OLAP alternative to Answers that also comes as part of OBIEE. You should - in theory - be able to populate your Essbase cube directly from the OBIEE logical model using the OBIEE ODBC Client, I say in theory because I couldn't get Essbase Integration Services to work with the OBIEE ODBC Client, see <a href="http://www.rittmanmead.com/blog/2008/03/30/on-the-train-to-oslo-issues-with-eis-and-obiee/">this post for details</a>, but in any case you can source the cube direct from your data warehouse if you've moved your data into this from the various source systems, as I did in my <a href="http://www.rittmanmead.com/blog/2008/03/17/migrating-obiee-logical-models-to-use-a-data-warehouse-part-3/">previous article</a>. If I manage to work out how to get EIS to work with the OBIEE ODBC Client (or if anyone knows, please add a comment to let me know what's going wrong) then I'll do a posting on that as well.
                  </div>

                  <div style="text-align: left;">
                    <br />
                  </div>

                  <div style="text-align: left;">
                  <br />  Anyway, apart from Web Analysis which is a thick-client Java application, you can also view your Web Analysis documents through Hyperion Workspace, which like OBIEE is purely DHTML. Here's how it looks with the above report displayed.
                  </div>

                  <div style="text-align: left;">
                    <br />

                    <div style="text-align: center;">
                      <img src="/blog/content/images/2016/05/0397wa141.jpg" width="480" height="307" alt="wa14.jpg" />
                    </div>

                    <div style="text-align: center;">
                      <br />
                    </div>

                    <div style="text-align: center;">
                      <br />
                    </div>

                    <div style="text-align: left;">
                      <br />
                    </div>

                    <div style="text-align: left;">
                    <br />  Not bad. The look is a bit "retro", but the key thing is that it is fast and functional - compared to Discoverer for OLAP and the rest of the Oracle tools written in Java, it's very very fast, which makes me think the problem was never Java, it was just how Oracle built their tools. The thin-client Workspace application is pretty good as well, you can't lay out reports using it (I don't think) but it's quite a nice "all in one" BI environment, I've seen screenshots as well of OBIEE dashboards also included in this workspace, so I guess this is one way the two toolsets will be integrated prior to the grand unification that'll no doubt take place later in the 11g timeframe. Anyway, that's it for now, got to iron a shirt for the <a href="http://www.rittmanmead.com/blog/2008/03/30/on-the-train-to-oslo-issues-with-eis-and-obiee/">Norwegian User Group event</a> tomorrow.<br />
                    </div>
                  </div>
                </div>
              </div>
            </div>
          </div>
        </div>
      </div>
    </div>
  </div>
</div>