Day One of An OBIEE Project : Data Modeling
Yesterday I mentioned that I was working this week on an OBIEE proof of concept, I said at the time that I'd make some notes on how the project went and the methodology I used to pull the system together. As I obviously can't write about the actual client or system I built, I'll use the example of a university BI system in the examples and you can apply this back to your own particular situation.
The work I'm doing was originally planned as two phases;
- An initial phase to put the OBIEE data model together, and
- A phase where the reports and dashboards were generated.
I turned up at 9am and had the initial meeting with the client, after that I was given the following:
- A set of database diagrams showing the main areas of the application schema.
- A login to the database, and SQL Developer to query the tables, view the schema and so on
- Some example reports that they currently produce using Excel
- Access to the business analyst and application designers to answer my questions and add a bit of context.
- OBIEE installed and configured and ready to work with.
Now that I was confident the software was set up correctly, I took some time out to discuss with the client the area we'd be reporting on (for the purposes of the example, the student registry at a university), and tried to identify the main business processes that made up their part of the organization. OBIEE needs the logical (or business) data model it works on to be a dimensional star schema (fact tables surrounded by dimension tables), and so through doing this I was trying to establish the facts (which generally are based on business processes, like students applying, offers being made, students being admitted, grades being published, courses being attended and so on) and the dimensions (the "actors" and "products" in the business process, in this case students, courses, faculties, sites, periods and so on), with the dimensions then being used to analyze the fact tables. All of this is actually all basic dimensional modeling, it's not specific to OBIEE, and the deliverable out of this part of the work is a conceptual dimensional model that shows the flow of data from one end of the business process to the other.
Once I carried out the first interviews, I logged on to SQL Developer and exported a list of the tables in the source schema into a text file, which I then cut and pasted in to Excel. I then went through the table list and categorized each of them into candidate fact tables, and candidate dimension tables. As a general guide, candidate fact tables generally contained transactional information (student admissions, the qualifications that students stated on their applications, the offers that were made, the various documents that were sent out during the application process) whilst dimensions contained the lookup or reference information that generally joined to the transaction tables. In most cases, information on students, say, was split over several tables (student_details, student_type, student_address and so on), when we come to use these tables in OBIEE we'll need to denormalize them in to a single logical dimension table.
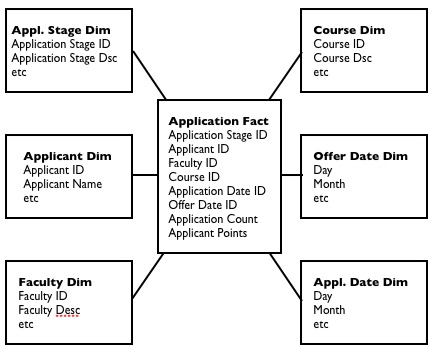
At the end of this exercise, I had a list of candidate fact and dimension tables, which I then matched back to the notes I made when I spoke to the business analyst. This then gave me my initial fact and dimension tables that I would build in OBIEE BI Administrator, some of which would map one-to-one with the source tables, some of which would be a combination (denormalization) of several source tables. This, in a way, is the conceptual, theoretical dimensional model that represents the business and it's business processes, and could be used along with OBIEE to provide general ad-hoc reporting for the client's application. To take one example in particular, the candidate "applications" fact table contained a count of applications and the grades score of the applicant, and links through to a number of dimension tables including application status, which could be set to received, in processing, rejected, offer sent, in clearing and so on. A diagram of this fact and it's dimensions would look like this:
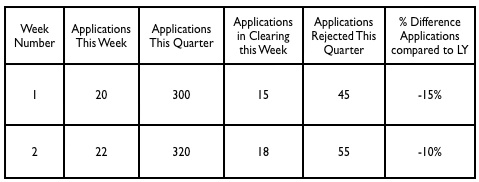
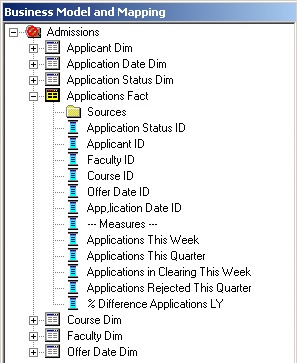
The way I've got around this on other OBIEE projects is firstly, to break out each measure by application status and have it listed in the logical fact table, and create additional measures that take your base measures and calculate it over specific time periods, such as month-to-date, year-to-date, year-on-year comparison, and so on. This has the drawback of "exploding" your fact table model from one or two measures to one per status and time period, but it gives you a particular column you can select for each combination of measure, period and status, with the complexity of populating them handled by SQL DECODES and the Time Series (AGO and TODATE) calculations you now get with OBIEE 10.1.3.2 onwards. What this all leads to is a logical model that looks something like this:
Anyway, as I said that's it for today. Tomorrow I'll be putting in place all the DECODES, time-series queries and so on and producing the first reports. After that I'll be building the logical model out, adding some additional fact tables and rounding off this stage of the logical model build.