One of the new features in Oracle Database 11g that I've been meaning to try out for a while now is the SQL Access Advisor, part of the 11g Tuning Pack. Given that one of Oracle's key product directions is to make administering the database as easy as, in the words of Dilbert, "one big button, and we press it for you in the factory" I thought It'd be interesting to see how far this automated tuning of database schemas has come, especially seeing as this latest 11g release of the feature now tunes and recommends indexes, materialized views and partitioning schemes.
To create a substantial enough workload with potential for improvement, I took a copy of the SH schema, removed all the constraints, indexes, materialized views and partitions, copied the SALES table into itself a few times so that it now had 147m rows, and then gathered statistics on the schema. I then when in to Oracle Business Intelligence Enterprise Edition and put together a selection of queries that aggregated data, filtered data on dimension attributes, time periods and so forth, and then copied the generated SQL statements into an SQL script so that I could run them on demand.
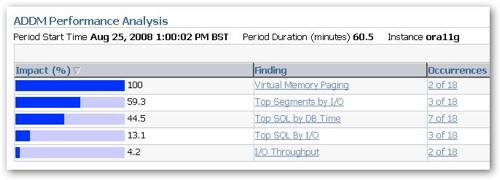
I'm now at the point where I've got some sample data and a set of SELECT statements that I want to improve the performance of. Taking a look at the 11g DBConsole application, there are a number of places where you can start to investigate the performance of your system. Starting at the front page, you can see a section on the ADDM Performance Analysis that shows, amongst other things, the top SQL statements by DB Time (response time) and by Disk I/O.
Selecting any of these SQL statements will present you with the option to run the SQL Tuning Advisor against them, which presents you with the original SQL statement, it's execution plan, and a selection of alternatives with their execution plan. For now though, I'm more interested in what recommendations the SQL Access Advisor makes for my cloned schema, which has no indexes, materialized views, constraints or anything defined within it.
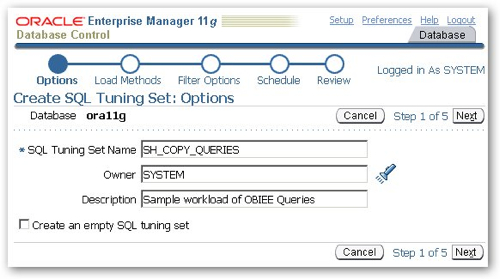
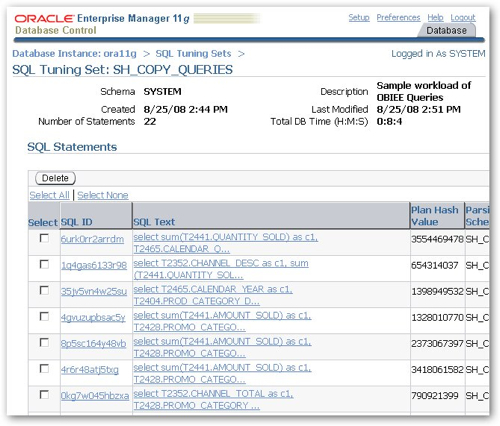
To perform the exercise I'm going to use another feature of the 11g DB Console, the ability to create SQL Tuning sets using a point and click interface, to capture a workload based on the SQL statements used by my queries. To do this I navigate to the Performance Screen and then the SQL Tuning Sets screen, and create a new SQL Tuning Set to hold the sample workload.
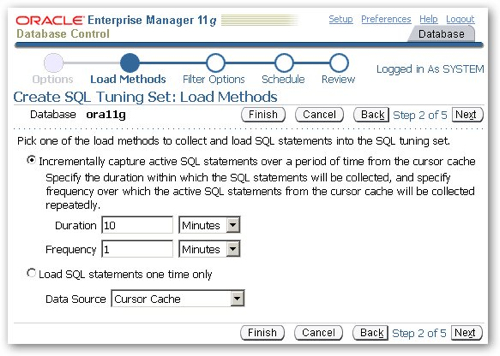
I then tell DBConsole to capture SQL statements for 10 minutes.
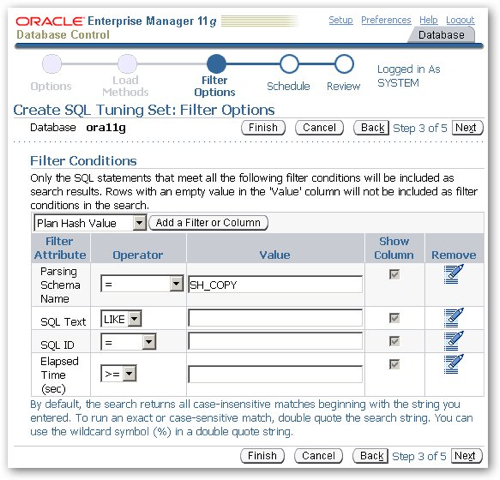
The SQL captured will be limited to the SH_COPY schema, so that I miss out all the background SQL generated from the database and from other sessions.
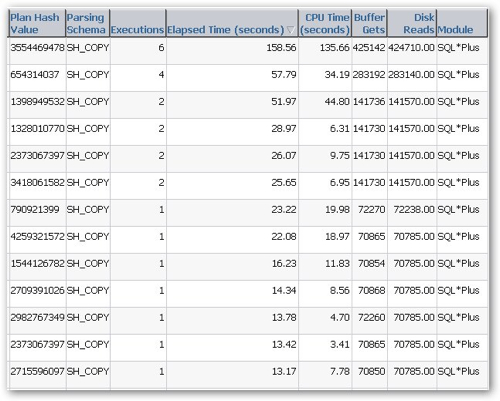
I then let the tuning set job run and execute my script from an SQL*Plus session to generate the workload. After 10 minutes, I return to the DBConsole job and check that a suitable number of long-running SQL statements have been captured in the SQL Tuning Set.
Taking a look at the buffer gets and elapsed time for the queries, there should be something to work with here.
So now that I've got an SQL Tuning set, the next step is to navigate to the SQL Performance Analyzer, which you can reach from the Advisor Central page on DBConsole.
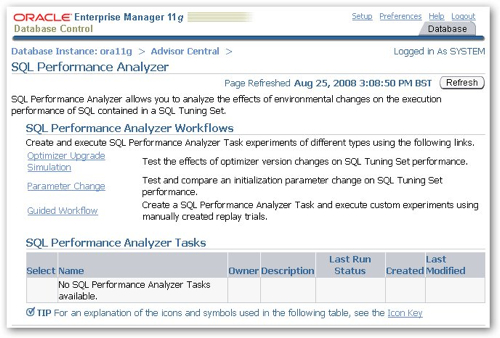
Now the idea with the SQL Performance Analyzer is that you can take a given workload (i.e. an SQL Tuning Set), run it to provide a baseline response time, then apply some changes (change database initialization parameters, create some indexes, rework the SQL statement) and then replay the same workload to assess the effect of the changes. It's nothing different to doing this all yourself but I thought I'd give this a try, to try and keep all of the process within the Enterprise Manager website.
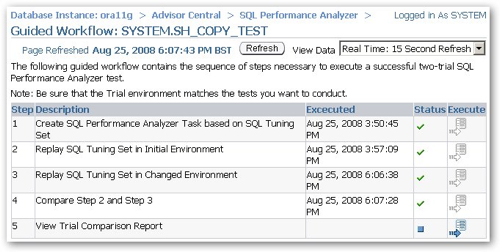
I click on the Guided Workflow link and am presented with the following workflow steps:
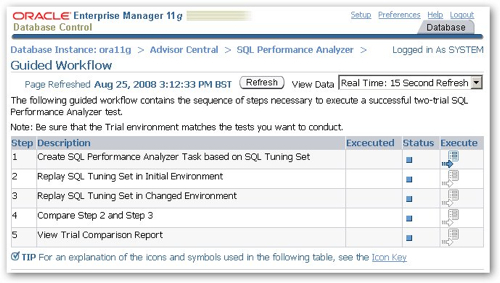
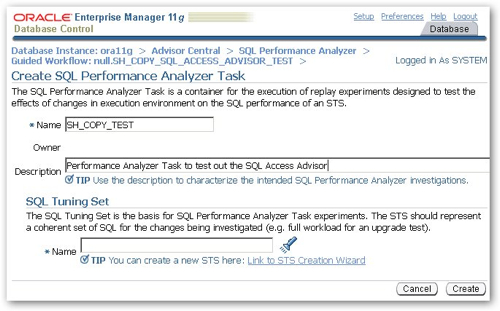
So the first step then is define the SQL Performance Analyzer Task, and select the SQL Tuning Set I just created to replay as my workload.
I now execute step two of the SQL Performance Analyzer workflow to replay the SQL Tuning Set to establish a baseline, before I run the first iteration of the SQL Access Advisor to recommend new indexes. Once this is complete, I navigate to the SQL Access Advisor and begin the process of using it to recommend indexes for my schema.
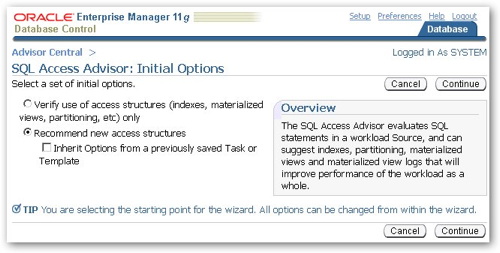
The first step in this process is to either choose to validate existing indexes, MVs and so on in a schema (this would be useful for the original SH schema), or in my case, to recommend some new ones.
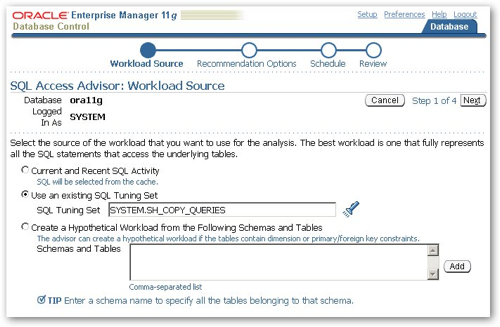
Once you select your advisor option, you can either base the recommendations on an SQL Tuning Set as I'm doing, whatever's in the SQL cache at the time (filtered by parsing schema, elapsed time and so on) or on the structure of the tables and dimension objects in one or more schemas. From my perspective it's better to create an SQL Tuning Set as you've got a defined, repeatable set of SQL statements then that you can use in different places, such as the SQL Performance Analyzer that I'm using to frame this tuning exercise.
On the next page of the wizard, I can select the schema structures that I want the advisor to recommend. In this instance I just select indexes on their own, although you can select all three - materialized views and partitions as well as indexes - if you want to recommend all of them at once.
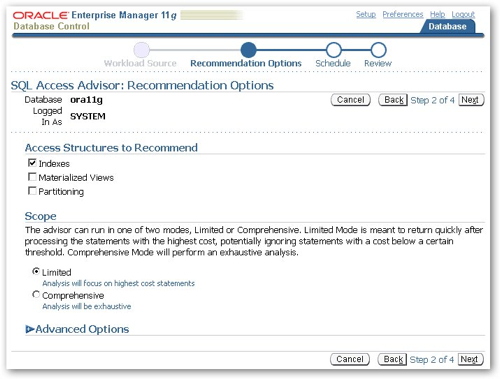
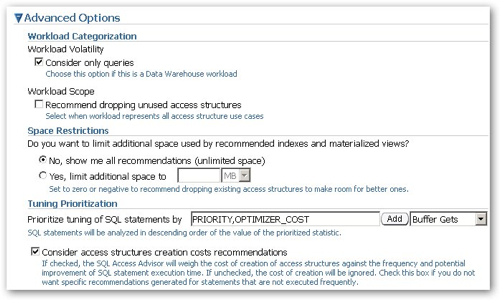
"Advanced" options allow you to tell the advisor to consider or disregard the cost of creating the indexes when it makes recommendations, whether to include recommendations around dropping unused indexes, and to place limits on the size of indexes, materialized views etc that it can recommend, and whether to only consider queries which makes sense of course in a data warehouse environment.
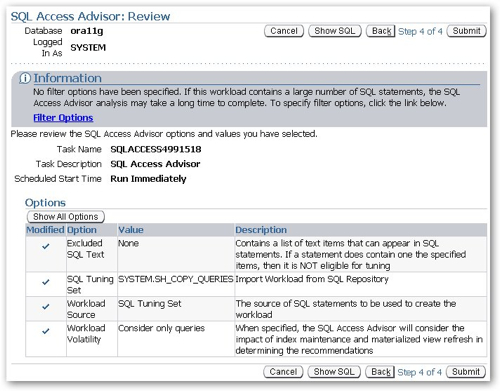
Then it's a case of telling DB Console when to run the advisor job - now, in my case - and then review the settings, before pressing the Submit button to run the analysis.
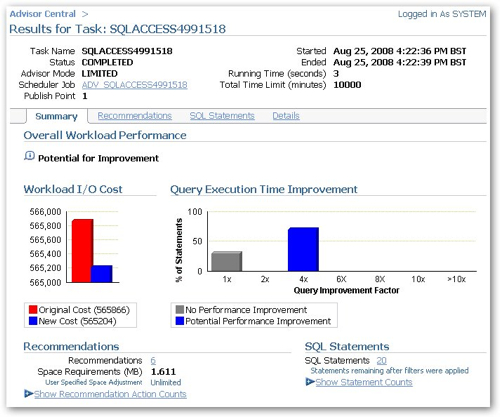
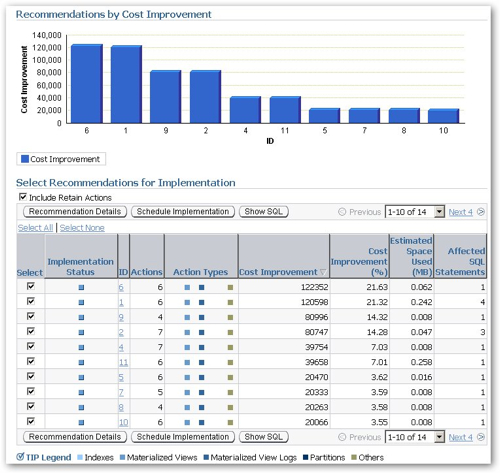
After waiting a few seconds, the analysis was ready. From the analysis overview, there are six index recommendations that bring down the overall workload marginally, which is about what I expected as most of the work being done by the OBIEE queries was summarization, not filtering.
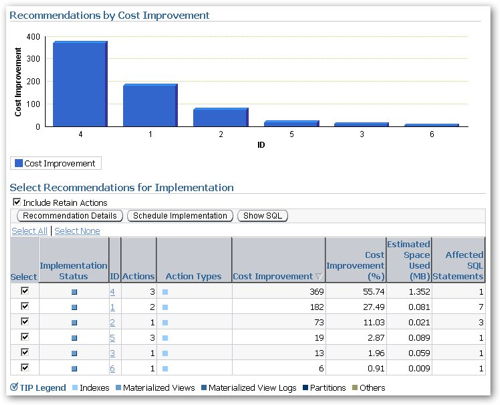
Taking a look at the recommendation details, you can see more details on the individual index recommendations. Notice the "Action Type" colour blobs - when you run the advisor asking it to recommend materialized views and partitioning strategies as well, you'll get additional colour blobs in there as well, depending on what objects have been recommended.
Looking at the top recommendation in more detail, I can see that it's recommended three B-tree indexes on the channels, products and customers tables, in order to improve the performance of one of the SQL statements.
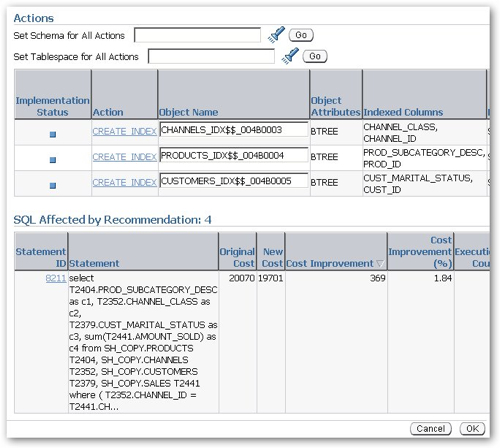
Recommending B-tree over Bitmap index is to me surprising, as typically in a data warehouse environment you'll want to use bitmap indexes when working with dimension attributes, firstly because they're typically smaller and faster to access (jn combination with other bitmap indexes) than B-tree indexes, and secondly because they're required for star transformations, although I have seen Oracle transform B-tree indexes to bitmap indexes on-the-fly so that star transformations can take place.
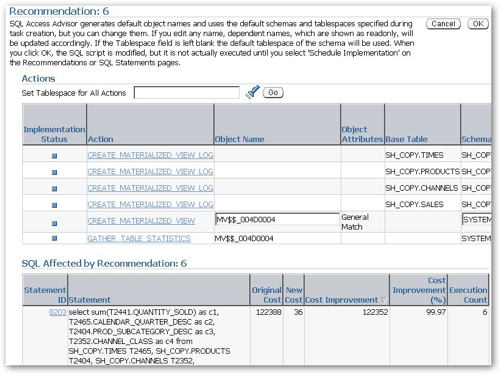
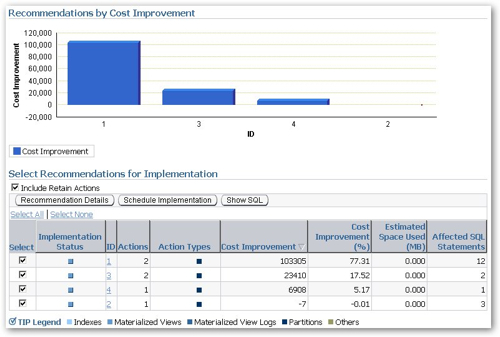
Running the SQL Access Advisor again, this time selecting Materialized Views as the recommendation type, generated a set of recommendations with a much bigger potential performance gain. Notice the colour blobs are now for materialized views, mv logs and "others", and that the expected performance gain is much bigger.
Taking a look at the top recommendation, it's for four materialized view logs, a fast refresh materialized view with query rewrite enabled, and a statistics gathering job to gather stats on the new materialized view. I was wondering if the "other" would be a dimension recommendation (as in CREATE DIMENSION) but it looks like this version of the SQL Access Advisor doesn't cover these yet.
Running the advisor a third time, this time for partitioning, brings up a set of recommendations that on the face of it look like some good timesavers.
However the actual recommendations themselves are a bit strange. The first one recommends hash partitioning the Sales fact table and the Times dimension table into 32 buckets, when I would have thought the more obvious recommendation would be to range partition the fact table on its date column, do the same to the time dimension and thereby permit partition-wise joins between the two.
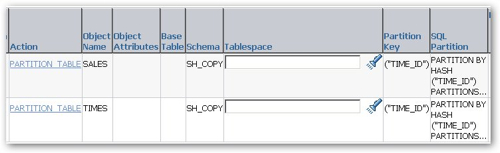
Of course this does bring up the other question as to how to partition a fact table when you have more than one date within it, say load date and transaction date, given that one will favour the ETL process (potentially allowing partition exchange loading) and one will favour queries (partition pruning), but I'm struggling to understand why it would recommend hash partitioning a fact table with a date datatype as one of the table columns.
The second recommendation was equally strange, with the Sales fact table again recommended for hash partitioning and the customers dimension table range partitioned, using the INTERVAL (automatic creation of new partitions as needed) feature.

I wonder if this lack of awareness of data warehousing standard practices is down to their being no constraints defined within the schema, therefore the SQL Access Advisor doesn't really know the relationship between the various tables? Once I've run the recommendations I'll add some constraints and see how the recommendations come out then.
I now go back and run the Advisor one more time, this time turning on all the options to recommend indexes, materialized views and partitions, so that I can make a selection between the various recommendations, assuming as I do that you're not meant to implement all of them (the partitioning one above illustrates this point, as it would partition the Sales fact table twice).
Looking at the projected performance improvement now, it's certainly (if it works) not something to be sniffed at.
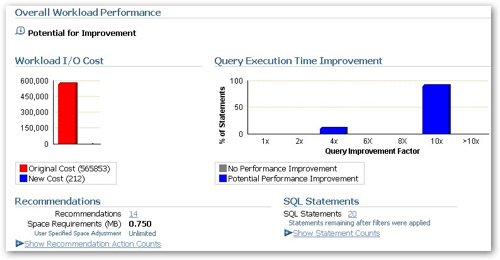
The projected cost of the various SQL queries in the workload has gone down from 565853 to 212, with most statements gaining a 100% query execution time improvement, and however you might query the advice it certainly does what it says on the tin, at least as far as the statements in my workload are concerned.
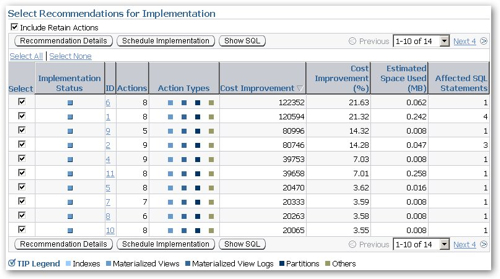
Looking at the total set of recommendations in detail, they all include elements of index creation, materialized view creation and partitioning changes, I also note that they're all selected which does seem to suggest that they should all be implemented together (or at least that it's alright to do so).
So, I leave all the changes selected and press the "Schedule Implementation" button, and then notice that (a) it won't schedule implementations that involve partitioning changes, you have to save the script and manually run it yourself, and (b) the materialized views and indexes that the script creates are being created in the SYSTEM account, not the account that the objects are in (SH_COPY), so I'll need to edit the script a bit so they're created in the correct place. I copy the advisor SQL output to Notepad, do a search and replace on SYSTEM, changing all values to SH_COPY, and then run the script from SQL*Plus. Once I did this (the script took about 10 minutes to run), I then returned to the SQL Performance Advisor and ran my second replay of the sample workload, followed by the comparison of the two workloads.
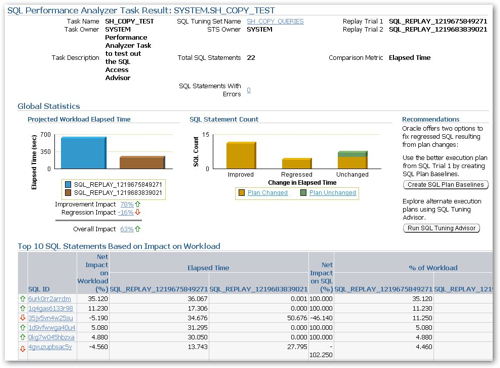
So, the $64,000 question - did the performance of the queries improve? Well, according to the SQL Performance Analyzer output, it improved by an overall 63%, with some queries gaining and some queries regressing. In defense of the results, a couple of statements failed to execute in the recommendations script because of formatting errors, but even so, it's not a bad result, albeit with a few weird partitioning recommendations.
Of course this is still a bit simplistic, as firstly I only gave the advisor a very small set of queries to advise against, and secondly the SH_COPY schema only has two fact tables and a bunch of dimension tables. Also, of course, none of this takes into account the ETL process which will make its own demands on the schema, its indexes, summaries and partitioning, and you'll most definately need to bear this in mind before changing around the performance structures in your warehouse (which is why, of course, you're still best contacting an experienced data warehouse implementor before going ahead with any of the bits of advice the SQL Access Advisor comes up with). Still, it's not bad as a way of automating much of the analysis that goes into tuning the structures in your warehouse, and I can certainly see a point in time in the future when the SQL access advisor takes into account a SQL Tuning Set to represent your ETL process, and recommends additional structures such as cube organized materialized views and index and storage variations such as compression and compressed b-tree indexes as appropriate.
So finally, what about the issue around hash partitions, and the B-tree indexes on the dimension tables. Will adding constraints to the schema lead to more sensible (in the context of data warehousing) recommendations? I then went on to add constraints to the sample schema, generate a new SQL Tuning Set and run the SQL Access Advisor again, and the result was - the same: hash partitioning was recommended for the fact table, B-tree indexes for the dimensions, which does seem to suggest that the SQL Access Advisor isn't too "data warehouse-aware", although my test case was limited and there could well be something I'm missing. Still, I'll be interested to see how this feature evolves as the various patches to 11gR1 and 11gR2 are released, it's certainly got the potential to be an interesting feature.