I'm currently back in Denmark running the first of my Oracle 11g Data Warehousing Masterclasses, today was the first day and I'm currently back in the hotel working through some material for tomorrow. One of the main demonstrations that I went through today was around using the SQL Access Advisor to recommend on indexes, materialized views and partitioning, and one of the comments that I got at the end was that it would be useful if I went through some of the other advisors available in Database Control.
To give this a run through then, and to put it in a data warehousing context, I came up with a couple of scenarios that I'd like to "tune".
-
We have a number of queries running against the SH schema, in one session serially, that we want to monitor and potentially tune.
-
I'll repeat the same process again, but run several sessions together all querying the SH schema, to see how well the advisors deal with memory, I/O and concurrency issues.
The idea here is that there are a number of advisors, graphs and other performance dashboard elements on the Performance page of Database Control that can be used by someone to work out what's going wrong with a data warehouse. I'm assuming here whoever's using it is not a hardcore database whizz and that they're looking to get some obvious pointers to what's going wrong, and how they might fix things.
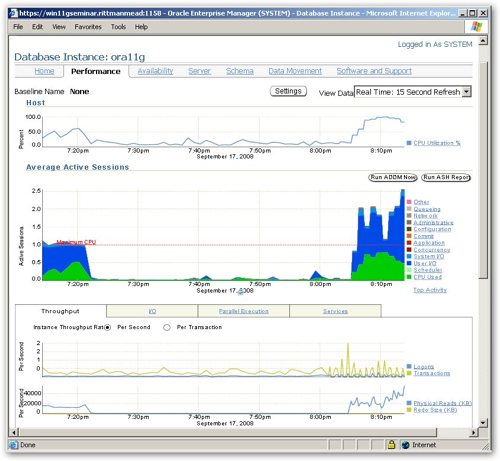
Taking a look at the Database Control page in question, here's what you get when you first take a look.
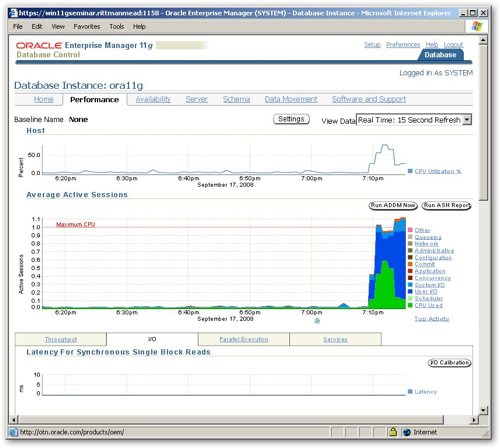
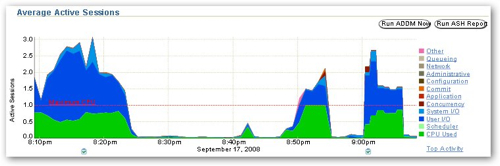
When I took this screenshot I was running a single session that was firing individual, serialized SELECT statements against the SH schema to the database, and you can see from the "Average Active Sessions" graph in the middle that this one session was generating a lot of user I/O wait events (the big blue part of the chart) and CPU wait events (this big green part of the chart). Looking at the graph above, which on Windows shows the CPU utilization and on Unix shows the run queue, I can see that the CPU was being hammered at around 60% for most of the period. So from looking at this, whilst running this set of SELECT statements the major things holding me back were lack of CPU and waiting for disk.
If I click on the User I/O part of the graph to drill into this particular wait event class, I can see what it's made up of direct path reads (presumably causes by sorts going to disk) and a very small amount of db file sequential reads, which is down to all the indexes that are being accessed by the queries. I'd make a note at this point to see whether I've sized my PGA correctly as these sorts being written and then read from disk might be down to the PGA_AGGREGATE_TARGET being set a bit too small.
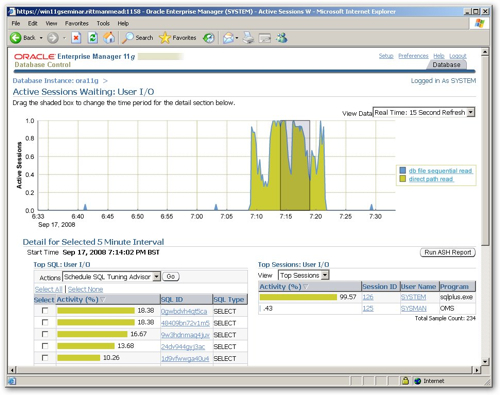
Staying on that page, I can see that the Active Session History that has captured these details is also listing out the top offenders for this wait class. Clicking on the top one, which accounted for 18.38% of the activity, I can examine it in more detail and see that it is indeed using an order by clause, causing the sorting, and I can also see the SQL itself and the execution plan that it's currently generating.
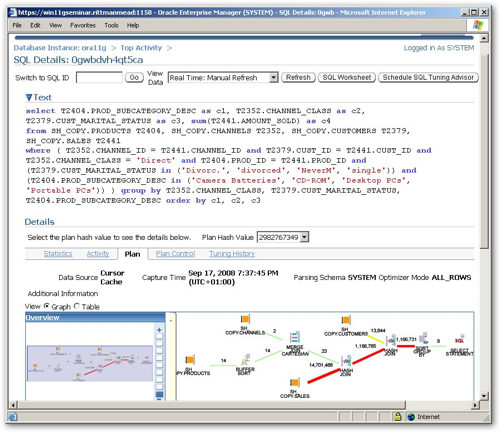
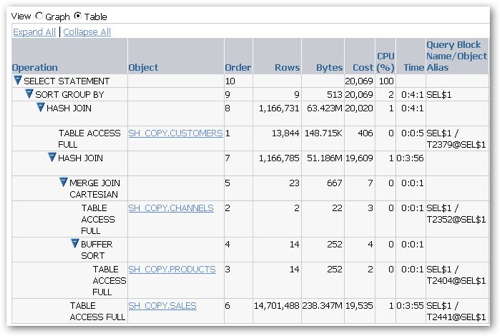
Now as the SQL itself is a fairly simple I can't really see much point in using the "Schedule SQL Tuning Advisor" button to generate some alternative versions of the query, but looking at the diagram of the explain plan below I notice that we've got something unusual going on, not something I'd normally expect to see in a star schema data warehouse query. Clicking the "Table" radio button I then take a look at the execution plan and notice that it doesn't appear to be using any indexes let alone a star transformation, which is strange, but then I remember that I'm running this against a copy of the SH schema where I don't think I've put any indexes or materialized views in place.
Going back to the original Performance Page, I press the Run ADDM Report button to generate an ADDM report against recent activity. Taking a look at the resulting report I can see the two period in which I'd been running my tests (just before 5pm, and just after 7pm), and within the ADDM Performance Analysis section I can see, ordered by priority, the issues that I should take a look at.
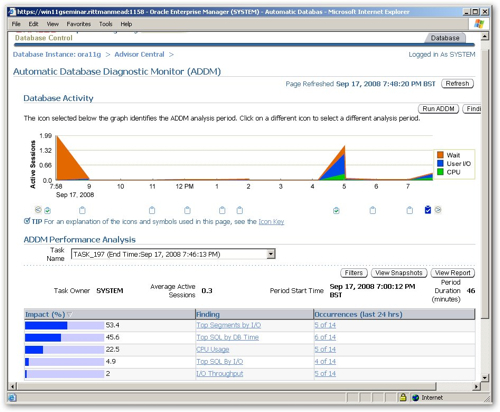
The topmost issue is "Top Segments by I/O", and if I click on the Finding link I see that my SH_COPY.SALES table is highlighted, with 19 full table scans recorded against it whereas I'd normally expect this to be accessed via bitmap indexes and a star transformation. So there's another clue then.
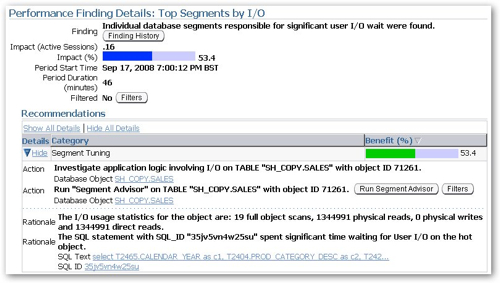
If I saw this coming up on a tuning report probably the first thing I would do is to try and see if I could access this segment (table) more efficiently, potentially creating some indexes, some materialized views to provide faster access to table aggregations, or partitioning the table so that full table scans only need to access portions of the table. Unfortunately the Segment Advisor that's available on the same page just recommends that I shrink the table to free up some space, I guess again this points to advisors such as these being more there to help automate the gathering of diagnostic data rather than going off an making the changes themselves. Anyway, back to the Performance page, and this time I'm going to run three sessions in parallel, all running SELECTs against the same tables.
From looking at the Active Average Session chart now, you can see the activity is now much greater than before, because I'm running three sessions in parallel (the fan on my laptop is whirring, as well). Now one thing I'm not sure about is the Maximum CPU line on this graph, it would seem to indicate that my concurrent processes are requiring around 2.5 CPUs to run as against the 1 that I've actually got available; also looking at the host chart above I can see that I'm maxing the CPU out at around 100%, which would be logical.
Scrolling down, there is another section with another set of reports, one of which tells DBConsole to display a Top Activity report (top SQL statement), another lists out blockers, and other one lets me create an SQL Tuning Set.
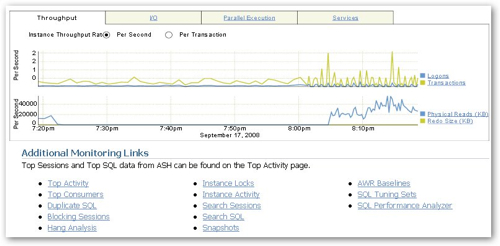
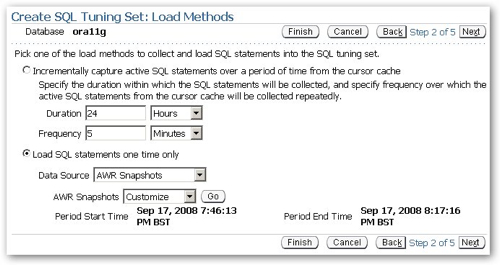
Now as the problem I'm hitting is probably more down to a lack of indexes and summaries in my schema, no amount of SQL tuning is going to fix it and therefore it's probably time to (a) create an SQL Tuning Set and (b) use the SQL Access Advisor to recommend some indexes and MVs. To do this I click on the SQL Tuning Sets link and create a tuning set based on the activity captures in the Automatic Workload Repository (AWR), the same workload that my previous reports and graphs have been based on.
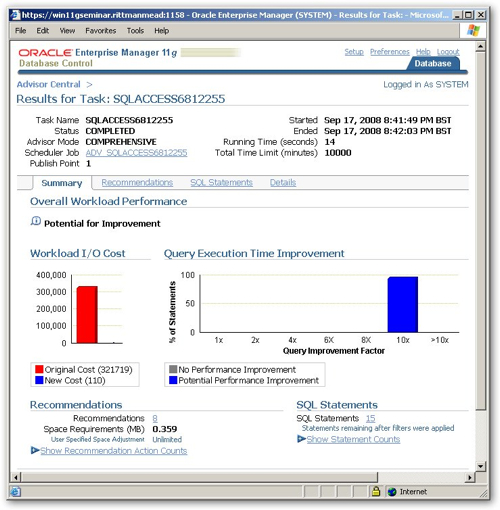
I can now take this SQL Tuning Set and run the SQL Access Advisor. Taking a look at the recommendation overview, it certainly looks like what it's going to propose will make a fair bit of difference.
I therefore schedule the recommendations to be run immediately, let the indexes and materialized views be created, and then run the workload again. This time, although the CPU seems to be fairly saturated as I'm running three sessions on a single CPU virtual machine, the waits around disk I/O have gone down, which is probably due to the materialized views that have been created, and what's more the whole set of SQL took a lot less time to run, again because of the indexes and MVs.
So, there's a typical data warehouse tuning session using the various advisors in DBConsole 11g. Of course all of these advisors require you to license the Tuning and Diagnostic Pack for the Enterprise Edition of 11g, so you can't legally use ADDM, AWR and ASH or these advisors unless you've got the relevant license. If you have though, it's quite a neat and interactive way to start tuning the queries and data structures in your database.