Thoughts on OBIEE Performance Optimization & Diagnostics
One of the sessions that I'm giving at next week's UKOUG Conference is Optimizing Oracle BI EE Performance. Now I've given talks along these lines before but I've always ended up listing out all the thing you can do to speed up OBIEE queries - turning on caching, using the aggregate persistence wizard and so on - rather than setting out a methodology. This time around though, I wanted to come up with a set of guidelines, an approach so to speak for optimizing OBIEE queries and the OBIEE architecture, so here's a few thoughts on how I might go about it. I also want to think about OBIEE tuning in a similar way to how you do database tuning, given how well developed an area that is, and one of the things you think about when you're tackling a database performance problem is "what diagnostic data is available, to help me work out where the problem is?"
If you look at OBIEE, there are seven major sources of diagnostic data that I'm aware of:
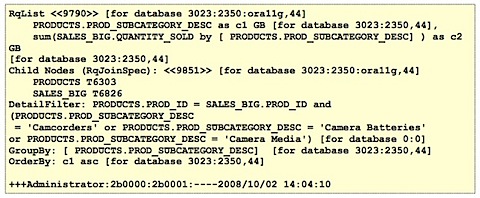
1. The query log generated by the BI Server (NQSQuery.log)
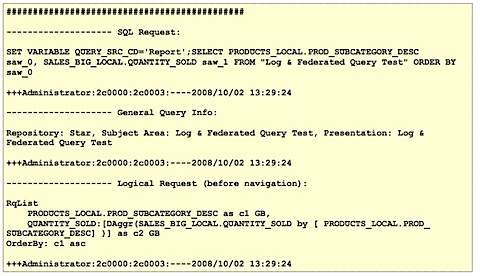
This log file, depending on which level of logging you have enabled, tells you for each query what the logical request contained, the business area and subject area, the outcome of the query (i.e. did it complete successfully), the physical response time and the physical SQL query(s) used to retrieve the data.
2. The server logs generated by the BI Server (NQSServer.log)
This log file primarly contains messages about the BI Server startup and shutdown, whether usage tracking has started correctly, which subject areas are loaded and so on. It can be useful in diagnosing whether the BI Server is up or not, whether usage tracking is working and so on, but it's not particularly useful from an optimization perspective.
3. The BI Presentation Server log (saw0log.log, etc)
This log is like the BI Server server log and mainly records the Presentation Server startup and shutdown, details of any server crashes, background tasks for purging the cache and so on.
4. Usage Tracking files and tables.
Now this is more interesting. The Usage Tracking repository, files/tables and associated reports can show you, per query (request), the total time elapsed, database time, row count, whether the query executed successfully, rows returned and so on. All of this information is stored in a file or database tables which means you can compare report run times across various days, which you can then use to start detecting performance drops or predict run times going into the future.
![]()
![]()
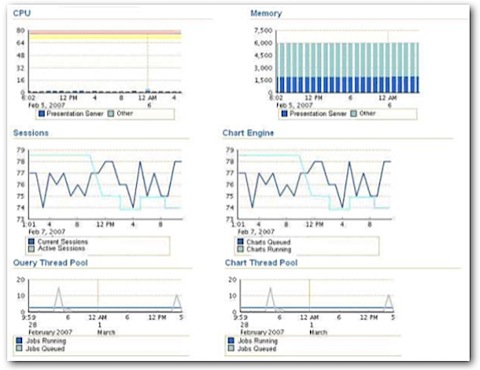
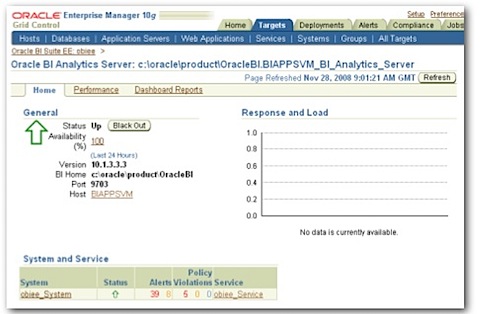
I blogged about the BI Management Pack the other week, which extends Oracle Grid Control 10gR4 to cover the BI Server, BI Presentation Server, Scheduler and DAC Repository. Like Grid Control in general, it monitory system-level metrics such as uptime, memory usage, CPU usage and so on, plus the BI Management Pack add-in gives you access to some internal BI Server, Presentation Server, Scheduler and DAC counters that can be used to assess the performance of these servers.

For the Presentation Server, you get metrics on memory usage, cpu usage and sessions, whilst for the DAC you get the total tasks, competed tasks, running tasks, failed runs, number of runs per execution plan together with average duration and so on. Finally, for all servers you get the uptime, completed requests and alerts.
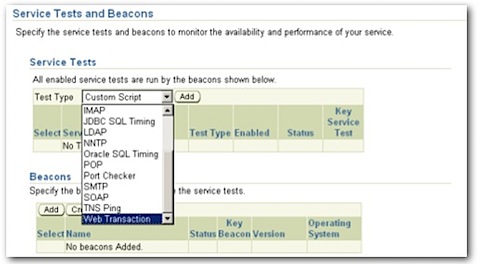
So what's this information useful for? From what I can see it's mainly useful for assessing whether the host, or the individual OBIEE server components, are under excessive load. You can also use the service level monitoring feature of the tool to generate service-level tests (logging in, navigating to a dashboard page and running reports, for example) which Grid Control can then run every so often to test "real-world" performance, and you can also use it to save and then compare configurations so that you can see, for example, whether the slow-down is because someone's turned off caching.
6. The Database and Application Server Monitoring Pages on Grid Control, or your own DBA scripts
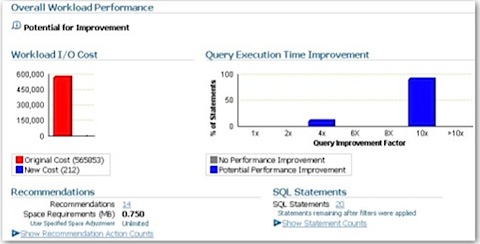
As we all know, the major contributor to the performance of OBIEE queries is the database that it gets its data from. If the database is slow, or the schema design is wrong, you're usually going to get slow-running queries however you tune the BI Server layer. Understanding the performance of the database is therefore pretty important, and you can do this with something as simple as a few scripts and Statspack, or if you're on 10g or 11g and you've licensed the Diagnostics Pack, you can generate reports using ASH, AWR and ADDM and get Grid Control to automatically recommend database tuning steps for you.
7. The DAC Console and Repository
The final source of diagnostic data applies to situations where OBIEE is working against the Oracle BI Applications data warehouse, and you're loading data into it via the Data Warehouse Administration Console. You should be able to tell from this whether last night's load completed successfully, for example, which may explain why your users are complaining that the warehouse hasn't been updated. You can also use the data in the DAC repository to measure over time how long each step in your DAC execution plan has taken to run (if you're clever, you can bring the repository into OBIEE) so that you can trend the data and spot whether your loads are taking longer, using an iBot for example to alert you if things are looking a bit dodgy.
So, now we've got all this diagnostic data, how are we going to use it? It's worth thinking at this point about some typical performance optimization scenarios, and so what we'll do is image three calls you might get from users, as well as something where you're being a bit more proactive.
Performance Optimization Scenarios
-
"The system seems slow compared to normal"
-
"This report is running slow"
-
The system isn't working
-
You wish to proactively spot performance problems
"The System Seems Slow Compared to Normal"
This is something you might get from a user, or one of the admins or developers working with the OBIEE system, where they're noticing that the dashboard is displaying a bit slower, reports run slower or the system just seems a bit sluggish. Now in the database world, you'd look at Grid Control or Database Control and see if the load on the server or database seems unusually high. You might look at the Average Active Sessions report on Database Control and notice that the number of sessions has gone through the roof, most of them are waiting on User I/O wait classes and you can generally see that things are looking a big strange. If you're on an earlier version of Oracle you may well generate a Statspack report, and note the system-wide activity on the database. That's all you can do at the moment, as what you've been told is that the whole system is slow and no-one's mentioned any particular report, transaction or screen that's an isolated problem.
The equivalent steps you'd do here for OBIEE are firstly to look at the BI Server, Presentation Server and Scheduler pages on the Grid Control BI Management Pack screens, and see whether the load on the various components has suddenly gone up (or is high compared to the historical norm.
"This Report is Running Slow"
Now this is a potentially more interesting problem. If a particular report, transaction or screen in an OLTP application runs slow, but the rest of the application runs fine (or perhaps has it's own performance problems), you really need to trace or monitor the particular session it is running in and fine out what has contributed most to response time. You can do this using TKPROF and Extended SQL Trace, or you can use utilities such as DBMS_MONITOR or the various ASH reports to work out what's going on. Using SQL Trace usually has the drawback that you needed to have enabled it in advance, whilst ASH and AWR run continuously in the background so that you've always got some session-level diagnostic data (I'm talking about the Oracle database here, by the way). Tools like Statspack aren't much use here though as they deal with diagnostic data in the aggregate, which could mask out the real reason for your particular report or sceen's performance issue.
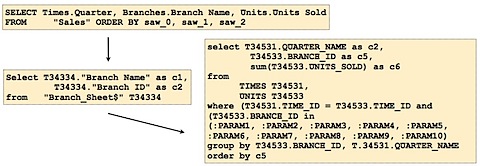
In the OBIEE world, it's a similar thing. The "sort of" equivalent to a trace file is the NQSQuery.log log file, and again you have to have enabled it in the first place for data to be collected, and at the relevant logging level. What you may need to do is to go back to the user, enable logging beforehand and then get them to re-run the report, but this time you'll have the logical query, the physical query, and if you're particularly adventurous you can even start sifting through the BI Server execution plan.
"The System Isn't Working"
This is a bit more of a dramatic problem, as some part, possibly the BI Server, possibly the Presentation Server, has gone down for some reason. It's usually fairly straightforward to work out what part has gone down, more interesting perhaps is why the crash occurred. In the database world we can look at the alert log, or use Grid Control to read the alerts and establish just how much downtime we've experienced recently.
In the OBIEE world it's a similar story, with the BI Server, Presentation Server, Scheduler and DAC Server all having logs that record startups, shutdowns and crashes. All of these logs are monitored by the Grid Control BI Management Pack which means you can work out what's gone wrong without getting up from your seat.
This of course is getting a bit ahead of the game, where you want to spot problems before they happen, correct them, so that you can go up to your users and say, "your report is taking twenty seconds more to run each day than it used to, I've reorganized the database, added some summaries and now it''ll take just a few seconds to run. Aren't I fantastic". In the database world, you can use Grid Control features to monitor query performance, you can run your own tests, or if you're particularly clever you can monitor the execution plans of your queries to spot if any of them change.
In the OBIEE world, we actually a bit better off than in the vanilla database world, as Usage Tracking stores the runtime for our reports which we can then hook up to an iBot and warn us if something's looking strange. Going forward (and this is where Oracle's BI database independence, vs. optimization towards Oracle becomes an issue), you can imagine some sort of system-wide advisor that monitors reports, recommends summaries for example at either the database level or BI Server level, recommends indexes and so on, but driven from the report level rather than the low-level SQL level.
So What Do We Do Now?
Now that we've got all this diagnostic data, and we can diagnose problems at the system-wide and report-wide level, what can we do to speed things up, or sort out the server so that it's not always crashing? Well your initial approach should typically be to try and move as much of the "grunt work" down to the database, swapping federated queries for formally integrated reporting data using an ETL tool and a data warehouse, and with the database doing as much of the complicated calculations as possible, possibly even using an OLAP Server such as Essbase or Analysis Services to handle the summarization and inter-row calculations for you.
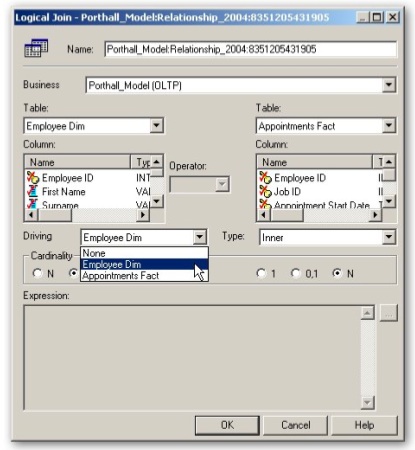
You can try caching your data, though in my experience this is usually the last desperate throw of the dice, or you can use the Aggregate Persistence Wizard to generate some BI Server-level aggregates, which can be useful if your data is unavoidably federated or the DBAs won't let you create some materialized views (don't forget to add indexes to the summaries created by the wizard though). If you're data is federated and one of the tables in the join is much bigger than the other, you can try and set up parameterized nested loop joins via the Driving Table feature, and see if this reduces the memory usage on the BI Server.