The other week I posted an article on optimizing the Oracle B Applications ETL process, and one useful set of diagnostic data I highlighted at the time was the ETL step timings that are available in the DAC Console. For every running or completed execution plan in the DAC Repository, you can list out the individual steps in the process together with the start, time, end time, elapsed time, rows process and so on, like this:

Working out where the time has gone in an ETL process is therefore quite simple, as you can sort the list of tasks by Start Timestamp, or Elapsed time, to quickly focus on on the tasks that have taken the most time to complete. You can also generate reports and graphs that tell you how the time was spent in this ETL run, broken down by ETL stages and so on.
But what if you want to see the trend for a particular mapping, task group or phase? You can view each execution plan run in the DAC console, locating a particular mapping within each run and making a note of how long it took to run, but clearly it would make more sense if we could load up the data in Excel or in a database and analyze it there. You can, in fact, right-click on the list of tasks in an exection plan and select Output to File, and this generates a delimited flat file that you can import into Excel and analyze. But the import doesn't in my experience handle dates and times very well, making it hard to analyze task timings, and besides - the data you're interested in is in a couple of databases anyway and so it'd make more sense to analyze it there.
The first place that you can find task execution details and timings is the Informatica Repository. There's a view there called REP_SESS_LOG that contains details of every workflow execution recorded in the Informatica Repository. If you run a query against this view, you can see the start and end times for a particular workflow (equating to a task in the DAC), the number of rows processed, and from this you can generate the total run time and the row throughput of the mapping, like this:
select workflow_name
,      to_char(actual_start,'DD-MON-YYYY HH:MI:SS') START_TIME
,      to_char(session_timestamp, 'DD-MON-YYYY HH:MI:SS') END_TIME
,      round((session_timestamp - actual_start) * 86400,2) ELAPSED_TIME_SECS
,      successful_rows
,      failed_rows
,      round(successful_rows / ((session_timestamp - actual_start) * 86400),2) ROWS_PER_SEC
from rep_sess_log where workflow_name = 'SDE_ORA_GLJournals_Full'
Giving you an output , in SQL Developer, like this:
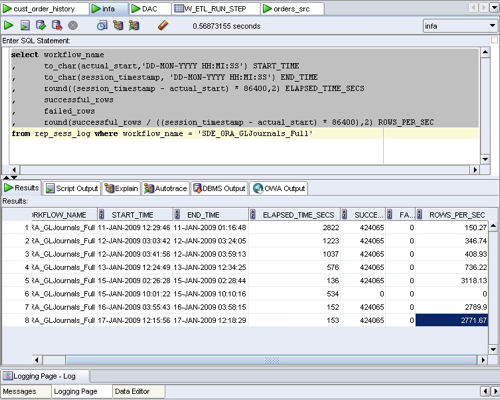
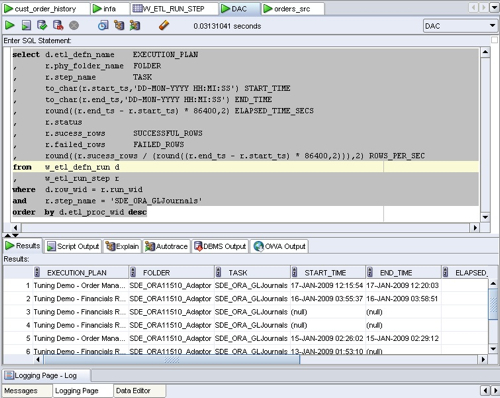
Using this sort of report, you can see how the two key metrics of elapsed time in seconds, and rows processed per second, have changed over a series of ETL runs. Now this is quite neat, but what the Informatica Repository views don't have access to is the additional metadata in the DAC such as the Execution Plan name, the Source System Folder (so that you can see if you're running a custom, out out-of-the-box version of the mapping), the ETL_PROC_WID and so on. For these. you need to run a similar query in the DAC Repository tables, which are a separate set of tables to the Informatica Repository ones, and usually held in their own schema.
select d.etl_defn_name    EXECUTION_PLAN
,      r.phy_folder_name  FOLDER
,      r.step_name        TASK
,      to_char(r.start_ts,'DD-MON-YYYY HH:MI:SS') START_TIME
,      to_char(r.end_ts,'DD-MON-YYYY HH:MI:SS') END_TIME
,      round((r.end_ts - r.start_ts) * 86400,2) ELAPSED_TIME_SECS
,      r.status
,      r.sucess_rows      SUCCESSFUL_ROWS
,      r.failed_rows      FAILED_ROWS
,      round((r.sucess_rows / (round((r.end_ts - r.start_ts) * 86400,2))),2) ROWS_PER_SEC
from   w_etl_defn_run d
,      w_etl_run_step r
where  d.row_wid = r.run_wid
and    r.step_name = 'SDE_ORA_GLJournals'
order  by d.etl_proc_wid desc
This query returns the same basic information as the previous one, except this time we've got some information on the Execution Plan, Source System Folder and so on, and it's sorted by the ETL_PROC_WID so the most recent run is at the top.
So far, so good. If you were particularly clever with analytic functions and so on, you could probably write some SQL now to show you the timings have changed for a particular mapping over time, or you could highlight those tasks whose timing over a window of ETL runs has changed more than a certain percentage. But given that we've got a perfectly good BI tool available that we can also use to analyze report run times, why don't we use OBIEE to analyze this data as well?
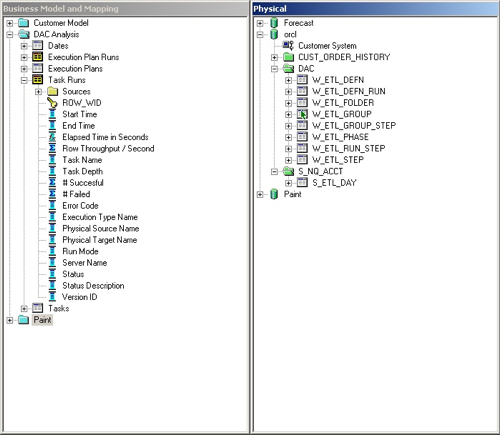
If you bring the key DAC tables into the OBIEE physical layer, and the S_ETL_DAY table from the Usage Tracking tables if you want to analyze your ETL runs over time, you can then create a logical dimensional model out of them. W_ETL_DEFN_RUN and W_ETL_RUN_STEP become your fact tables, the other tables in the DAC schema make up the task and execution plan dimensions, and the S_ETL_DAY table gives you a ready-made set of time dimension rows.
UPDATE 2/2/09 : I've uploaded the RPD file if you want to take a look. It's by no means finished or error tested, but if you want to see how I put the example together, feel free to download it and see how it's put together.
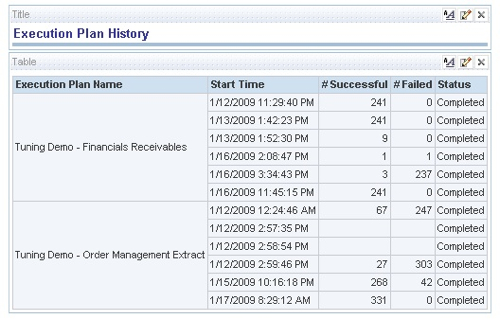
So now you can start to analyze your DAC repository data using OBIEE. Here's a quick table of ETL runs:
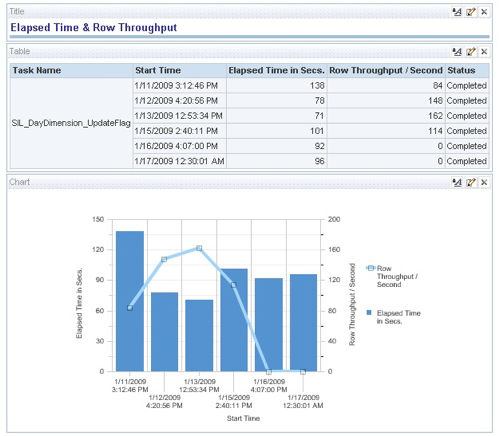
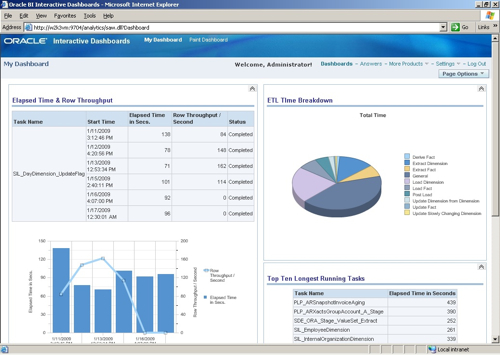
You can also create some nice graphs showing, for example, row throughput and time elapsed over time for a particular DAC task.
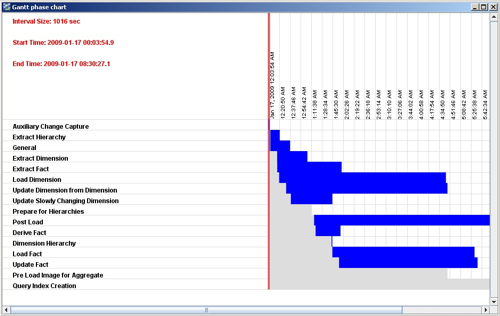
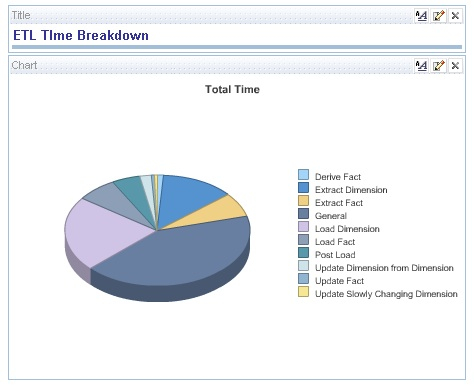
... Or perhaps provide a breakdown of the total ETL time by task phase.
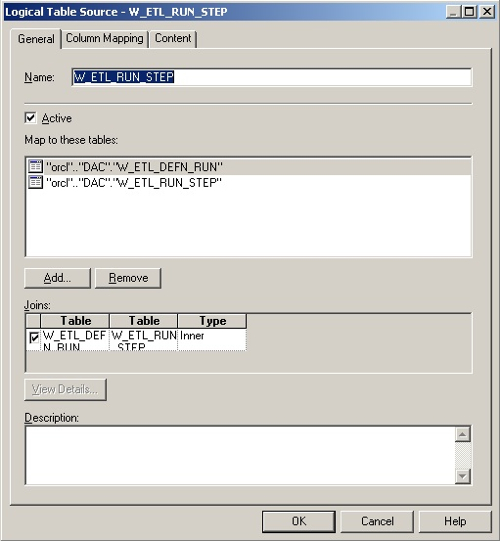
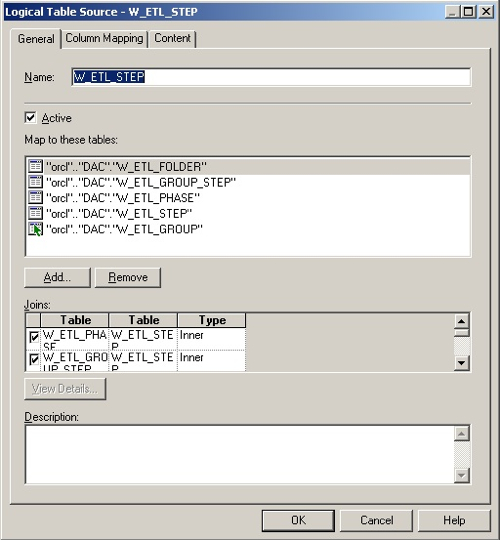
So all in all this is not a bad complement to the DAC statistics you can get from the BI Management Pack, and the query run statistics you can get from the Usage Tracking tables and reports.. In terms of how you set the RPD up for this, the joins between the physical tables look like this (W_ETL_GROUP is an alias for W_ETL_STEP):
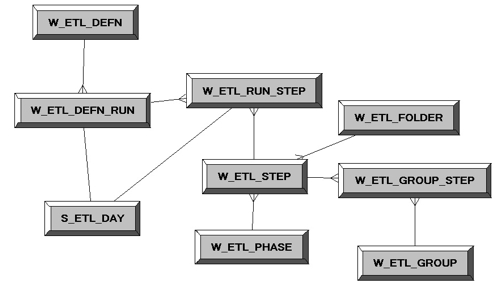
The logical model is then derived from this, with two fact tables (one for ETL runs, and one for task runs), two conformed dimensions and a single one used just by the Task Runs fact table.
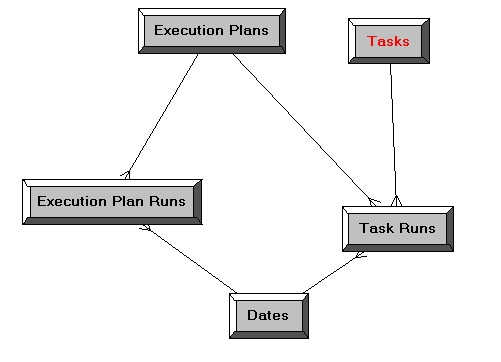
The Task Runs fact table is sourced from the W_ETL_RUN_STEP table that contains most of the details of the task execution, together with the W_ETL_DEFN_RUN table that provides the ETL_PROC_WID and details of the execution plan that called the mapping.
The Task dimension is a bit more interesting, as you have to denormalize the W_ETL_STEP, W_ETL_FOLDER and W_ETL_PHASE tables to get the main task details, the folder it points to and the phase it's assigned to; then you have to join through the W_ETL_GROUP_STEP table to find the task group, then join back to the W_ETL_STEP table (aliased as W_ETL_GROUP) to get the task group name. The rest of the tables are fairly simple.
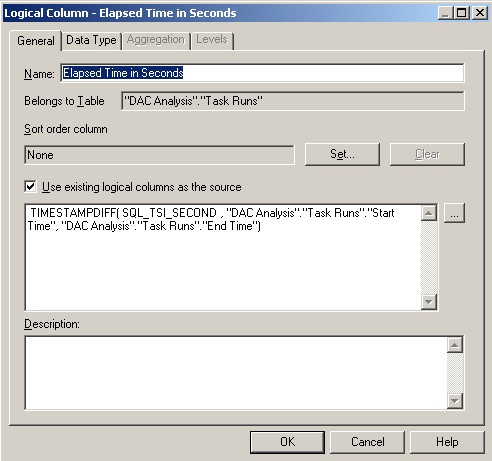
Watch out for the join between the S_ETL_DAY table and the DAY_DT column in the W_ETL_RUN_STEP table, as the latter includes minutes and seconds and the former doesn't - I had to do a complex physical join between the two tables and CAST () the DAY_DT column as DATE to truncate the seconds off. Once you've got this all set up though, you can start to create calculations based on the timings in the DAC tables, such as this one to calculate the elapsed time.
You can even create a DAC analysis dashboard, so that you can monitor your ETL process along with your query timings, create alerts and guided analytics, and provide the ability to drill-down from the overall execution plan to show individual mappings, task groups and phases.
Like I said, not bad. Don't forget that with the DAC tables at least, none of these are "public views" or APIs so use them at your own risk, they may well change from release to release. But it's a nice way of making use of the data in the DAC Repository, and giving you the potential later on to combine it with query response time data from the Usage Tracking tables into a single "DBA View" of what's going on in OBIEE and the DAC.