Essbase Multi-Dimensional OLAP Analysis using OBIEE Plus and Oracle Financial Reporting
I've been working with a few customers recently who are implementing OBIEE along with Essbase. Typically they are long-standing users of Essbase, and bought OBIEE because it could integrate both their multi-dimensional Essbase data and the relational data in their data warehouse. What they were finding though was that, at least in it's current version, the OBIEE semantic model along with Oracle BI Answers wasn't in fact a particularly good fit for their Essbase data, especially when they wanted to produce typically Essbase-like financial reports and/or their dimension hierarchies are "ragged".
To take an example; you may have an Essbase cube that has regular, balanced dimension hierarchies with named levels (or generations) and simple sets of measures, like the sort of cube described in this previous article on OTN. These work well with OBIEE, which imports the cube structure in to the BI Server semantic model, like this:
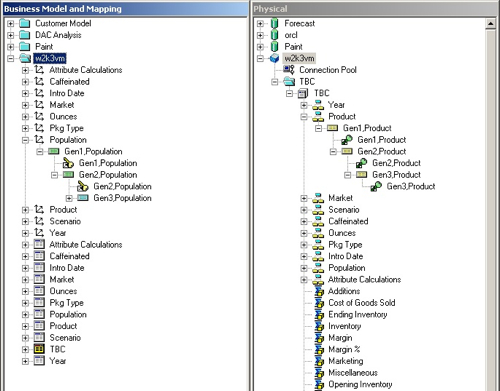
In many cases, Essbase databases have ragged hierarchies and unbalanced hierarchies, which although OBIEE lets you import them into the semantic layer, end up getting flattened and individual dimension members might end up in any one of the logical columns used to represent the hierarchy generations. This can cause you a problem if you're assuming that all countries, for example, are found in the Gen2,Organization column, as you might find that some of them have moved down to the Gen3,Organization column, making it difficult to filter and group by them. What's worse, if your dimension hierarchy changes such that it now stretches to another generation, you have to re-import your Essbase database metadata back into the OBIEE semantic layer, with all that entails around having to re-work all the integration and formatting you'd applied to the columns.
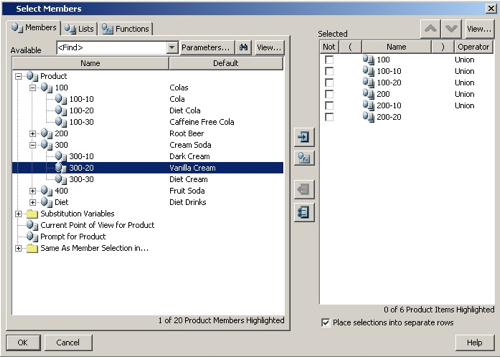
Another issue with bring Essbase data into OBIEE and then trying to report on it using Oracle BI Answers, is that the way you make dimension member selections is very "un-OLAP like". In OLAP tools, users are used to selecting dimension members by their name, and being able to navigate up and down the dimension hierarchies to make selections, in some cases selecting arbitrary members from all different levels. In Oracle BI Answers, you have to apply filters to columns, and if you've got ragged hierarchies with members being scattered over several columns, which one do you filter on? And what happens if the dimension member then moves down a generation after an outline restructure?
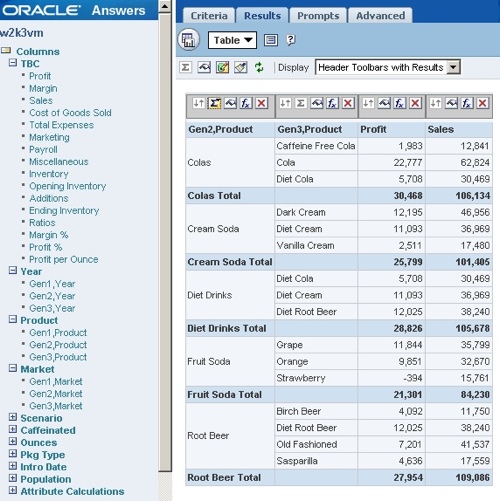
The last problem I'm often seeing is around totaling in reports. If you look at the report above, the totals are calculated on all the products below the product category, and are generated by the reporting tool on the fly. But in OLAP-style financial reports, often the totals don't neccessarily add up to the items they are broken down by, as some detail-level rows might be left out as they are not so significant. In some cases, for certain categories only the category itself might be shown, with no detail breakdown, and each individual row might be formatted in different ways, like a profit and loss account. What I'm seeing therefore is customers struggling to get OBIEE and Oracle BI Answers to behave like their old Essbase reporting environment, and getting frustrated because the reporting seems so basic.
When I come in, what I say to people tends to break down into the "bad news" and the "good news". The bad news is that Answers, at least in it's current form, isn't an OLAP query tool in the same way as WebAnalysis and the Essbase Excel Add-in, and you're not going to get proper selection of dimension members by their hierarchy (although this is planned for Answers+, the next release of Answers due as part of OBEE 11g). In addition, if your Essbase database has got ragged hierarchies, you're not going to be able to integrate them with your relational data with it's level-based hierachies, as there'll be no consistent logical column over your Essbase data that always returns country or product category information, for example. I'd be surprised if this was fixed in the next release of OBIEE as the semantic model is fundamentally a relational, level-based one, but we'll have to wait and see.
The good news though is that you can do exactly the sort of reporting you want with another part of the OBIEE Plus suite, namely Oracle Financial Reporting. Financial Reporting is designed for exactly these sorts of reports, with a hierarchical dimension member selector; the ability to nest, group and break report rows as you wish; the ability to include and exclude summary and detail-level data in your report, plus, you can access both Oracle BI Answers and Oracle Financial Reporting within the same EPM workspace, using the same Single Sign-On environment, and you can even drill across from reports in one tool to another. For customers looking to do "proper" Essbase reporting within the OBIEE Plus toolset, I'm recommending Financial Reporting directly running against Essbase cubes at least until OBIEE 11g is released and available to use (and even then, I think Financial Reporting will have a place).
So how does Financial Reporting work? To take a simple example, I've got my TBC (The Beverage Company) cube in Essbase, and I want to create a financial statement-style report that only includes selected members from certain levels in the product hierarchy. To create my new report, I start up Financial Reporting Studio, create a new report and make my dimension member selection.
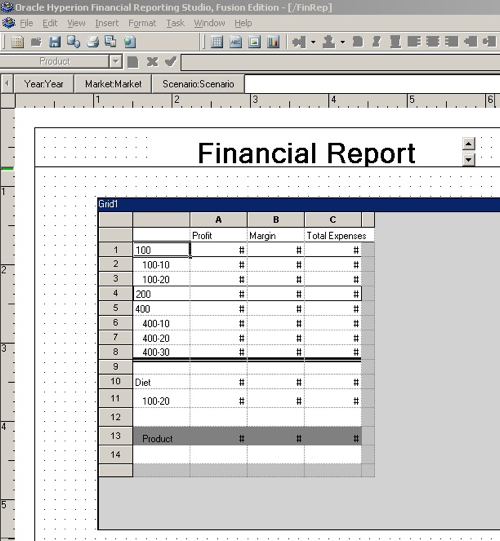
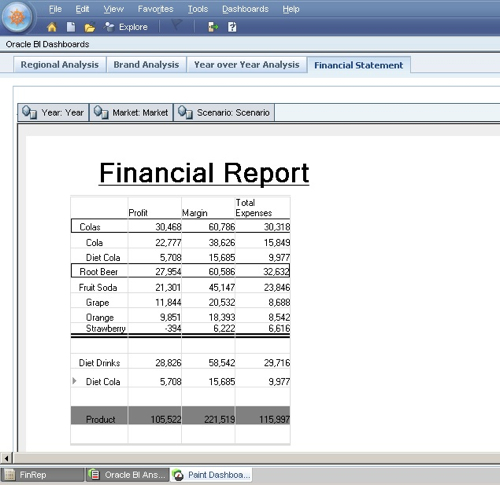
If you run the report from EPM Workspace, it looks like this:
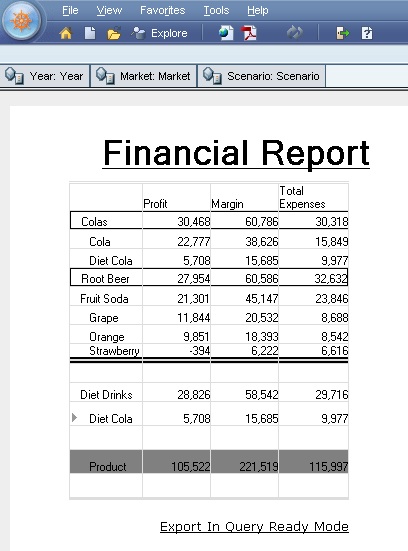
I know it's a little bit frustrating that you can't put it all through the OBIEE semantic model and report on it together using Answers, but at least for the time being Answers and the BI Server aren't quite multi-dimensional enough and you're better off, at least for this release of the OBIEE toolset, delivering these sorts of reports using Financial Reporting instead.
Lastly, if anyone else is struggling on getting OBIEE and Essbase working together and would like one of us to come on-site for a few days to help them out, just drop me a line and we'd be glad to help. It's an interesting area that requires skills across quite a wide range of disparate products, but we've worked on a few projects in this area now and know how most of the pieces fit together, and what works and what doesn't work, if you know what I mean.