Outside the world of Oracle, one of the rising stars of the BI world has been Qliktech, the Swedish software company behind QlikView. QlikView is one of a new breed of desktop, in-memory BI tools (see also the forthcoming Gemini tool from Microsoft, an in-memory, column-store BI tool that'll be delivered as part of Microsoft Office 2010) that are being evaluated by customers as alternatives to traditional relational query tools such as Oracle BI Enterprise Edition and OLAP servers such as Essbase or Oracle OLAP. So what is QlikView, and how does it compare to Oracle's BI tools?
QlikView, compared to Oracle's relational and OLAP query tools, has a slightly different approach to storing and querying data. Whilst it can load data from relational and file-based data sources, it then stores the data in-memory in a compressed form with associations defined between data items rather than the traditional joins that we see in relational query tools. The idea behind these associations is that they are derived by Qlikview during the data load based on matching up columns across tables with the same name, and then when you query the resulting dataset you can analyze your data using these associations.
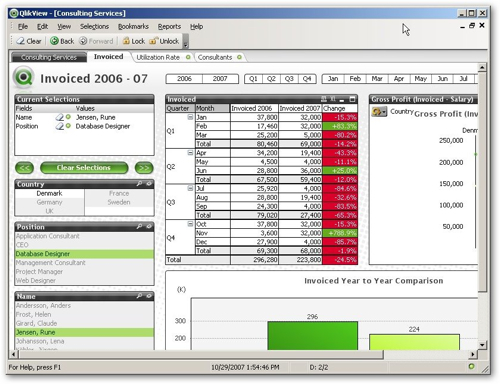
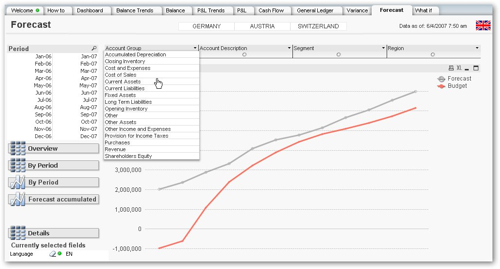
To take an example, the following QlikView demonstration shows data for a consulting company in a Windows thick client application. To analyze your data, you click on a data item, the numbers on the charts are then filtered by this value, and other data items that are associated with this selected value are then also made available for selection. The screenshot below shows this filtering in action, you can see the selected fields in green, the ones that are greyed out are no longer available for selection.
Now obviously this way of selecting data items, and this method of "association", is fairly alien to traditional Oracle BI users and so I put together a simple example using the Sales History (SH) dataset available on recent Oracle databases. The first step in creating some QlikView reports is to define a new document, which in the end will hold the report layout, the data loading queries and the actual reporting data itself, which gets loaded in to memory when you open the QlikView document. Once you've defined the new document, you create a script to load data in from in this case an Oracle database.
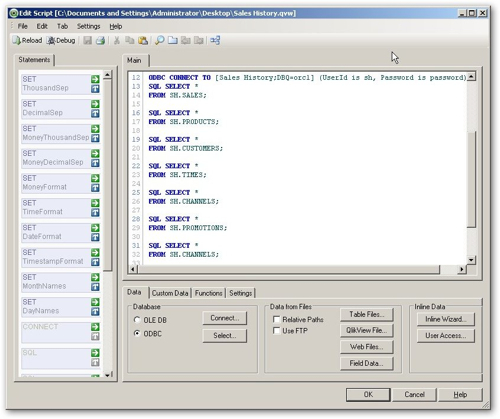
This is in fact a similar process to putting load scripts together for Essbase and Oracle Express, with connections being made through ODBC and OLE DB for databases and direct connections being made to file and HTTP data sources. I get the impression that the most regular use case for data loading in QlikView is loading from files, and this would correspond to the target market for this tool which is desktop analysts who want to report on their data separately from the infrastructure around their enterprise BI tools and data warehouse.
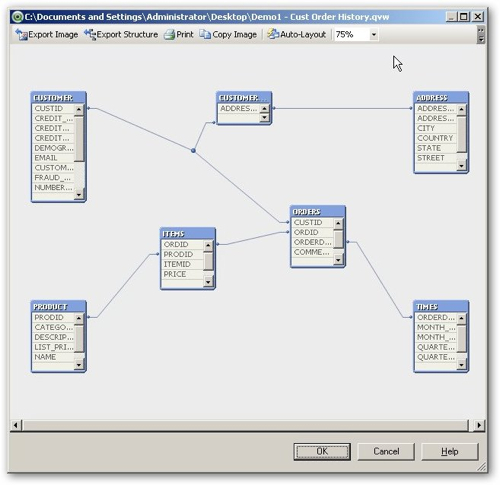
Once you've brought your data in, you can view it either as a database (source) data model, or as the logical model that QlickView generates when it loads in the data. In fact for the SH schema, these are both the same as the joins in the Oracle schema are turned into the associations that QlikView uses, so what you see looks just like the regular sort of data model you'd see in any relational query tool.
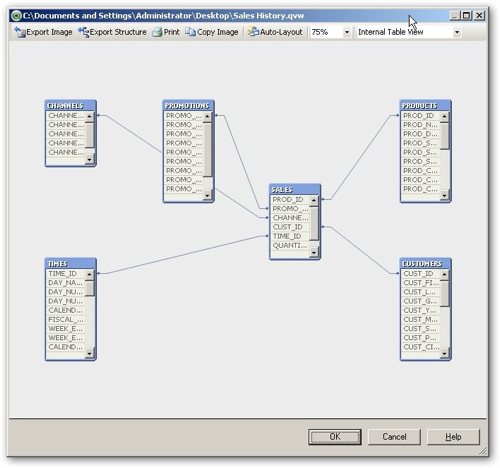
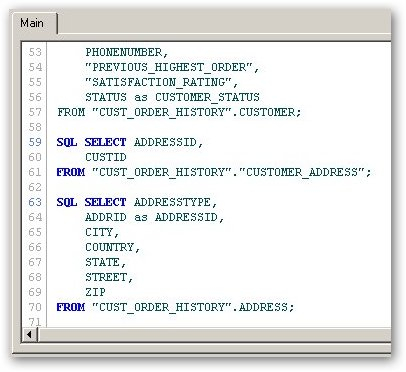
The joins (or associations) are defined by QlikView during the import process by matching up columns of the same name - each match creates an association. This means that to create a join, you need to alias column names as they come in (to change ID to CUSTOMERID for example, if this is required to join to another CUSTOMERID), and you need to create aliases to break associations so that the STATUS column from the orders table isn't linked to the STATUS column from the customer table when this isn't really appropriate.
For an Oracle dataset with well defined primary and foreign keys, the logical table structure that QlikView creates in memory is usually pretty much the same as the Oracle schema, but for files or with data sets with lots of cross-related data, QlikView will create synthetic keys and synthetic tables to record the associations and assist with analysis. Internally QlikView tokenizes and compresses the data as well which meant that, for the Sales History data set that I worked with earlier, the total size of the QlikView document (including the data) was only 4MB and took about 1 minute to load and prepare, whereas the corresponding Essbase data set (as built in this OTN article) took up several gigabytes of space and took over an hour to load and prepare. Impressive stuff.
Loading the normalized data set that I used for this article on OBIEE data modeling produced the following logical QlikView table diagram, which as you can see is a direct reflection of the normalized Oracle data model.
This ability to report against normalized data obviously makes setting up the data model easier compared to OBIEE (notwithstanding the need to rename columns to make and break associations), but it then doesn't make any distinction between columns that are measures and ones that are dimension attributes, which makes working with data in reports a bit more complicated.
So once you've got the data in, how do you create a report? And more importantly, how do these reports compare to Essbase or OBIEE reports? The actual report creation process is a bit like working with tools such as Hyperion Interactive Reporting or Web Analysis in that you construct an application made up of crosstabs, graphs, gauges and the like, which are then run either in the thick-client Windows application or online using a variety of thick and thin web clients. If I wanted to create a bar chart that allows users to select the product category, month and state of purchase and then graph product sales broken down by customer satisfaction rating, I'd add three field list boxes to my document and then create a bar graph chart, which would be automatically filtered by whatever I select in the lists.
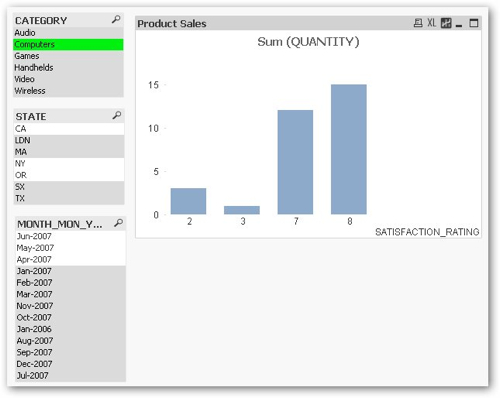
In the screenshot above, I've first selected the "Computers" product category which filters the graph, and highlights the states and months that have sales for this category. If I then selected the CA and NY states, only the months that are associated with sales (quantity) for Computers and CA / NY sales would be highlighted, and so on. As such, the "Qlik" part of Qlikview seems to translate to progressive filters of your data based on the items you have selected, with the filtered-down dataset being made up of the data that will join (or "associate") with the data items that you have selected.
If you're looking to produce Essbase-like reports where data is shown in hierarchies, this is a bit trickier. There isn't really a concept of hierarchies in Qlikview; you can create column groups which group together columns that are related, but I can't see a simple way to select column members, for example, by their position in a hierarchy which is pretty standard in OLAP tools such as Essbase.
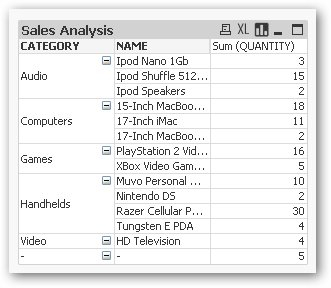
Displaying data in hierarchies is a bit simpler, especially as QlikView automatically calculates the relationship between columns and their values so that, for example, if you display product categories and products in a pivot table chart, the product are automatically shown under the categories that they relate to.
What I found trickier (as in I couldn't do it) was to create a pivot table with regions, for example, across the top of the pivot, or to add page items or other controls. I've only used QlikView for a few days and so I may well have missed this feature, but none of the example documents that came with either of these features and therefore I suspect that it's not something that the product does, for the moment.
Working through the examples that ship with QlikView 9, visualizations and fast access to data seem to be the main strengths of the tool. For example, the Sparkline graph type that features strongly in Stephen Few's "Information Dashboard Design" book is present and correct in QlikView:
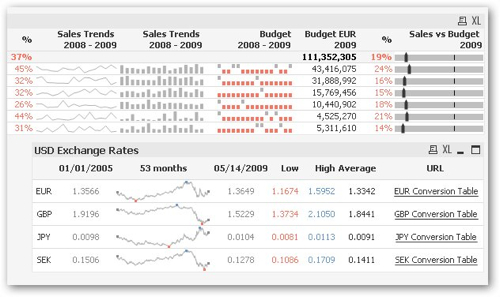
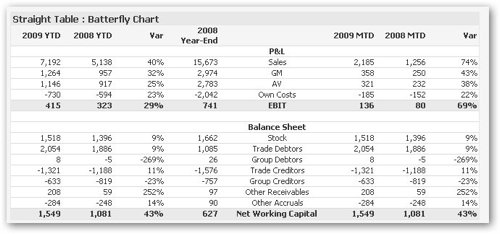
As are butterfly financial-style tables, used for displaying P&L reports and other finance data.
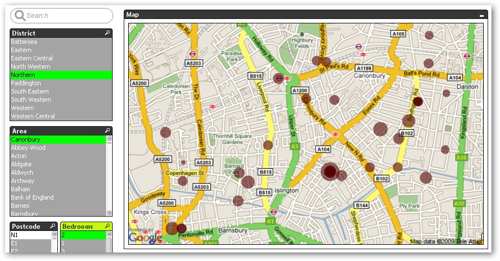
One of the examples uses Google Maps to illustrate data, in this case around house for sale in London.
Where QlikView is weaker in my view, compared to any of the Essbase-backed query tools, is around number-intensive and hierarchy-intensive applications. It's not easy to select dimension members via a hierarchy, the scripting and calculation language that comes with the tool obviously doesn't support the richness of languages like MDX and Essbase calculations scripts, and of course there are not the applications such as Planning and Financial Management that you'd expect to make use of in the Finance Department.
That said, for what it does (provide fast access to star and normalized data sets, including data sourced from files and from the web) it does the job very well, with excellent load and preparation times and sub-second response times, even with large data sets. You probably wouldn't use Qlikview instead of Essbase or Oracle BI EE as they address different requirements, but as a sales analysis tool or a tool to analyze OLTP datasets, it takes some beating.
It wouldn't surprise me to find that Oracle or another of the big vendors acquires QlikTech at some point as QlikView would make a nice complement to the more enterprise, heavy-duty query tools, especially when tools such as this and the forthcoming Gemini from Microsoft threaten to create desktop BI tool "bridgeheads" on users' desktops as they are just so easy to use and to set up (can you imagine getting Business Objects and all its technology stack up and running over a couple of evenings, for example, let alone learning how to use it?). It wouldn't also surprise me if vendors such as Oracle do more to bring their database and query tool processing in-memory, given the amounts of RAM available on users' desktops these days and some of the advances being made in data compression technologies.