Taking a Look at Panorama and Google Apps
I'm off to Copenhagen this evening to deliver a keynote at the Danish IT Society's Business Intelligence conference, and as the event is not Oracle-specific I thought I'd take a look at the BI and data warehousing market in general. The theme of the keynote is around the heightened demand for BI in this particular recession, and I wanted to take the opportunity to take a closer look at three vendors who have been particularly innovative in terms of "time to market" and "user-centricity". The first product I'll be demoing is the Oracle BI Applications, the second is Qlikview, and the last is the joint offering from Google and Panorama that I called out on this blog at the start of 2009.
Google have over the last few years been steadily developing applications that run in the cloud and that compete with the likes of Microsoft Office and Microsoft Exchange. Google Docs is a nice environment for creating and then collaborating on shared spreadsheets, documents and presentations and in fact we use this tool extensively within Rittman Mead for collaborating across all of the countries we operate in. Google Spreadsheets isn't as fully-featured as Microsoft Excel, but it covers the vast majority of features most people want to use, and you can collaboratively edit documents and share them without any hosted server-side infrastructure.
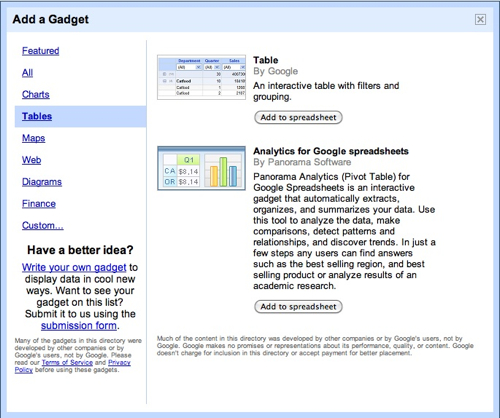
Panorama Software have had an interesting journey over the past ten years or so, originally developing the OLAP technology that became Microsoft Analysis Services, and the front-end tool to accompany it that they then marketed as Panorama Novaview. All of this led to a fairly close association with Microsoft until Microsoft then went and bought ProClarity (prior to this they had a policy of not favouring any particular front-end tool or vendor), which then led to Panorama linking up with Google and offering a cloud-based version of their new OLAP engine, plus an OLAP query components that could be plugged into a Google spreadsheet as a "widget". All of this is free, which means that in theory, you can start performing OLAP analysis for nothing using just Google Spreadsheets and the pivot table widget from Panorama. So how does it work in practice, and are we going to see OBIEE and Essbase customers moving their data into the cloud and using this ultra-low cost alternative?
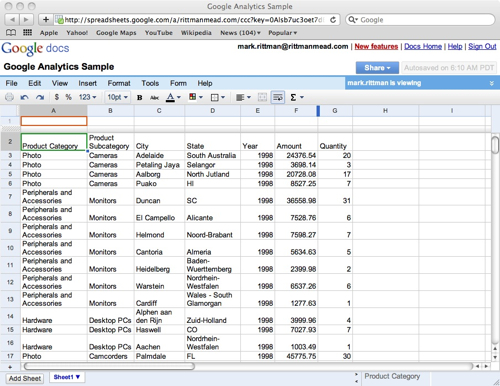
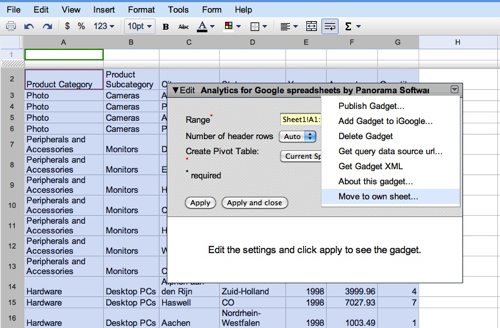
The first step is to either create a new Google spreadsheet, or upload one from Excel. This is in fact where you hit the first issue, as Google spreadsheets can only contain a maximum of 200,000 cells, which sounds a lot but if you consider that your data might contain 10 columns (6 of dimension values, four of measures for example) then you are limited to a maximum of 50,000 rows, which isn't far off the maximum for Excel but it's still a bit limiting when it comes to real-world datasets. There is a way around this - more on this later on - but assuming you can work around this, you create your spreadsheet so that it looks like this:
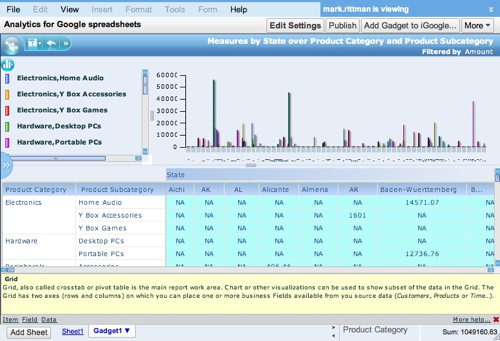
So, is it game over for Oracle, is this to OBIEE what GMail was to Microsoft Exchange? Realistically, although it demos well, it's a fairly limited product, suffers a bit from the latency of the Java/Flash UI and feels a little bit "flakey". Although on the surface it seems comparable to the pivot table view in OBIEE, when you think about what users want to do with pivot tables once they've set them up - create page and section items, set up drill-through to detail, set up navigation, create custom calculations, measures and aggregates - it's quite a limited solution, but if the alternative isn't really OBIEE, it's "no BI", then this is certainly quite an attractive proposition. In addition, if you've got data in a local Microsoft Analysis Services cube and you're considering whether to use Sharepoint plus Excel Services, but think that option is a bit heavyweight and expensive, this could be an interesting alternative particularly if you're looking to share or collaborate on your analysis.
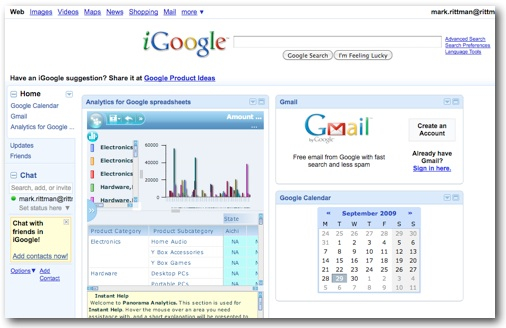
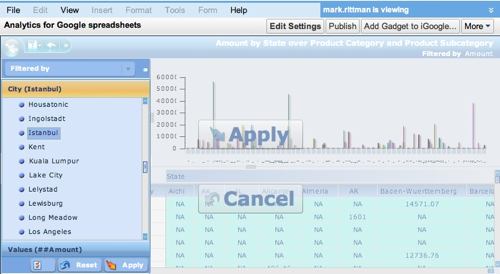
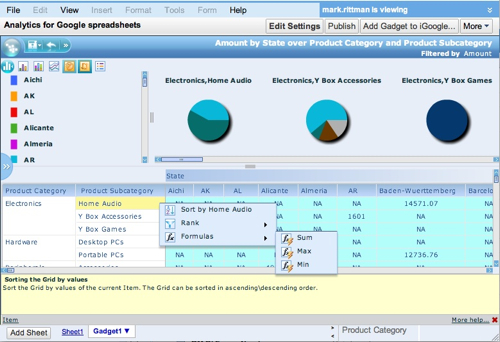
One interesting other feature is the ability to embed these OLAP reports into your iGoogle dashboard. If you look at the top right-hand part of the screen above, you'll see an Add Gadget to iGoogle button, when you press this it lets you add the OLAP report into your iGoogle dashboard alongside your email, calendar and so on.