Jorge Anicam's blog post the other day reminded me about the online layout builder preview that's been available in the past couple of releases of Oracle Business Intelligence Publisher 10g.
As a quick recap, BI Publisher up until now uses either Microsoft Word (through the BI Publisher Desktop plug-in), Microsoft Excel or Adobe Acrobat to lay out report layouts (or "templates"), which are then paired with a data query to give you a report with some data in it. Whilst Word is a useful environment for defining report layout, it does require you to have Word installed (obviously), but more importantly it requires you to come out of the online BI Publisher Enterprise environment to finish your report definition.
The online layout builder made available in preview form in the 10.1.3.4.1 release, and in supported form from the 11g release, will allow you to define all aspects of the report in the one web-based environment, removing any third-party tool dependency and any need for a client-side install.
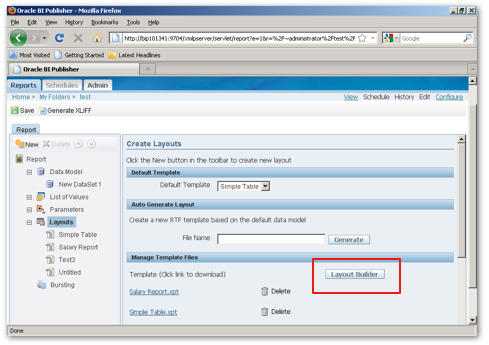
You can access the online layout builder in a number of places, the most obvious being through a button labelled Layout Builder in the Layouts area of the BI Publisher Enterprise report definition page.
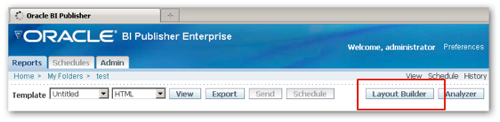
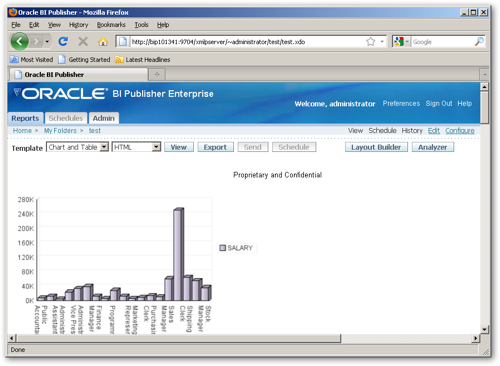
You can also access the online layout builder from the main toolbar in the BI Publisher report viewer, like this:
Taking as the data source a simple query against the EMPLOYEE table in the OE schema, when you press the Layout Builder button you are first presented with a set of predefined "boilerplate" layouts, such as "Empty", "Header and Footer", "Dashboard" and even "Mobile Apple iPhone".
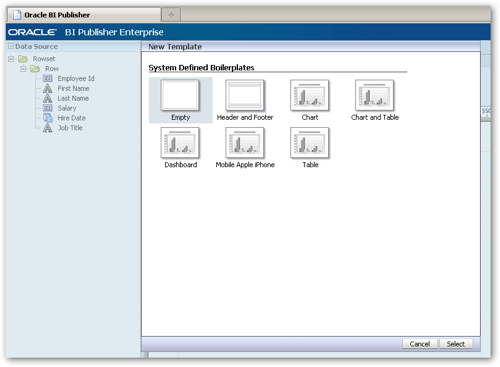
These boilerplate layouts define the size of the report page, what elements are already placed on the page (a blank chart definition, for example), whether headers and footers are defined, and so on. Presumably you can define new boilerplate templates by taking a layour definition and saving it somewhere, as the boilerplates appear to be just normal templates with the item placings defined, page setting set and so on, and then just saved in a special place.
I chose the "Header and Footer" boilerplate and then took a look at the layout builder interface.
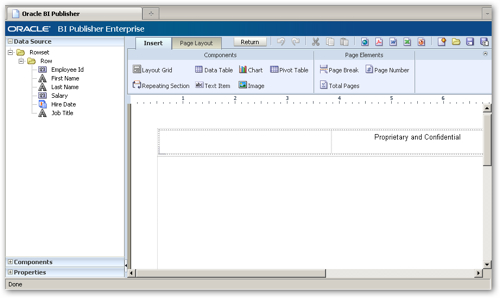
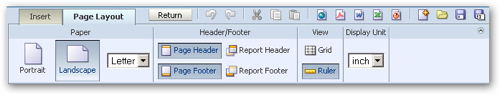
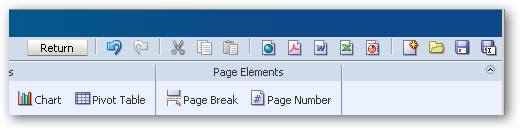
On the left hand-side of the screen is a concertina-style area that initially lets me select a data item to put on the layout. Across the rest of the top of the screen is a ribbon-style dialog that lets me choose between report components to add to the layout, and also add page breaks, page numbers and total pages elements. Clicking on the Page Layout tab on the ribbon shows another set of options, this time for setting the orientation of the page, whether a footer or header are included, the size of the page and so on.
I start off then by adding a Data Table report component to my layout, onto which I then drag and drop various data items from the Data Source view on the left.
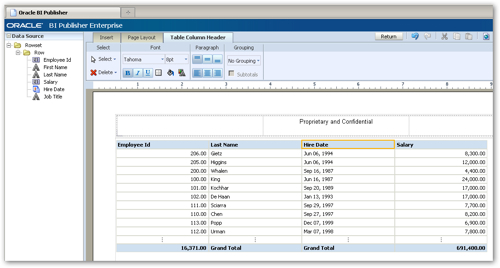
Notice how both the Employee ID and Salary columns have both been totalled, as their data type is numeric, and how the table headers and footers have automatically been formatted. To delete the totalling on the Employee ID field I just click on the total and press delete; to set the Salary total aggregation to "Average" rather than "Sum" I first click on the total to select it, and then click on the Properties entry in the left-hand concertina interface to display a list of the cell properties.
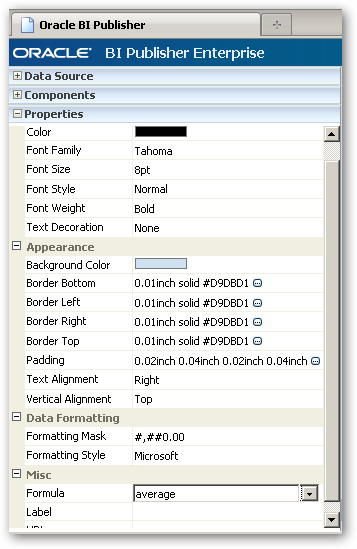
Using this dialog I set the Formula for the cell to average, and then return back to the layout to change the label property for the Grand Total to read "Average Salary".
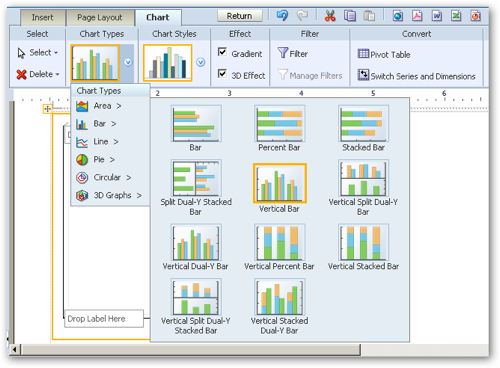
I then return to the ribbon and this time, add a chart underneath the data table. This presents me with a chart definition framework together with options to change the chart type, chart style, effect and filters.
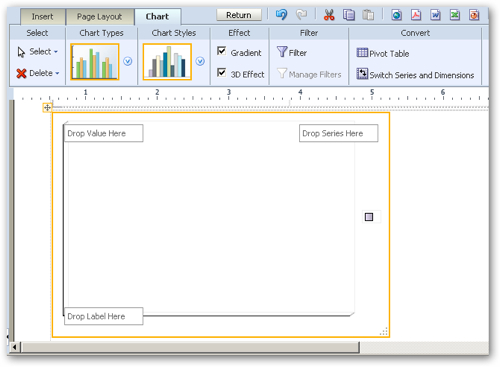
The chart styles are the standard BI Beans/Discoverer-type styles ("Executive","Autumn","Regatta" etc), whilst the list of chart types includes categories for bar, line, pie and other chart types.
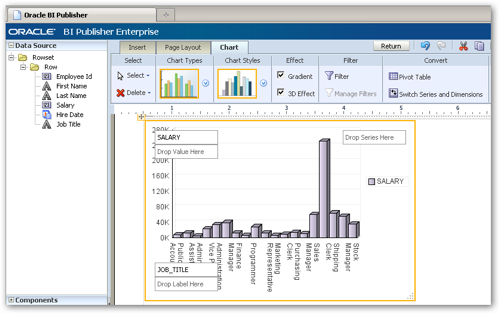
Returning back to the chart definition, I drag and drop the Salary data field onto the Drop Value Here area, the Job Title field onto the Drop Label Here area, and the chart is then immediately previewed.
Now that the report is ready, the toolbar on the top-right hand side of the screen can be used for previewing the report in HTML, PDF, RTF or other formats, or we can save the report if it's ready for use with the report.
I first preview the report in HTML form, and then press the Save button to save the report to the BI Publisher repository.
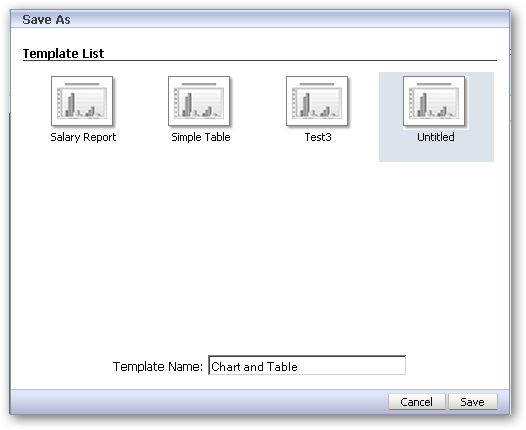
WIth the online report builder, you don't save the layout/template to an RTF file; instead, the layouts are saved in XML format with the extension ".xpt", and are converted to XSL-FO by BI Publisher when the report is run. This XML format is of course extensible by Oracle and presumably will give them more flexibility in introducing new features into BI Publisher post-11g.
Running a report using the new layout is the same as with RTF templates, however a lot of formatting is introduced by default which makes simple reports look more professional.
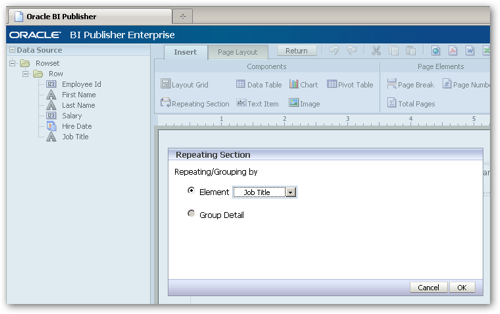
It's possible also to layout more complicated templates using the layout builder. For example, I might want to create a report that groups employees by job title, adds a page break between jobs and adds some narrative text around the job title name.
To add a grouping section to a layout, you select the Repeating Section item from the Components area in the ribbon, and then select the item to repeat on, in my case, "Job Title".
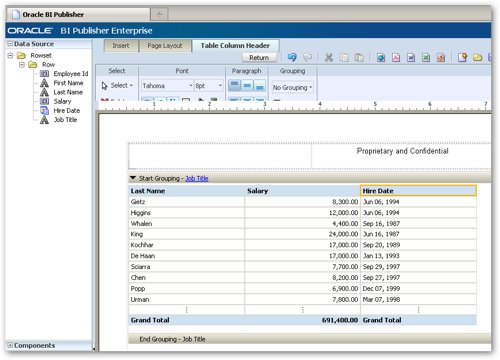
This then adds a repeating section area to the layout, into which I add a data table item showing the staff with this job title.
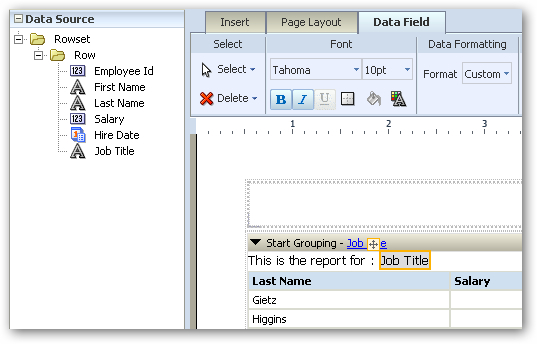
I now want to add a bit of text above the data table, to display the job title with some text around it. I start by adding a Text Item to the repeating section above the data table, and add some text to it, like this:
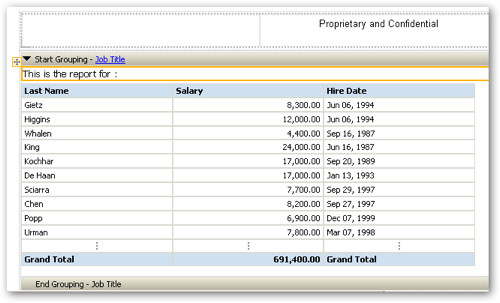
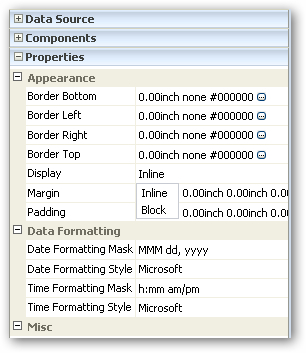
As I want the job title to be displayed on the same line as this text, I switch to the Properties area in the left-hand concertina menu and set the Display property for the text item area from Block to Inline.
I then switch to the Data Source area in the concertina menu, and drag and drop the Job Title data item onto the layout, next to the text block that I just created.
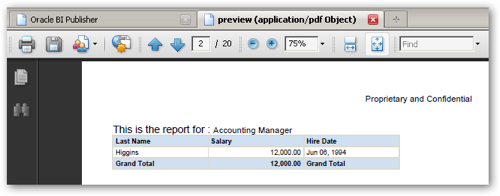
Finally, I add a Page Break item below the data table in the repeating group, and the preview the layout as a PDF.
So there you have it. Bear in mind that this is just a preview release, and it'll be featured properly in the 11g version of BI Publisher, which is likely to have additional features and of course be a bit more polished. It's a good preview of what's coming though, if you're interested in seeing how the template creation process is likely to develop as future releases of the product come along.
Bear in mind also that if you do decide to use it now, it's not supported, there may well be bugs, and there's no guarantee that your layouts will transfer to the 11g release when it comes out (so treat it as a preview rather than a production feature.)