Oracle BI EE 11g - Decoding Essbase Connectivity - Part 2
In the last post we saw how BI EE generates Essbase specific MDX while using Attribute columns for a specific case. In today's post we shall look at how the new BI EE 11g specific features like Hierarchical columns and Value-Based hierarchies affect the MDX generated. For continuation sake, i have highlighted the case again below.
Case 1: PA - External Aggregation, BA - External Aggregation, HT - All dimensions marked as Unbalanced (BSO Cube), MT - Single Measure Essbase type model
Hierarchical Columns:
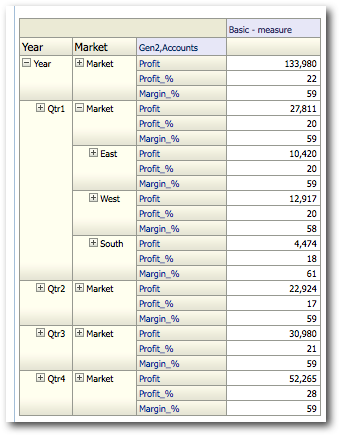
We start off with creating a simple report containing 2 hierarchical columns and an attribute column from different dimensions as shown below.
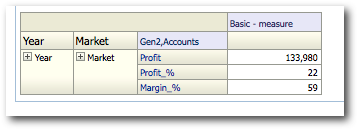
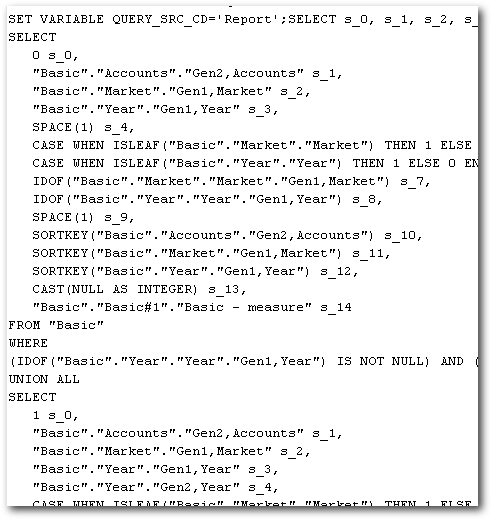
Let's now look at the actual MDX generated.
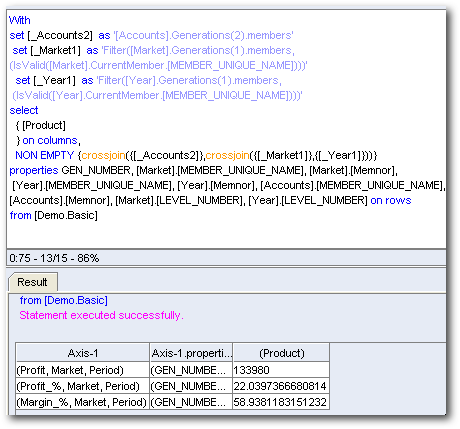
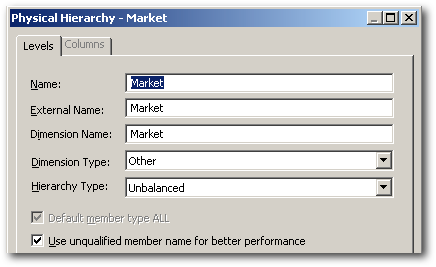
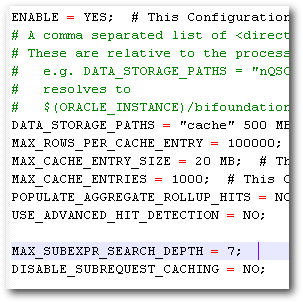
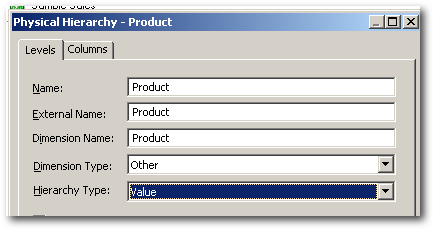
As seen here, this is a pretty efficient MDX. One big difference is, in 10g for every level there will always be a reference of a generation for every column. But in this case, since the topmost member is the dimension itself for the hierarchical columns, the dimension names (in addition to the Generations) are directly used. So how does BI EE know the name of the dimension. That is derived from the External Name given for the hierarchy/dimension as shown below.
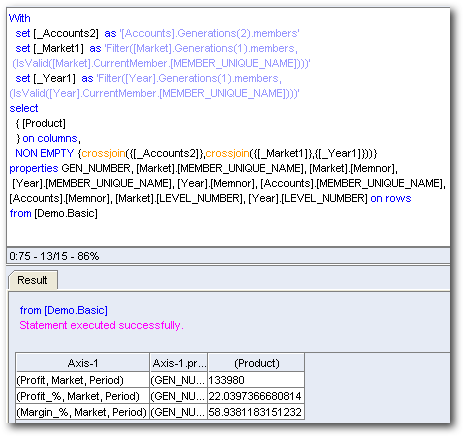
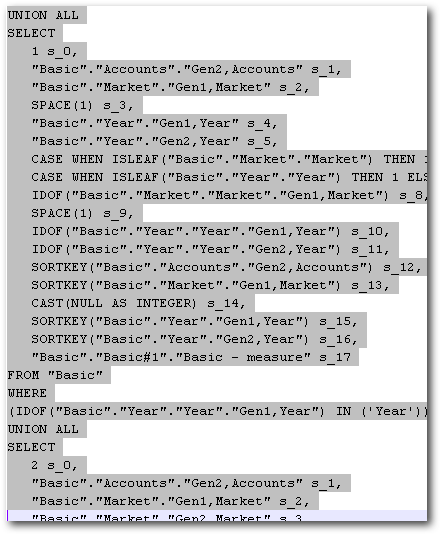
All the above was done through 1 Logical SQL without any UNIONs & UNION ALLs. Lets, now drill on the Year dimension and take a look at the Logical SQL.
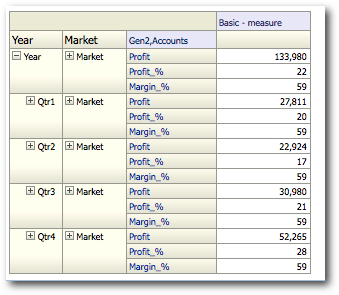
There are now 2 Logical SQLs combined through a UNION ALL statement. In effect, BI EE will fire separate MDX for each Logical SQL. Let's take look at the MDX generated. As expected there are 2 main MDX queries (in addition to outline sort order mdx queries). So, for every interaction in the report(drill), there will be a corresponding Logical SQL and a corresponding MDX.
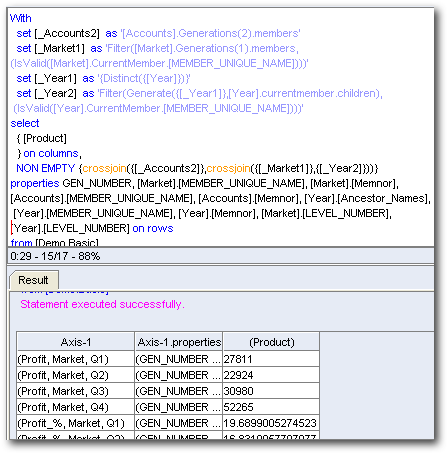
Again, these queries are pretty effecient and only go against the pre-aggregated intersections. Let's now drill on the Qtr1 Market dimension and then look at the MDX generated.
The logical SQL of the above query will in turn contain 3 sub-logical SQL queries. with each query generating an MDX.
The first 2 MDX of the 3 MDXs generated will be the same as listed above. As you can see, since we have a lot of UNION Alls with separate MDX being generated, there is quite a lot of opportunity for enabling sub-query caching in BI EE. Thats one of the main reasons why the new feature of sub-query caching has been introduced in 11g (improving performance while drilling down on hierarchical columns). The extra MDX generated is given below
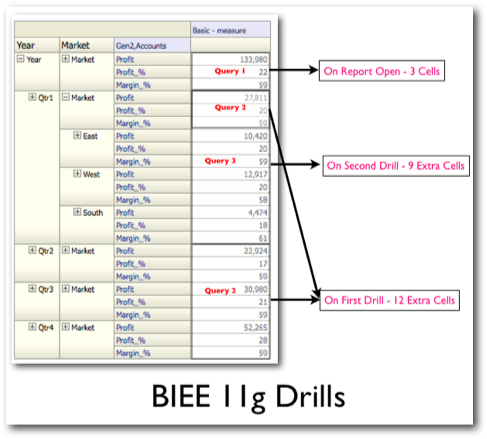
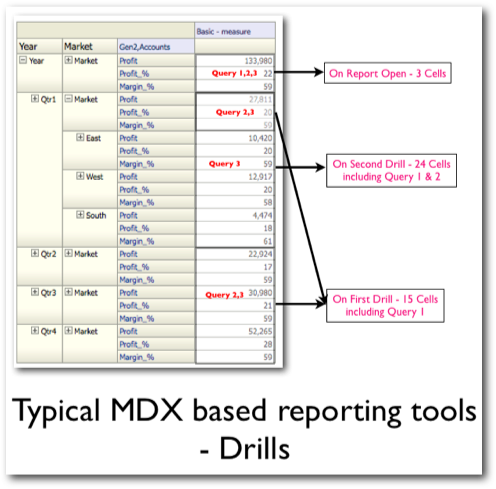
Any reporting tool reporting out of Essbase like Hyperion Financial Reporting, Web Analysis or SmartView will all generate a full MDX for every drill. Thats why when we drill on a big Essbase cube with a very large outline, performance will slowly start degrading once we start drilling deeper and deeper. With BI EE, there is a significant performance optimization. When i started working on this connectivity, i was worried about the effect of multiple MDXs hitting the Essbase cube simultaneously. But as you see, the BI EE 11g-Essbase connectivity is supposed to be much better than the other tools provided we enable the sub-query caching (and as long we stick to row-wise reporting. We will see the effects of pivoting later). The difference between BI EE and other MDX based reporting tools are depicted in the form of a pictorial representation below(the below is applicable only when we are having columns in the row-edge of a pivot).
So, for the BI EE 11g - Essbase connectivity to work in production, caching especially, sub-query caching should be enabled. Once that is done, it is very similar to attribute column based reporting.
Conceptually this is very good. Let's now add some more complexities to the above report like Selection Steps, Custom Groups etc and see what happens.
Custom Groups & Selection Steps:
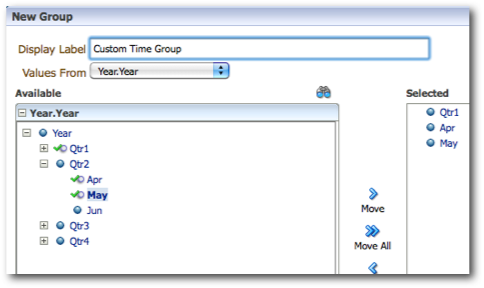
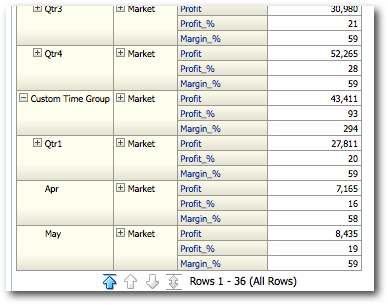
Since we are dealing with Hierarchical columns, lets add a custom group where the members are from different levels in a hierarchy. For example, lets group, Qtr1, April and May as shown below
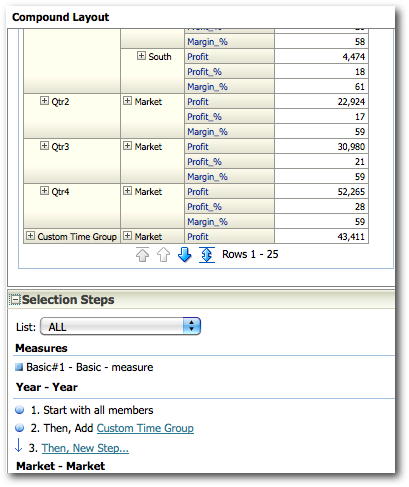
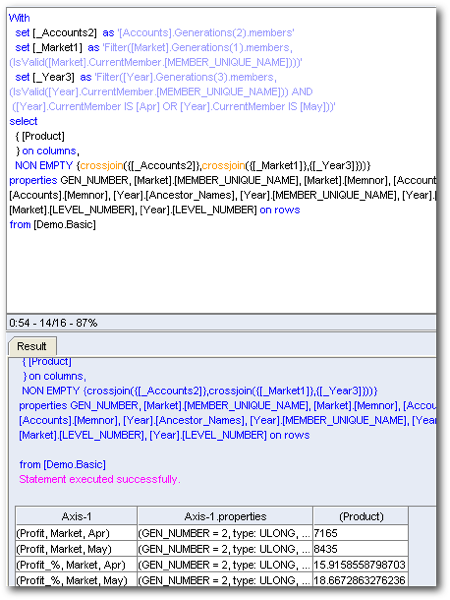
Since this has got added as a new selection step, this will be pushed in as a new Selection Step. This in turn will generate a new MDX as shown below.
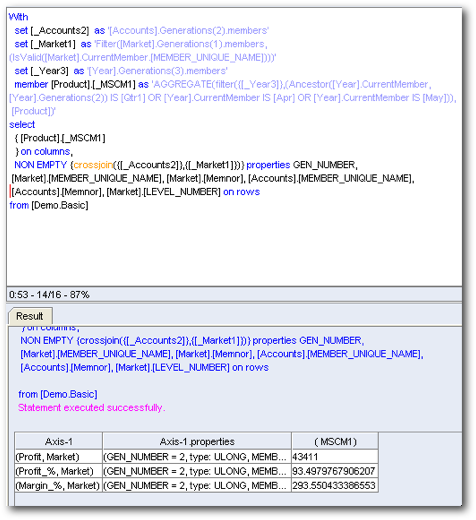
Again a pretty good MDX. If you notice, the MDX passes down the AGGREGATE function to sum up the non-existing intersection (Group Total). As long as we had the other report data cached through sub-query caching, this report should theoretically be much faster than the other tools. I am stating in theory as there is a dependency that the BI EE does the stitching of its local cache and MDX data faster than a single MDX query. Let's now drill on this custom group.
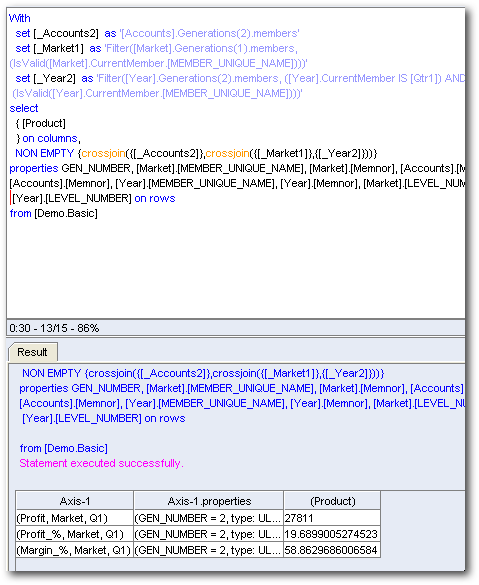
As you notice, BI EE now generates 2 MDX's on the custom Group. Theoretically a single MDX is enough to achieve the same result. But to enable the drill on the Qtr1 column, BI EE had to basically split this into 2 queries. This behaviour is not so good as this can sometimes increase the number of MDX being generated by a report. So wherever possible try avoiding multi-level groupings.
In addition as we noticed yesterday, more the number of selections steps we add, more will be the number of MDX generated (of the order of M POWER N). With that let's move on to case 2 where the only change will be the hierarchy type to Value based hierarchies.
Case 2: PA - External Aggregation, BA - External Aggregation, HT - All dimensions marked as Unbalanced except Product which will have Value Based Hierarchy, MT - Single Measure Essbase type model
The only difference between Case 1 and Case 2 is the hierarchy type of Product dimension.
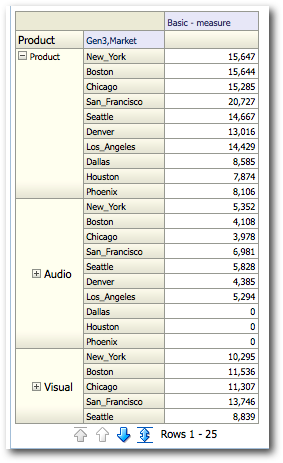
Let's now create a report containing the Product dimension and the single measure as shown below.
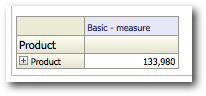
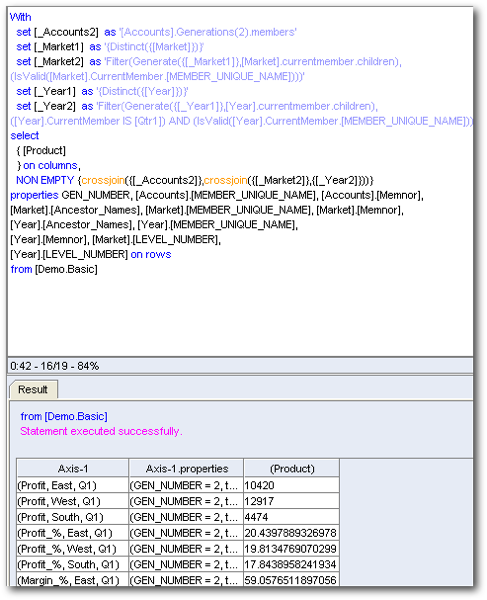
Value based hierarchies are new in 11g. So, lets take a look at the MDX of the above report.
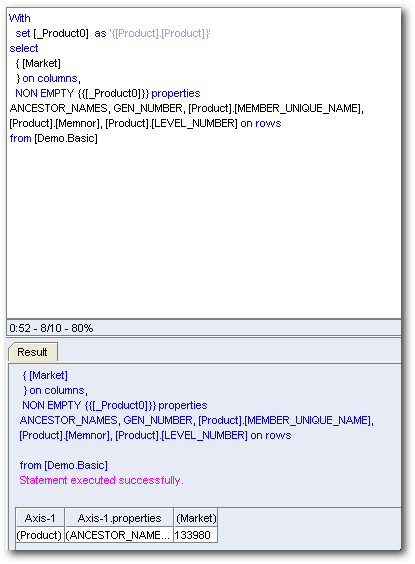
Very much on the expected lines. Let's now drill on the Product dimension and see what happens.
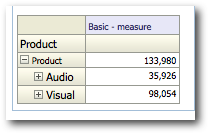
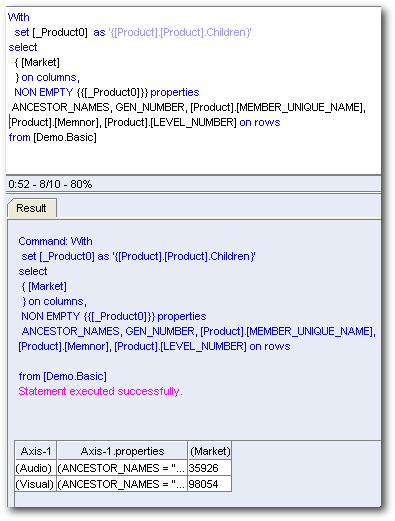
There will be 2 queries as expected. The first one will be same as the one listed above. The second one will extract all the children of the member that we are drilling on. Very interesting. As you notice, we do not see any references of any generation etc in this MDX. Let's now add an attribute column say Gen3, Market and then look at one of the MDX generated.
Another very efficient MDX query. Let's now a bit more complexity to the report by moving the Gen3, Market to the Pivot Column Edge.
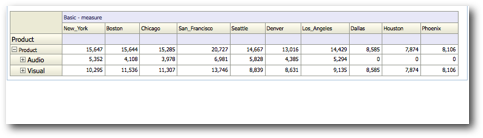
Interestingly this generates 4 MDX queries. Lets look at each one of them.
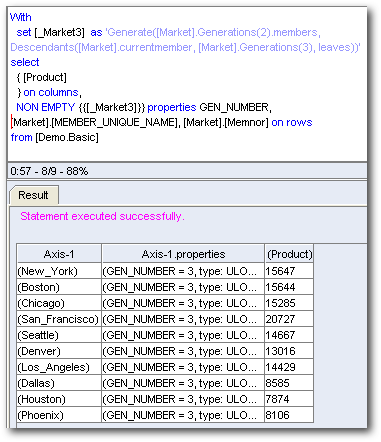
Ok. The first one generates the values for each Gen3, Market at the topmost intersection for [Product] dimension (As column).
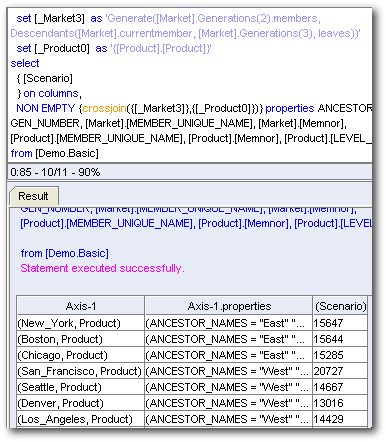
The second one generates the values for each Gen3, Market member & [Product] member at the topmost intersection for [Scenario] dimension (As column)
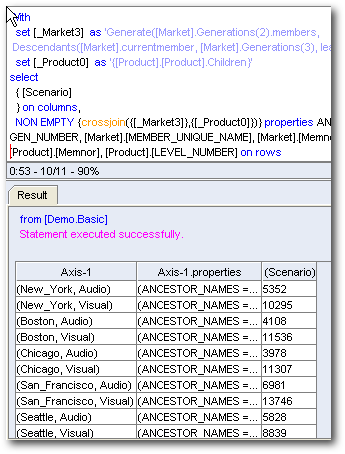
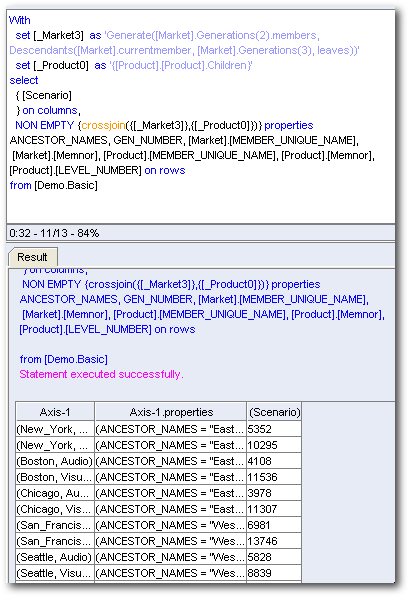
The third one for every Gen3, Market member & [Product].children member at the topmost intersection for the [Scenario] dimension.
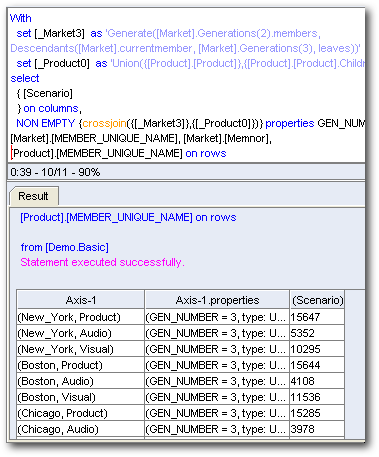
And the last one is for a UNION of [Product] & [Product].children at the intersection of Gen3, Market and [Scenario]. As you can see, this is where BI EE 11g can become very inefficient. Whenever we start pivoting columns, instead of generating a single MDX, it generates 4 MDX queries. Each MDX query parses the same cells over and over again. Not only is this inefficient, this is totally un-necessary. In the next blog post, we shall see how the same pivoting operation affects normal attribute columns as well normal unbalanced hierarchical columns. Also, we will look at potential ways of making these inefficient reports perform well.