Oracle BI EE 11g - Decoding Essbase Connectivity - Part 3
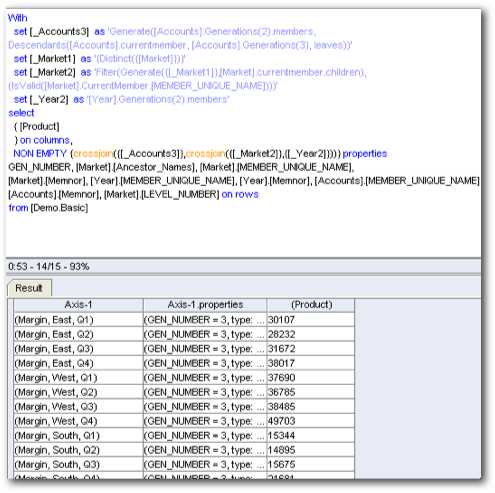
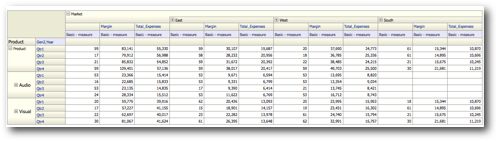
Continuing along with our Essbase series, today lets look at how the various Pivoting operations that are done at the BI EE layer affect the MDX generated. We noticed that whenever we brought in an attribute column from the row-edge to the column edge, the MDX generated by BI EE had become completely in-efficient. Let's analyze that more in detail today. We start off with first creating a new report containing 2 attribute columns (we are still in Case 2) as shown below
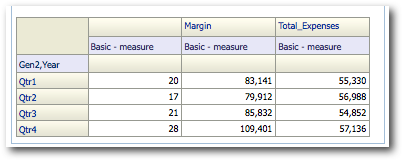
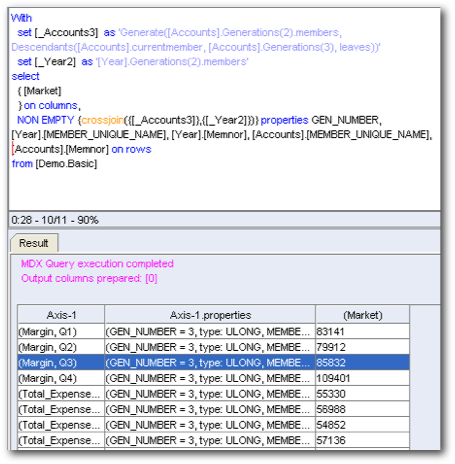
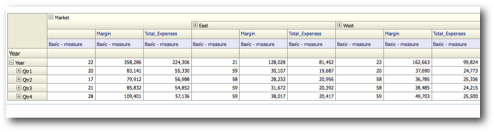
Basically this is a pivot report where one of the attribute columns (Accounts dimension Generation 3) has been moved to the column edge. Let's start with looking at the MDX generated.

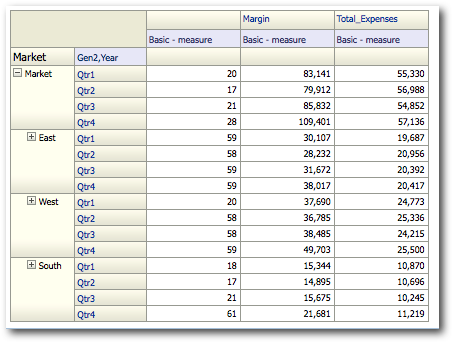
Interestingly, this is a very efficient MDX and this is what other tools would generate as well. Now, why did we see a completely different MDX in the last blog post. To understand that let's try to bring a new hierarchical column (with Unbalanced Hierarchy) Market. And drill to the second generation and then look at the MDX generated.
Interestingly there are 3 MDX that are generated. They are given below
We can clearly see that the last 2 queries are very efficient and are actually needed to produce the right results. But what i am not sure of is the need for the first MDX query. To understand why there are 3 MDX queries, lets take a look at the Logical SQL.
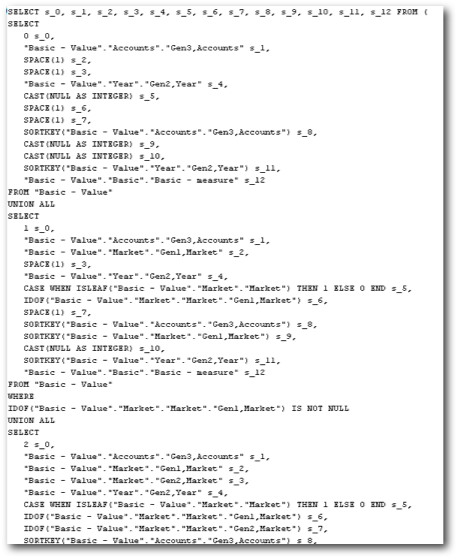
If you notice, there are 2 UNION ALL clauses combining 3 separate Logical SQLs. The first logical SQL and the second one are different only in the filters (i.e a check where the hierarchical column is not null). Lets take each one of these Logical SQLs and fire them separately.
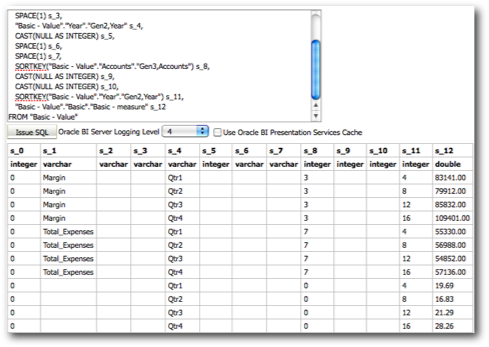
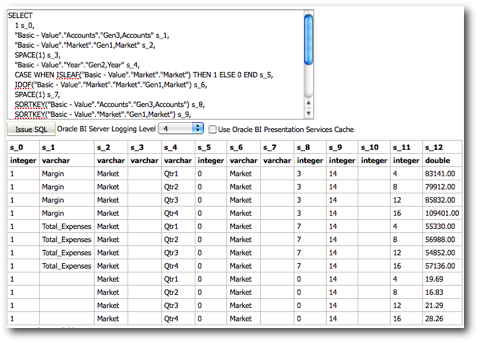
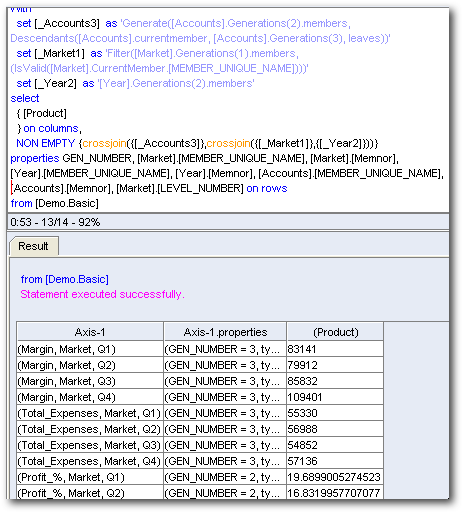
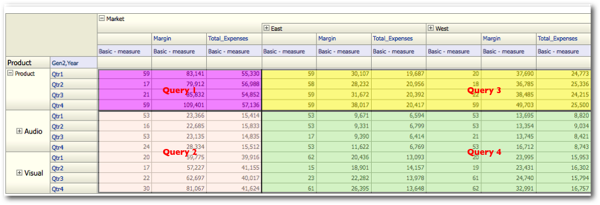
As you see there is no difference at all between these 2 queries apart from the Market member appearing in the 2nd query. Somehow first query seems to be an unwanted query as the 2nd one more or less achieves the same result. Not sure whether this can be classified as a bug but this definitely will add increased overhead on Essbase Servers to fire an extra query. Let's now start making the pivot report a bit more complex. First let's move the Market dimension from the Row edge to the column edge above the Accounts. Then lets add the Product Value hierarchy in the row edge.
A very simple report. This generates in total 6 Logical SQLs combined through UNION ALL. Out of this 6, 4 are expected as seen in the first part (if both the hierarchical columns are in the row-edge we will get only 4 Logical SQLs and in turn 4 MDX). The 4 logical sqls are represented below
a. Generation 1 of Product with Generation 1 of Market
b. Generation 1 of Product with Generation 2 of Market
c. Generation 2 of Product with Generation 1 of Market
d. Generation 2 of Product with Generation 2 of Market
In addition to these 4, the above pivot table generates 2 extra Logical SQLs which to me is somewhat un-necessary. Let's look at the corresponding MDX statements of the additional Logical SQLs
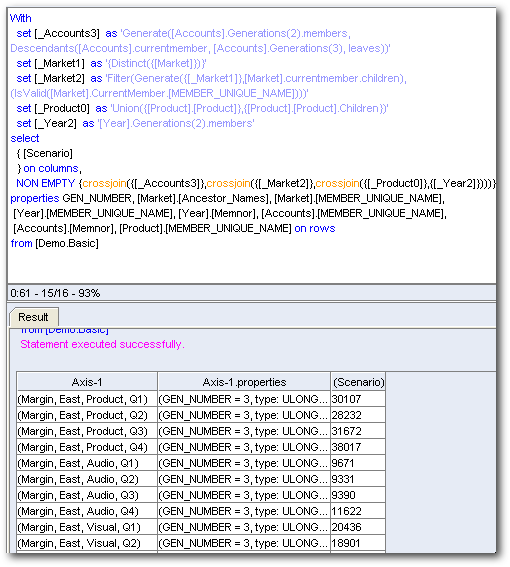
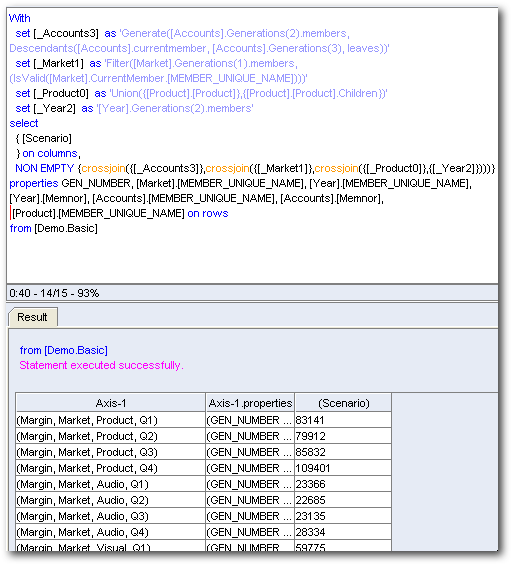
The above 2 MDXs produce results for the same cells already covered by the other 4 MDX statements. This is totally un-necessary and this happens when we include a Value-Based hierarchy. Let's see what happens when we include 2 level based hierarchies instead of value based ones.
Again another massive Logical SQL with 8 sub-logical SQLs this time, each producing its own MDX. There are a couple of things that we can infer from this.
1. BI EE 11g MDX generation is basically an extension of BI EE 10g MDX generation when broken down into individual sub-logical SQLs.
2. The BI Server itself hasn't changed much apart from some additional functions. The core that has changed is the presentation service which translates every interaction into a corresponding logical SQL(each combined through UNION ALLs).
3. The biggest change when it comes to BI EE 11g is the dynamic logical SQL for every drill. The more you drill bigger will be the logical SQL and in turn larger will be the number of MDX fired. There is pure mathematics into this and in the next post let's look at how we can arrive at the number of Logical SQLs generated by a report and also the potential number of MDX generated.