Using SampleApp Scripts to run a Simple OBIEE 11g Load Test
If you've not done so already, I'd advise anyone interested in OBIEE 11g to subscribe to the Oracle BI Tech Demos channel on Youtube, where Philippe Lions and his team showcase upcoming SampleApp releases, and highlight new features like SmartView integration (to be covered later this week on this blog), integration with Oracle R Enterprise, what's coming in the new 11.1.1.7 SampleApp, and OBIEE 11.1.1.7 leveraging the Advanced Analytics Option in Oracle Database 11gR2. One demo that I've been aware of for some time via the Exalytics program, and that's also featured in the Tech Demos channel, is a load test demo that uses scripts and internal OBIEE features to run the test, and is used by Oracle to show how many concurrent users an Exalytics server can handle.
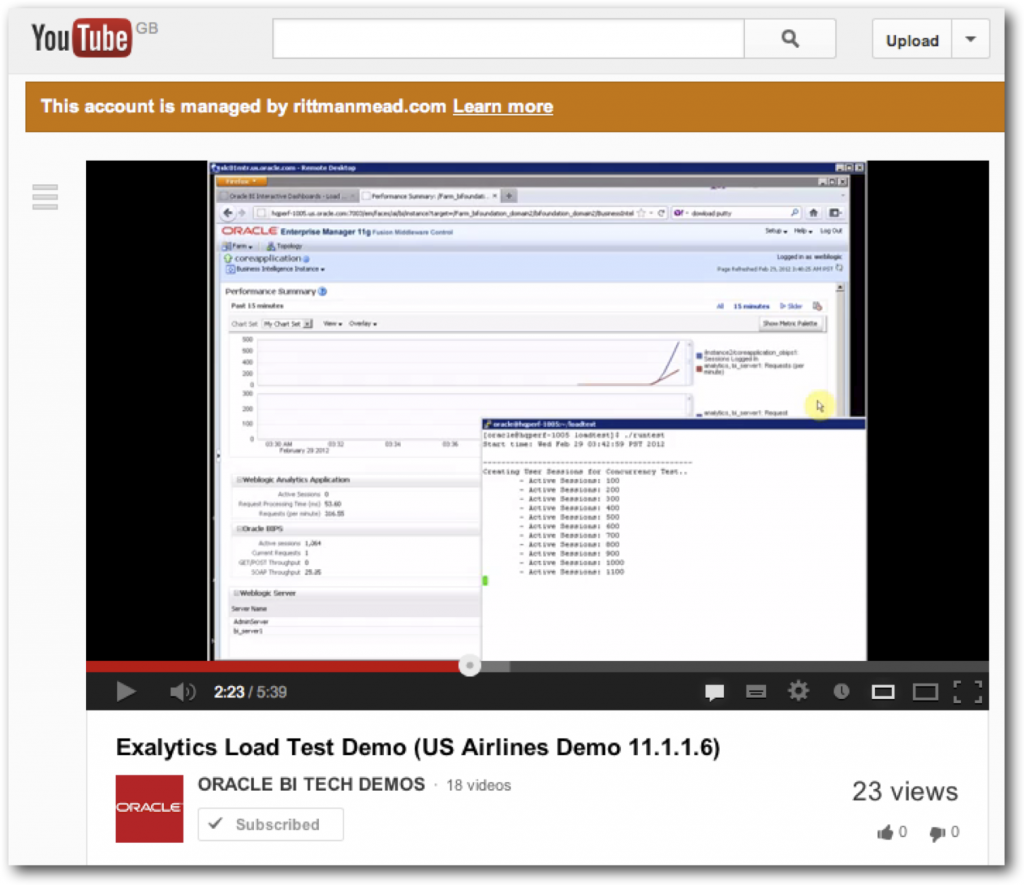
What's particularly interesting about this load test though is that it doesn't require any external tools such as LoadRunner or JMeter, and the scripts it uses are actually shipped with the full v207 SampleApp VirtualBox VM that is downloadable from OTN. On a recent customer engagement a need came up for a "quick and dirty" load test for their system, so I thought I'd go through how this load test example works, and how it can be adapted for use with any other generic OBIEE 11g (11.1.1.6+) environment.
In the example used in the Youtube video, a report (which actually looks like a dashboard page, but is actually an single analysis compound layout containing two graph views, and a pivot table view) is set up with a special set of filter values; when requested, this analysis will use "randomised" filter values so that response times aren't skewed by the same values being used each time, and a controlling process outside of the dashboard ramps up 10, 100, 200 and so on separate sessions up to a maximum of 2,000, to simulate the sort of user numbers that an Exalytics server might be required to support.

Then, when the load test is running, the metric display within Fusion Middleware Control is used to show how the server copes with the load (in terms of # of sessions, average response time per query etc), as well as a dashboard page based off of the usage tracking data that shows a similar set of information.

Now of course the reason this sort of test data is important (apart from selling Exalytics servers) is that a report that takes 10 seconds to run, on a system otherwise unused and with only you running queries, might take considerably longer to run when all your users are on the system, due to factors such as disk contention, queuing on database server and mid-tier server CPUs, parallel query getting scaled-back when more than a few users try to run reports at the same time, and so on - so you need to do this sort of load test before unleashing your new dashboards onto your user community. But performing a load test is hard - just ask our Robin Moffatt - so having a ready-made system shipped with SampleApp, that doesn't require additional software, certainly sounds interesting. So how does it work?
The scripts that control the load test process are contained within the /home/oracle/scripts/loadtest folder on SampleApp, and look like this within the Linux file manager:

The folder actually contains three scripts, and a Java JAR archive file:
- runtest actually runs the load test
- users_list.txt is a set of usernames, that are central to the load test process (more on this in a moment)
- Loadtest_README.txt is the instruction file, and
- LoadTest.jar is a Java program that is called by runtest to log into OBIEE and request the report
Looking through the readme file, the way the process works is that you need to create a set of users with a common password within the OBIEE LDAP directory, and put their usernames in the users_list.txt file. Then, the LoadTest.jar file is called by the runtest script, passing the hostname and port number of the WebLogic server hosting Presentation Services, the path to the analysis that you wish to test against, and the common password, and the script will then initiate a session for each user and then run the report.
Looking at the list of names in the users_list.txt file is interesting, because they all appear to be airport three-letter codes; for example:
SAN
SAT
SAV
SBA
SBN
SBP
MKC
MKE
MKG
MLB
MLI
MLU
MMH
The reason for this becomes clear when you look at the filters behind the analysis that the runtest script calls; to provide the filter predicate randomisation, each run of the report uses the username to filter the origin airport selection, and the other filter values are generated through MOD and RAND functions that in essence, generate random values for each call of the report. So given that we're not all going to want to test reports based on airport codes, and how the overall testing process works, this presents two challenges to us:
- How we generate a very large number of user accounts with a common password, given that the test process runs the report just once for each user, and how we get rid of these accounts once we've finished the testing.
- How we configure the report we want to test to generate "random" filter values - the approach Oracle took with this example is quite "clever", but we'll need to come up with something equally clever if we want to do this for our report.
Question 1 seems extricably linked to question 2, so let's create an example report that we can easily randomise the values for, create a number of views that we can include in a compound layout as Oracle did in the load test demo, and give it a go.
Taking the SampleApp dataset and the A - Sample Sales subject area, let's create an analysis that has the following columns in the analysis criteria:
- Products.P2 Product Type
- Time.T03 Per Name Qtr
- Time.T02 Per Name Month
- Customer.C3 Customer Type
- Ship To Regions.R50 Region
- Base Facts.1 - Revenue
- Base Facts.1 - Discount Amount
For good measure, create another derived measure, called Base Facts.1 - Gross Revenue, which uses the formula:
- "Base Facts"."1- Revenue"+"Base Facts"."3- Discount Amount"
and then create some views off of this criteria so that your analysis looks something along these lines:

Now comes the tricky part of randomising it. We could take the approach that Oracle took with the Airlines load test example and create, for example, a user for each country in the dataset, but instead let's use Logical SQL's RAND function to pick a region and calendar quarter at random, and then three of the five customer types, to use as the analysis filters. To do this, we create a filter against this column in the analysis criteria and then convert the filter to SQL, using something like the following SQL clause to filter the quarter randomly:
"Time"."T03 Per Name Qtr" in (
SELECT a.s_1 from
(SELECT
0 s_0,
"A - Sample Sales"."Time"."T03 Per Name Qtr" s_1,
RAND()*100 s_2
FROM "A - Sample Sales"
WHERE
(BOTTOMN(RAND()*100,1) <= 1)
ORDER BY 1, 2 ASC NULLS LAST, 3 ASC NULLS LAST
FETCH FIRST 5000001 ROWS ONLY) a
)
The same goes for the region filter, which we define as:
"Ship To Regions"."R50 Region" in (
SELECT a.s_1 from
(
SELECT
0 s_0,
"A - Sample Sales"."Ship To Regions"."R50 Region" s_1,
RAND()*100 s_2
FROM "A - Sample Sales"
WHERE
(BOTTOMN(RAND()*100,1) <= 1)
ORDER BY 1, 2 ASC NULLS LAST, 3 ASC NULLS LAST
FETCH FIRST 5000001 ROWS ONLY) a )
whereas for the customer type filter, we return the top 3 ordered (random) values, not just the first one:
"A - Sample Sales"."Customers"."C3 Customer Type" in
( SELECT a.s_1
FROM
(SELECT
0 s_0,
"A - Sample Sales"."Customers"."C3 Customer Type" s_1,
DESCRIPTOR_IDOF("A - Sample Sales"."Customers"."C3 Customer Type") s_2,
RAND()*100 s_3
FROM "A - Sample Sales"
WHERE
(BOTTOMN(RAND()*100,3) <= 3)
ORDER BY 1, 2 ASC NULLS LAST, 4 ASC NULLS LAST
FETCH FIRST 5000001 ROWS ONLY) a )
Now when you run the report you should see different filter selections being used each time you run it, similar to what's shown in the preview screenshot below.

One thing I noticed at this stage is, whilst the customer type filtering returned three values, only one would ever be used in the graph prompt, because that's how prompts in a view work vs. the multi-select prompts you get as dashboard prompts. So I then needed to move the customer type column from the prompts are to the Pies and Slices > Pies part of the graph layout (so I then got one pie chart per customer type, not just the one type I was seeing via the graph prompt before), so that my final report looked like this:

and my analysis criteria, including these special filters, looked like this:

Next we need to create an initial set of users so that we can perform the concurrency test. I do this by using the WebLogic Scripting Tool (WLST) script shown below which creates 30 users, assigns them to an LDAP group and then adds that group to the BIConsumers LDAP group, so that they can run the analysis in question (if you're new to WLST or are interested in reading a bit more about it, take a look at this Oracle Magazine of mine that explains the feature).
serverConfig()
password = 'welcome1'
atnr=cmo.getSecurityConfiguration().getDefaultRealm().lookupAuthenticationProvider('DefaultAuthenticator')
group = 'Loadtest-Users'

atnr.createGroup(group,group)
atnr.addMemberToGroup('BIConsumers','Loadtest-Users')
users = ['user1','user2','user3','user4','user5','user6','user7','user8','user9','user10','user11','user12',

'user13','user14','user15','user16','user17','user18','user19','user20','user21','user22','user23','user24',

'user25','user26','user27','user28','user29','user30']

for user in users:

atnr.createUser(user,password,user)

atnr.addMemberToGroup(group,user)
After saving the WLST script to the /home/oracle/scripts/loadtest folder as create_users.py, I then go back to my Mac workstation and SSH into the SampleApp VirtualBox VM to run the script:
Last login: Sat Apr 20 12:58:38 on ttys000
markmacbookpro:~ markrittman$ ssh oracle@obieesampleapp.rittmandev.com
oracle@obieesampleapp.rittmandev.com's password:
Last login: Sun Apr 21 17:13:37 2013 from 192.168.2.31
[oracle@obieesampleapp ~]$ cd obiee/Oracle_BI1/common/bin
[oracle@obieesampleapp bin]$ ./wlst.sh
wls:/offline> connect('weblogic','Admin123','localhost:7001')

Connecting to t3://localhost:7001 with userid weblogic ...

Successfully connected to Admin Server 'AdminServer' that belongs to domain 'bifoundation_domain'.
Warning: An insecure protocol was used to connect to the

server. To ensure on-the-wire security, the SSL port or

Admin port should be used instead.
wls:/bifoundation_domain/serverConfig> execfile('/home/oracle/scripts/loadtest/create_users.py')

Already in Config Runtime
wls:/bifoundation_domain/serverConfig> exit()
Exiting WebLogic Scripting Tool.
Then using the same SSH session I create a new users_list.txt file containing the usernames of these 30 users (use CTRL-D in a Unix session to send the EOF signal to CAT, and stop copying text into the users_list.txt.new file)
[oracle@obieesampleapp bin]$ cd /home/oracle/scripts/loadtest/
[oracle@obieesampleapp loadtest]$ cat > users_list.txt.new

user1

user2

user3

user4

user5

user6

user7

user8

user9

user10

user11

user12

user13

user14

user15

user16

user17

user18

user19

user20

user21

user22

user23

user24

user25

user26

user27

user28

user29

user30
[oracle@obieesampleapp loadtest]$ mv ./users_list.txt users_list.txt.original

[oracle@obieesampleapp loadtest]$ mv ./users_list.txt.new users_list.txt
Finally, I then edit the runtest script to change the path to point to the analysis I created earlier, update the password setting for the users:
[oracle@obieesampleapp loadtest]$ vi ./runtest
so that the final runtest file looks like this:
[oracle@obieesampleapp loadtest]$ cat ./runtest

export JAVA_HOME=/home/oracle/obiee/Oracle_BI1/jdk

export PATH=$JAVA_HOME/bin:$PATH

export CLASSPATH=$CLASSPATH:$JAVA_HOME/lib
echo "Start time: date"

echo "Load Test Starting..."

java -jar LoadTest.jar "localhost" "7001" "/shared/loadtest/SampleAnalysis" "welcome1"

echo "Load Test Completed..."

echo "End time: date"
Now, we've got everything we need for the initial test; an analysis to run, a set of users to run it with, and the JAR file to perform the test. So let's give it a go...
[oracle@obieesampleapp loadtest]$ chmod a+x runtest
[oracle@obieesampleapp loadtest]$ ./runtest
Start time: Sun Apr 21 18:21:39 PDT 2013
Load Test Starting...
Creating User Sessions for Concurrency Test..
Total active sessions: 30
Initiating Queries..
Total queries initiated: 30
Cleaning up User Sessions created for Concurrency Test..
- Remaining Active Sessions: 30
Completed User Sessions Cleanup
Load Test Completed...
End time: Sun Apr 21 18:21:54 PDT 2013
Where it gets interesting though is when you go over to Fusion Middleware Control, and view the DMS metrics graphs at Capacity Management > Metrics > View the full set of system metrics, where you can then see various metrics such as # of active sessions, request processing time (i.e. how long the analysis took to run), and # requests per minute.

But of course, our current test only runs thirty queries through our thirty users, so its not much of a concurrency test; also, I've got caching enabled, so I'd expect the figure to look fairly good (though this may be what we use in real-life, so the key thing is to make the test as close a reflection of your actual system as possible).
To create a more realistic test in terms of user numbers, there's a couple of options you can use; one option, and the one I use, is to copy the same set of users over and over again into the users_list.txt file, to the point where there are hundreds of rows in the file to simulate hundreds of sessions. Another approach, and perhaps the more purist, is to create many more user accounts and have each one only run one or two reports, but that involves creating the required amount of users and then deleting them afterwards from the LDAP server. I'll go for the first option, using the following Unix commands within my SSH session to copy the file back onto itself many times, giving me at the end around 1600 users to use in my concurrency test:
[oracle@obieesampleapp loadtest]$ wc -l users_list.txt
30 users_list.txt
[oracle@obieesampleapp loadtest]$ cat users_list.txt users_list.txt users_list.txt users_list.txt users_list.txt users_list.txt users_list.txt users_list.txt users_list.txt users_list.txt >> big_users_list.txt
[oracle@obieesampleapp loadtest]$ wc -l big_users_list.txt
420 big_users_list.txt
[oracle@obieesampleapp loadtest]$ cat big_users_list.txt big_users_list.txt big_users_list.txt big_users_list.txt > users_list.txt
[oracle@obieesampleapp loadtest]$ wc -l users_list.txt
1680 users_list.txt
FInally I run the test again, to simulate 1600 users running queries at once:
[oracle@obieesampleapp loadtest]$ ./runtest
Start time: Sun Apr 21 18:42:42 PDT 2013
Load Test Starting...
Creating User Sessions for Concurrency Test..
- Active Sessions: 100
- Active Sessions: 200
- Active Sessions: 300
- Active Sessions: 400
- Active Sessions: 500
- Active Sessions: 600
- Active Sessions: 700
- Active Sessions: 800
- Active Sessions: 900
- Active Sessions: 1000
- Active Sessions: 1100
- Active Sessions: 1200
- Active Sessions: 1300
- Active Sessions: 1400
- Active Sessions: 1500
- Active Sessions: 1600
Total active sessions: 1680
Initiating Queries..
- Queries initiated: 100
- Queries initiated: 200
- Queries initiated: 300
- Queries initiated: 400
- Queries initiated: 500
- Queries initiated: 600
- Queries initiated: 700
- Queries initiated: 800
- Queries initiated: 900
- Queries initiated: 1000
- Queries initiated: 1100
- Queries initiated: 1200
- Queries initiated: 1300
- Queries initiated: 1400
- Queries initiated: 1500
- Queries initiated: 1600
Total queries initiated: 1680
Cleaning up User Sessions created for Concurrency Test..
- Remaining Active Sessions: 1680
- Remaining Active Sessions: 1600
- Remaining Active Sessions: 1500
- Remaining Active Sessions: 1400
- Remaining Active Sessions: 1300
- Remaining Active Sessions: 1200
- Remaining Active Sessions: 1100
- Remaining Active Sessions: 1000
- Remaining Active Sessions: 900
- Remaining Active Sessions: 800
- Remaining Active Sessions: 700
- Remaining Active Sessions: 600
- Remaining Active Sessions: 500
- Remaining Active Sessions: 400
- Remaining Active Sessions: 300
- Remaining Active Sessions: 200
- Remaining Active Sessions: 100
Completed User Sessions Cleanup
Load Test Completed...
End time: Sun Apr 21 18:45:34 PDT 2013
Going back over to EM, I can see the load building up on the server and the response time increasing.

Notice though how the response time actually starts to fall as more queries run? That's most probably caching kicking in, so next time I'll disable caching completely and run the test again. But for now though, this is the Oracle load test script running, and the steps I've outlined here should allow you to run a similar test yourself. Thanks to Phillipe and the Oracle BI Tech Demos team for this, and on a similar topic I'll be previewing the new v303 11.1.1.7 SampleApp in a posting tomorrow.