Built-In OBIEE Load Testing with nqcmd

nqcmd ships with all installations of OBIEE and includes some very useful hidden functionality - the ability to generate load tests against OBIEE. There are lots of ways of generating load against OBIEE, but most require third party tools of varying degrees of complexity to work with.
It’s easy to try this out. First set the OBIEE environment: [I'm using SampleApp v309R2 as an example; your FMW_HOME path will vary]
. ~/obiee/instances/instance1/bifoundation/OracleBIApplication/coreapplication/setup/bi-init.sh
and then the “open sesame” setting which enables the hidden nqcmd functionality:
export SA_NQCMD_ADVANCED=Yes
On Windows, run set SA_NQCMD_ADVANCED=YES instead. If you don't set this environment variable then nqcmd just throws an error if you try to use one of the hidden options.
Now if you list the available options for nqcmd you’ll see lots of new options in addition to the usual ones:
Command: nqcmd - a command line client which can issue SQL statements
                 against either Oracle BI server or a variety
                 of ODBC compliant backend databases.
SYNOPSIS
         nqcmd [OPTION]...
DESCRIPTION
         -d<data source name>
         -u<user name>
         -p<password>
         -s<sql input file name>
         -o<output result file name>
         -D<Delimiter>
         -b<super batch file name>
         -w<# wait seconds>
         -c<# cancel interval seconds>
         -C<# number of fetched rows by column-wise binding>
         -n<# number of loops>
         -r<# number of requests per shared session>
         -R<# number of fetched rows by row-wise binding>
         -t<# number of threads>
         -T (a flag to turn on time statistics)
         -a (a flag to enable async processing)
         -f (a flag to enable to flush output file for each write)
         -H (a flag to enable to open/close a request handle for each query)
         -z (a flag to enable UTF8 in the output result file
         -utf16 (a flag to enable UTF16 for communicating to Oracle BI ODBC driver)
         -q (a flag to turn off row output)
         -NoFetch (a flag to disable data fetch with query execution)
         -SmartDiff (a flag to enable SmartDiff tags in output)
         -NotForwardCursor (a flag to disable forwardonly cursor)
         -v (a flag to display the version)
         -P<the percent of statements to disable cache hit>
         -impersonate <the impersonate username>
         -runas <the runas username>
         -td <the time duration to run >
         -qsel <the query selection>
         -ds <the dump statistics duration in secs>
         -qstats <print Query statistics at end of run>
         -login <login scenario for PSR. login/execute sqls/logout for sql file>
         -ShowQueryLog <to display query log from server, -H is required for this setting>
         -i <ramup interval for each user for load testing, -i is required for this setting>
         -ONFormat<FormatString, i.e. TM9, 0D99>
You’re own your own figuring the new options out as they’re not documented (and therefore presumably not supported and liable to change or be dropped at any time). What I’ve done below is my best guess at how to use them - don’t take this as gospel. The one source that I did find is a post on Oracle's CEAL blog: OBIEE 11.1.1 - Advanced Usage of nqcmd command, from which I've taken some of the detail below.
Let’s have a look at how we can generate a load test. First off, I’ll create a very simple query:
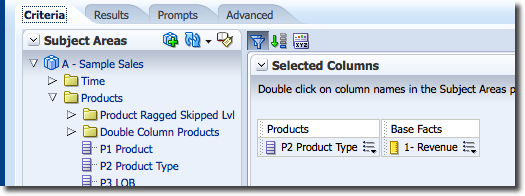
SELECT
   0 s_0,
   "A - Sample Sales"."Products"."P2  Product Type" s_1,
   "A - Sample Sales"."Base Facts"."1- Revenue" s_2
FROM "A - Sample Sales"
ORDER BY 1, 2 ASC NULLS LAST
FETCH FIRST 5000001 ROWS ONLY
This Logical SQL I’ve saved to a file, report01.lsql.
To run this Logical SQL from nqcmd I use the standard (documented) syntax, passing the Logical SQL filename with the -s flag:
[oracle@obieesample loadtest]$ nqcmd -d AnalyticsWeb -u Prodney -p Admin123 -s report01.lsql

-------------------------------------------------------------------------------
          Oracle BI ODBC Client
          Copyright (c) 1997-2013 Oracle Corporation, All rights reserved
-------------------------------------------------------------------------------

Connection open with info:
[0][State: 01000] [DataDirect][ODBC lib] Application's WCHAR type must be UTF16, because odbc driver's unicode type is UTF16
SELECT
   0 s_0,
   "A - Sample Sales"."Products"."P2  Product Type" s_1,
   "A - Sample Sales"."Base Facts"."1- Revenue" s_2
FROM "A - Sample Sales"
ORDER BY 1, 2 ASC NULLS LAST
FETCH FIRST 5000001 ROWS ONLY
[...]

0            Smart Phones   6773120.36
--------------------
Row count: 11
--------------------

Processed: 1 queries
Adding the -q flag will do the same, but suppress the data output:
oracle@obieesample loadtest]$ nqcmd -d AnalyticsWeb -u Prodney -p Admin123 -s report01.lsql -q

[...]
----------------------------------------------------------------------
Row count: 11
-------------------------------------------------------------------------------------------------------------
Processed: 1 queries
The basic parameters for load testing are
-t- how many threads [aka Virtual Users]-td- test duration-ds- how frequently to write out load test statistics-T- enable time statistics [without this they will not be reported correctly]
You also need to supply -o with an output filename. Even if you’re not writing the data returned from the query to disk (which you shouldn't, and -q disables), nqcmd needs this in order to be able to write its load test statistics properly (I got a lot of zeros and nan otherwise). In addition, the -T (Timer) flag should be enabled for accurate timings.
So to run a test for a minute with 5 threads, writing load test stats to disk every 5 seconds, you’d run:
nqcmd -d AnalyticsWeb -u Prodney -p Admin123 -s report01.lsql -q -T -td 60 -t 5 -ds 5 -o output
The load test stats are written to a file based on the name given in the -o parameter, with a _Counters.txt suffix:
$ cat output_Counters.txt
                        nQcmd Load Testing
TimeStamp       Sqls/Sec        Avg RT  CumulativePrepareTime   CumulativeExecuteTime   CumulativeFetchTime
00:00:05        56.200000       0.065925        2.536000                13.977000               2.012000
00:00:10        66.800000       0.065009        5.641000                33.479000               4.306000
00:00:15        69.066667       0.066055        8.833000                52.234000               7.366000
00:00:20        73.100000       0.063984        11.978000               71.944000               9.622000
[...]
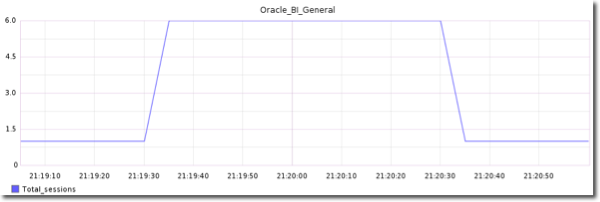
Using obi-metrics-agent to pull out the OBIEE metrics and Graphite to render them we can easily visualise what happened when we ran the test. The Oracle_BI_General.Total_sessions metric shows:
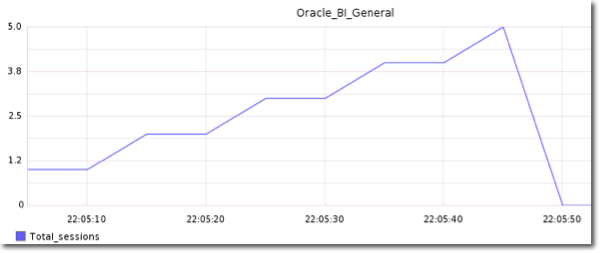
Ramping Up the Load
nqcmd also has a -i parameter, to specify the ramp up per thread. Most load tests should incorporate a “ramp up”, whereby the load is introduced gradually. This is important so that you don’t overwhelm a server all at once. It might be the server will not support the total number of users planned, so by using a ramp up period you can examine the server’s behaviour as the load increases gradually, spotting the point at which the wheels begin to come off.
The -i parameter for nqcmd is the delay between each thread launching, and this has an interesting effect on the duration of the test. If you specify a test duration (-td) of 5 seconds, five threads (-t), and a rampup (-i) of 10 seconds the total elapsed will be c.55 seconds (5x10 + 5).
I've used the standard time command on Linux to validate this by specifying it before the nqcmd call.
$ time nqcmd -d AnalyticsWeb -u Prodney -p Admin123 -s report01.lsql -q -td 5 -t 5 -ds 1 -o $(date +%Y-%m-%d-%H%M%S) -T -i 10

[...]

real    0m56.896s
user    0m2.350s
sys     0m1.434s
So basically the -td is the "Steady State" once all threads are ramped up, and the literal test duration is equal to (rampup * number of threads) + (desired steady state)
The above ramp-up can be clearly seen:
BTW a handy trick I've used here is to use a timestamp for the output name so that the Counter.txt from one test doesn't overwrite another, by specifying date using an inline bash command :
nqcmd [...] -o $(date +%Y-%m-%d-%H%M%S) [...]
Whilst we're at it for tips & tricks - if you want to stop nqcmd running but Ctrl-C isn't instant enough for you, the following will stop it in its tracks:
pkill -9 nqcmd
Wait a Moment...
...or two. Wait time, or "think time", is also important in producing a realistic load test. Unless you want to hammer your server just for the lulz to see how fast you can overload it, you'll want to make sure the workload you're simulating represents how it is actually used -- and in reality users will be pausing (thinking) between report requests. The -w flag provides this option to nqcmd.
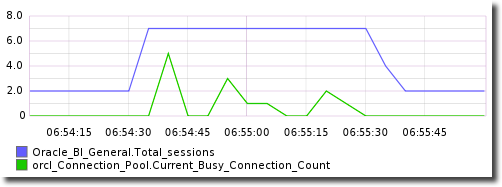
In this test below, whilst the Total Sessions is as before (no ramp up), the Connection Pool shows far fewer busy connections. On previous tests the busy connections were equal to the number of active threads, because the server was continuously running queries.
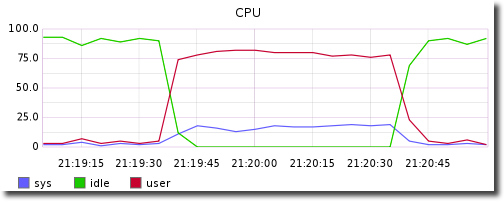
And the CPU, which in the previous test was exhausted at five users with no wait time, now is a bit more relaxed
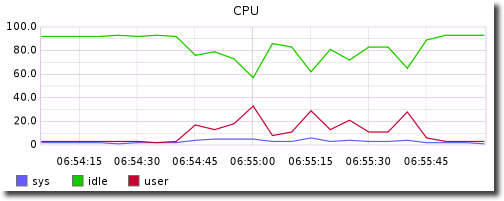
for comparison, this was the CPU in the first test we ran (5 threads, no wait time, no ramp up). Note that 'idle' drops to zero, i.e. the CPU is flat-out.
Load Test in Action
Let's combine ramp up and wait times to run a load test and see what we can see in the underlying OBIEE metrics. I'm specifying:
- Write the output to a file with the current timestamp (date, in the format YYYY-MM-DD HH:MM:SS)
-o $(date +%Y-%m-%d-%H%M%S)
- 20 threads
-t 20
- 10 second gap between starting each new thread
-i 10
- 5 second wait between each thread submitting a new query
-w 5
- Run for a total of 230 seconds (20 thread x 10 second ramp up = 200 seconds, plus 30 second steady state)
-td 230
$ date;time nqcmd -d AnalyticsWeb -u weblogic -p Password01 -s queries.lsql -q -T -o $(date +%Y-%m-%d-%H%M%S) -t 20 -ds 5 -td 230 -w 5 -i 10;date
Here's what happened.
- At first, as the users ramp up the Connection Pool gets progressively busier
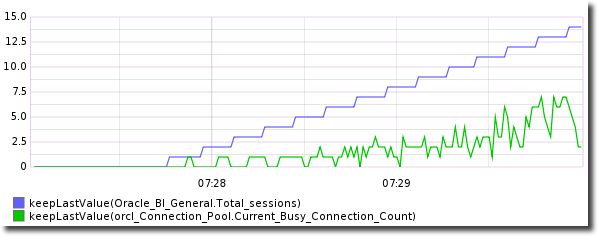
- However, when we hit c.14 threads, things start to go awry. The busy count stays at 10, even though the user count is increasing:
 (This was displayed in flot which you can get to on the /graphlot URL of your Graphite server)
 - So the user count is increasing, but we're not seeing increasing activity on the Connection Pool... so what does that do for the response times?
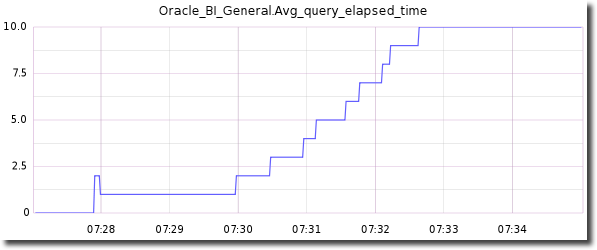 OK, so the Average Query Elapsed Time is a metric I'd normally be wary of, but this is a dedicated server running just my load test workload (and a single query within it) so in this case it's a valid indicator -- and it's showing that the response time it going up. Why's it going up?
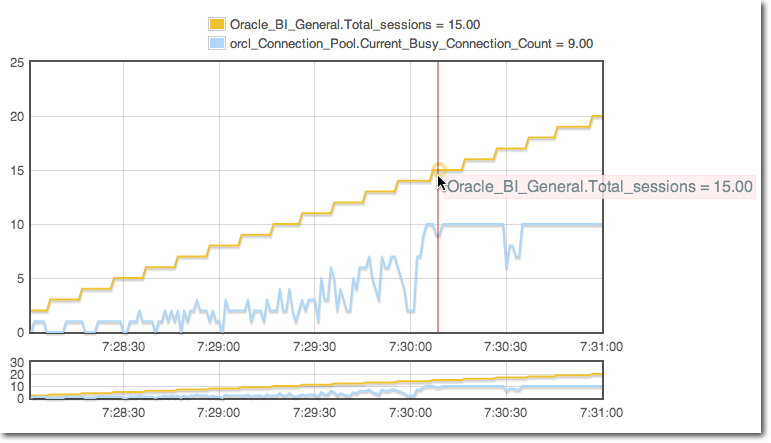
 - Looking more closely at the Connection Pool we can see a problem -- we're hitting the capacity of ten connections, and requests are starting to queue up:
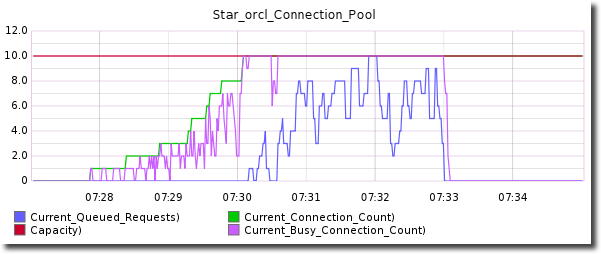 Note how once the Current Busy Connection Count hits the Capacity of ten, the Current Queued Requests value starts to increase -- because the number of users is increasing, trying to run more queries, but having to wait.
So this is a good example of where users would see slow performance, but some of the usual "Silver Bullets" around hardware and the database would completely miss the target, because the bottleneck here is actually in the configuration of the Connection Pool.
If you're interested in hearing more about this subject, make sure you register for the BI Forum in Brighton, 7-9 May where I'm delighted to be speaking for the second time, presenting "No Silver Bullets : OBIEE Performance in the Real World".