Introducing obi-metrics-agent - an Open-Source OBIEE Metrics Collector

Understanding what is going on inside OBIEE is important for being able to diagnose issues that arise, monitor its health, and dig deep into its behaviour under stress in a load test. OBIEE exposes a set of metrics through the Dynamic Monitoring Service (DMS) and viewable through Enterprise Manager (EM) Fusion Middleware Control. EM is a great tool but doesn’t meet all requirements for accessing these metrics, primarily because it doesn’t retain any history.
obi-metrics-agent is a tool that extracts OBIEE’s performance metrics from the Dynamic Monitoring Service (DMS) functionality. Venkat wrote the original version, which I have rewritten in python and added additional functionality. It polls DMS on a specified interval and output the data to a variety of formats. It was written to aid OBIEE performance monitoring either as part of testing or longer-term use. Its features include:
- Multiple output options, including CSV, XML, and Carbon (for rendering in Graphite etc)
- Parse data as it is collected, or write to disk
- Parse data collected previously
How does it work?
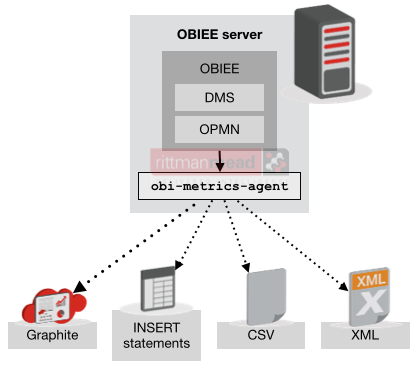
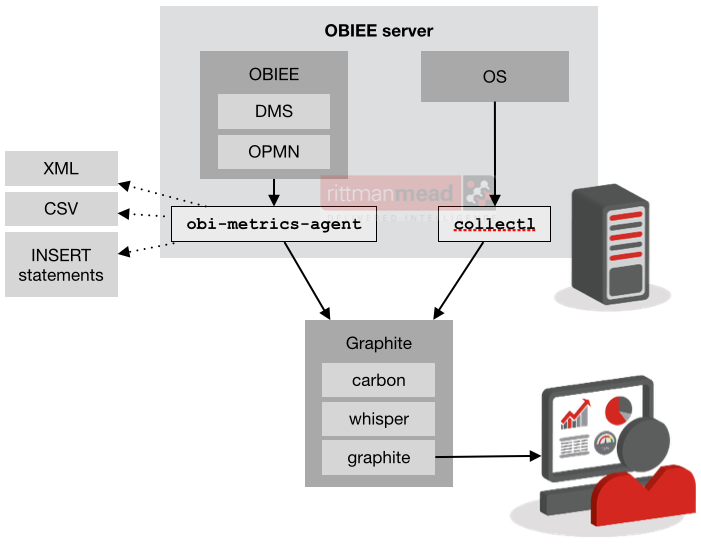
obi-metrics-agent is written in Python, and uses the documented OPMN functionality to expose DMS metrics opmnctl metric op=query. We experimented with the WLST route but found the overhead was too great. OPMN supplies the DMS data as a large XML message, which obi-metrics-agent can either store raw, or parse out into the constituent metrics. It can write these to CSV or XML files, generate INSERT statements for sending them to a database, or send them to graphite (see below).
obi-metrics-agent can also parse previously-extracted raw data, so if you want to store data in graphite but don’t have the server to hand at execution time it can be loaded retrospectively.
On which platforms does it work?
- Tested thoroughly on Oracle Linux 5 and 6
- Works on Windows 2003, should work on later versions
Which OBI metrics are collected?
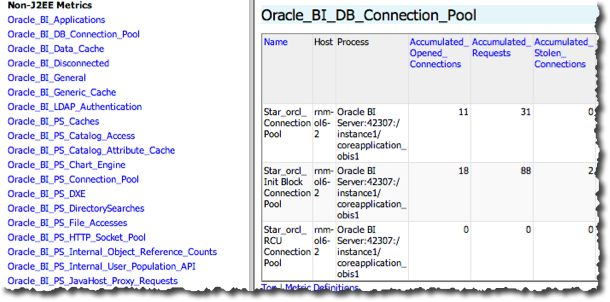
All of the ones that OPMN supports. Currently, BI Server and BI Presentation Services, plus the opmn process metrics (such as CPU time of each OBI component)
To explore the DMS metrics available, you can use Enterprise Manager, or the DMS Spy servlet that is installed by default with OBIEE and available at http://<obi-server>:7001/dms/ (assuming your AdminServer is on port 7001).
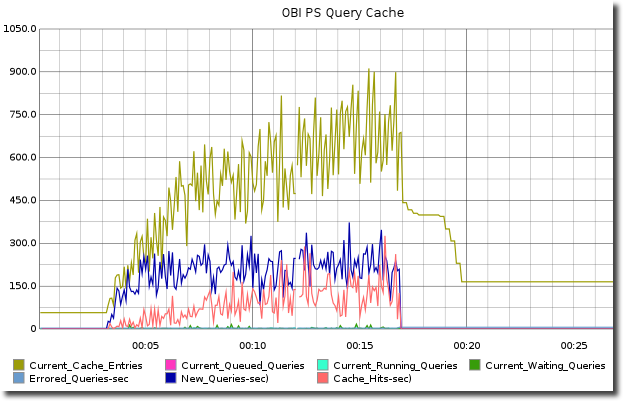
I have used DMS metrics primarily when investigating OBIEE's behaviour under stress in performance testing, but some of the higher-level metrics are useful for day-to-day monitoring too. The DMS metrics let you peer into OBIEE's workings and deduce or hypothesise the cause of behaviour you are seeing.
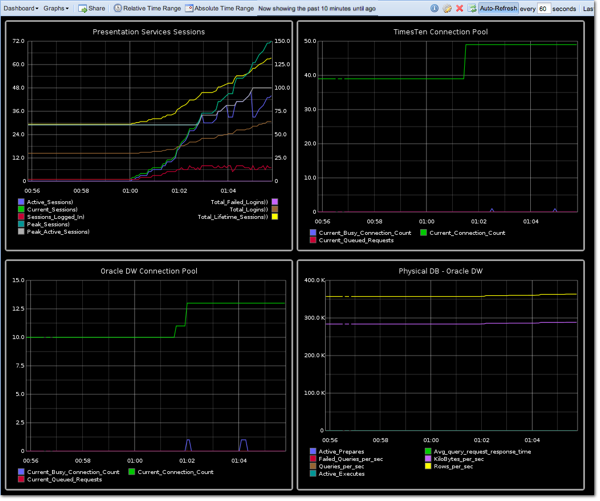
- How many users does OBIEE see as logged in?
- How many active requests are there from Presentation Services to BI Server (nqserver)?
- How many active connections are there from each Connection Pool to the database? How many queued connections?
- What's the average (careful...) response time by database?
- What's the error rate for Presentation Services queries?
- How does the memory profile of each OBIEE component behave during testing?
- How are the BI Server's internal thread pools coping with the load? Do they need resizing?
- How many queries per second are being run on each database?
- How is the graphing engine behaving? Is it queuing requests?
- What's the Presentation Services and BI Server cache hit rate?
Sounds great, where do I get it?
Rittman Mead have released obi-metrics-agent as open source. You can find it on GitHub: https://github.com/RittmanMead/obi-metrics-agent.
Simply clone the repository and run the python script. You need to install the lxml library first - full details are supplied in the repository.
$ export OPMN_BIN=$FMW_HOME/instances/instance1/bin/opmnctl
$ python ./obi-metrics-agent.py

# ===================================================================
# Developed by @rmoff / Rittman Mead (http://www.rittmanmead.com)
# Absolutely no warranty, use at your own risk
# Please include this notice in any copy or reuse of the script you make
# ===================================================================

---------------------------------------
Output format             : csv
raw/csv/xml/carbon/sql    : False/True/False/False/False
Data dir                  : ./data
FMW instance              : None
OPMN BIN                  : /u01/app/oracle/product/fmw/instances/instance1/bin/opmnctl
Sample interval (seconds) : 5
---------------------------------------

--Gather metrics--
        Time of sample: Wed, 26 Mar 2014 10:38:38 +0000 (1395830318)

        Get metrics for coreapplication_obips1
                 Processed :    469 data values @ Wed, 26 Mar 2014 10:38:38 +0000       Oracle BI Presentation Server
                        Appended CSV data to ./data/metrics.csv
        Get metrics for coreapplication_obis1
                 Processed :    230 data values @ Wed, 26 Mar 2014 10:38:38 +0000       Oracle BI Server
                        Appended CSV data to ./data/metrics.csv
        Get metrics for opmn
                 Processed :    91 data values @ Wed, 26 Mar 2014 10:38:38 +0000        opmn
                        Appended CSV data to ./data/metrics.csv

        Processed: 3    Valid: 3 (100.00%)      Invalid: 0 (0.00%)
[...]
See the next blog post for a step-by-step on getting it set up and running using SampleApp v309R2 as an example server, including with Graphite and Collectl for visualising the data and collecting OS stats too.
Visualising the collected data - Graphite
Graphite is an open-source graphing tool that comes with a daemon called carbon that receives incoming data and stores it its own times-series database (called whisper). Graphite is a very popular tool meaning there’s lots of support out there for it and additional tools written to complement it, some of which I’ll be exploring in later blog posts. It’s also very easy to get data into graphite, and because it stores it in a time series you can then display OBIEE DMS data alongside anything else you may have - for example, OS metrics from collectl, or jmeter performance test counters.
Whilst obi-metrics-agent can be used on its own and data stored to CSV for subsequent parsing, or accessing in Oracle as an external table, the focus on this and subsequent blog posts will primarily be on using obi-metrics-agent writing data to graphite and the benefits this brings when it comes to visualising it.
"Graphite?! Haven’t we got a visualisation tool already in OBIEE?"
You can graph this data out through OBIEE, if you want. The OBI metric data can be loaded in by external table from the CSV files, or using the generated INSERT statements.
The benefit of using Graphite is twofold:
- Its primary purpose is graphing time-based metrics. Metrics in, time-based graphs out. You don't need to build an RPD or model a time dimension. It also supports one-click rendering of wildcarded metric groups (for example, current connection count on all connection pools), as well as one-click transformations such as displaying deltas of a cumulative measure.
- It gives an alternative to a dependency on OBIEE. If we use OBIEE we're then rendering the data on the system that we’re also monitoring, thus introducing the significant risk of just measuring the impact of our monitoring! To then set up a second OBIEE server just for rendering graphs then it opens up the question of what’s the best graphing tool for this particular job, and Graphite is a strong option here.
Graphite just works very well in this particular scenario, which is why I use it….YMMV.
Contributing
There are several obvious features that could be added so do please feel free to fork the repository and submit your own pull requests! Ideas include:
- support for scaled-out clusters
- init.d / run as a daemon
- selective metric collection
Known Issues
Prior to OBIEE 11.1.1.7, there was a bug in the opmn process which causes corrupt XML sometimes. This could sometimes be as much as 15% of samples. On corrupt samples, the datapoint is just dropped.
The FMW patch from Oracle for this issue is 13055259.
License
===================================================================
Developed by @rmoff / Rittman Mead (http://www.rittmanmead.com)
Absolutely no warranty, use at your own risk
Please include this notice in any copy or reuse of the script you make
===================================================================
What next?
There are several posts on this has subject to come, including :
- Installing obi-metrics-agent, graphite, and collectl.
- Exploring the graphite interface, building simple dashboards
- Alternative front-ends to graphite