Visualising OBIEE DMS metrics with Graphite

Assuming you have set up obi-metrics-agent and collectl as described in my previous post, you have a wealth of data at your disposal for graphing and exploring in Graphite, including:
- OS (CPU, disk, network, memory)
- OBIEE's metrics
- Metrics about DMS itself
- Carbon (Graphite's data collector agent) metrics
In this post I'll show you some of the techniques we can use to put together a simple dashboard.
Building graphs
First off, let's see how Graphite actually builds graphs. When you select a data series from the Metrics pane it is added to the Graphite composer where you can have multiple metrics. They're listed in a legend, and if you click on Graph Data you can see the list of them.
Data held in Graphite (or technically, held in whisper) can be manipulated and pre-processed in many ways before Graphite renders it. This can be mathmatical transforms of the data (eg Moving Average), but also how the data and its label is shown. Here I'll take the example of several of the CPU metrics (via collectl) to see how we can manipulate them.
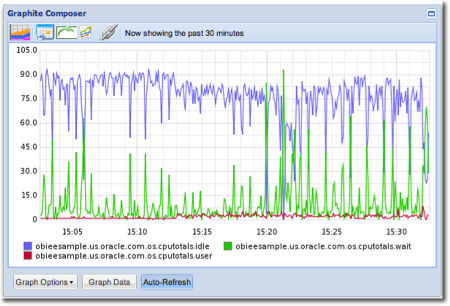
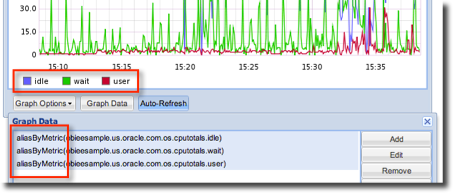
To start with, I've just added idle, wait and user from the cputotals folder, giving me a nice graph thus:
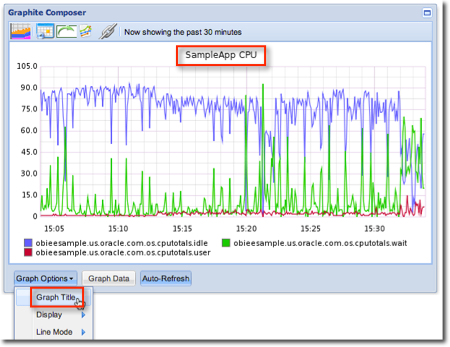
We can do some obvious things like add in a title, from the Graph Options menu
Graphite functions
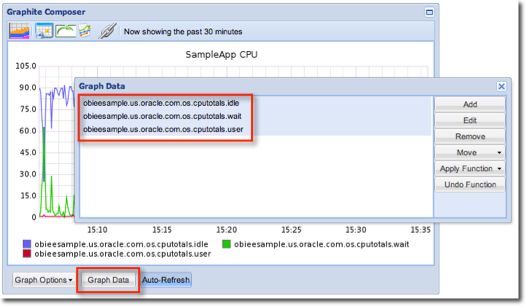
Looking at the legend there's a lot of repeated text (the full qualification of the metric name) which makes the graph more cluttered and less easy to read. We can use a Graphite function to fix this. Click on Graph Data, and use ctrl-click to select all three metrics:
Now click on Apply Function -> Set Legend Name By Metric. The aliasByMetric function is wrapped around the metrics, and the legend on the graph now shows just the metric names which is much smarter:
You can read more about Graphite functions here.
Another useful technique is being able to graph out metrics using a wildcard. Consider the ProcessInfo group of metrics that DMS provides about some of the OBIEE processes:
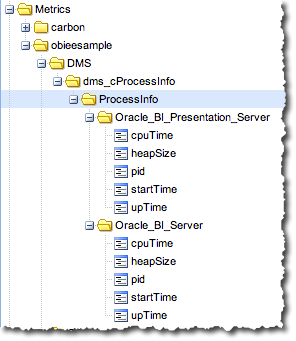
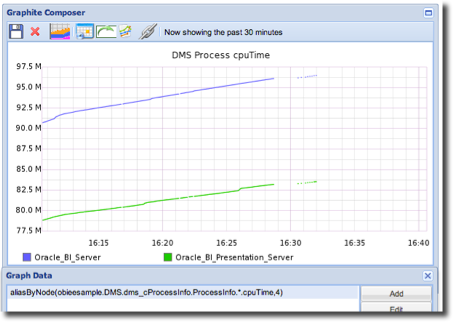
Let's say we want a graph that shows cpuTime for each of the processes (not all are available). We could add each metric individually:
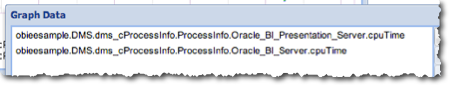
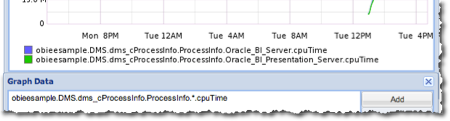
But that's time consuming, and assumes there are only two processes. What if DMS gives us data for other processes? Instead we can use a wildcard in place of the process name:
obieesample.DMS.dms_cProcessInfo.ProcessInfo.*.cpuTime
You can do this by selecting a metric and then amending it in the Graph Data view, or from the Graph Data view itself click on Add and use the auto-complete to manually enter it.
But now the legend is pretty unintelligable, and this time using the aliasByMetric function won't help because the metric name is constant (cpuTime). Instead, use the Set Legend Name By Node function. In this example we want the third node (the name of the process). Combined with a graph title this gives us:
This aliasbyNode method works well for Connection Pool data too. However it can be sensitive to certain characters (including brackets) in the metric name, throwing a IndexError: list index out of range error. The latest version of obi-metrics-agent should workaround this by modifying the metric names before sending them to carbon.
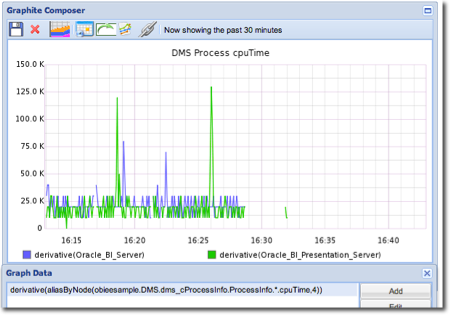
The above graph shows a further opportunity for using Graphite functions. The metric is a cumulative one - amount to CPU time that the process has used, in total. What would be more useful would be if we could show the delta between each occurrence. For this, the derivative function is appropriate:
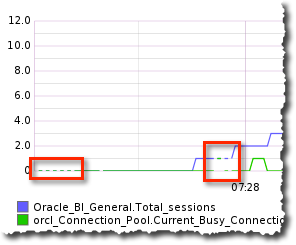
Sometimes you'll get graphs with gaps in; maybe the server was busy and the collector couldn't keep up.
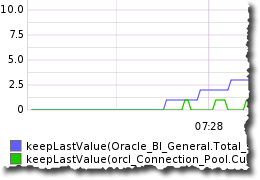
To "gloss over" these, use the Keep Last Value function:
Saving graphs
You don't have to login to Graphite by default, but to save and return to graphs and dashboards between sessions you'll want to. If you used the obi-metrics-agent installation script then Graphite will have a user oracle with password Password01. Click the Login button in the top right of the Graphite screen and enter the credentials.
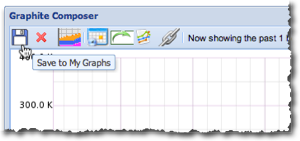
Once logged in, you should see a Save icon (for you young kids out there, that's a 3.5" floppy disk...).
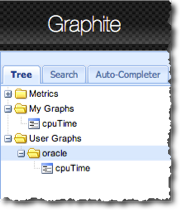
You can return to saved graphs from the Tree pane on the left:
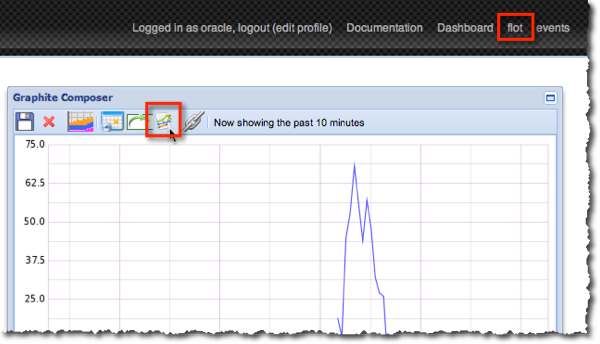
flot
As well as the standard Graphite graphing described above, you also have the option of using flot, which is available from the link in the top-right options, or the icon on an existing graph:
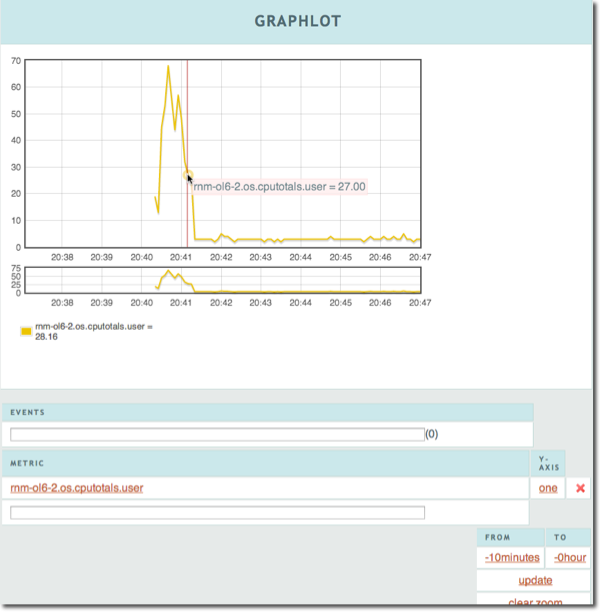
Graphlot/Flot is good for things like examining data values at specific times:
Creating a dashboard
So far we've seen individual graphs in isolation, which is fine for ad-hoc experimentation but doesn't give us an overall view of a system. Click on Dashboard in the top-right of the Graphite page to go to the dashboards area, ignoring the error about the default theme.
You can either build Graphite dashboards from scratch, or you can bring in graphs that you have prepared already in the Graphite Composer and saved.
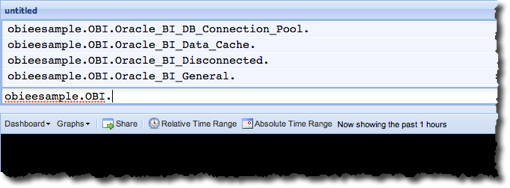
At the top of the Graphite Dashboard screen is the metrics available to you. Clicking on them drills down the metric tree, as does typing in the box underneath
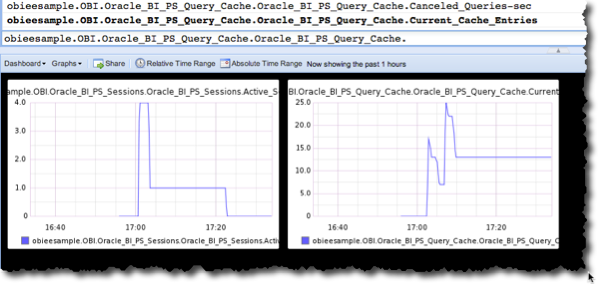
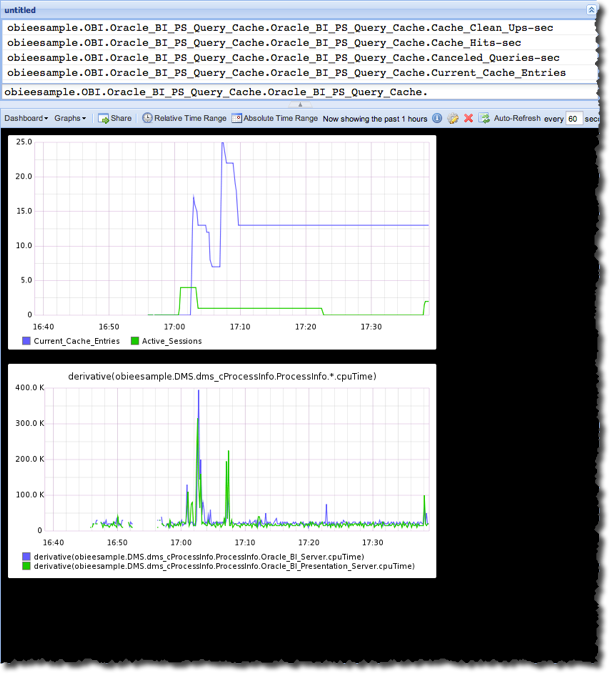
Selecting a metric adds it in a graph to the dashboard, and selecting a second adds it into a second graph:
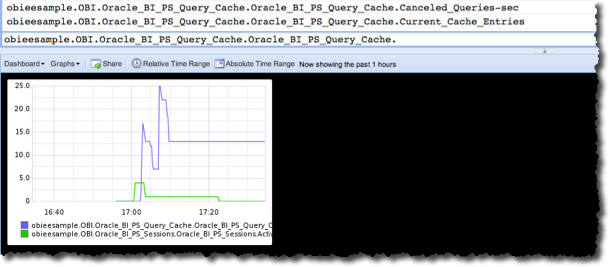
You can merge graphs by dragging and dropping one onto the other:
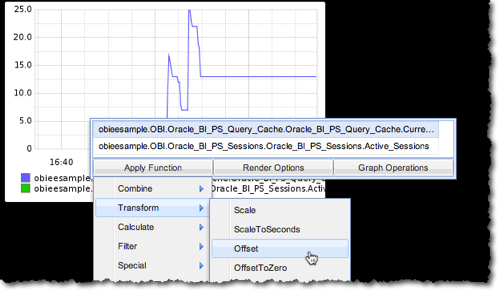
Metrics within a graph can be modified with functions in exactly the same way as in the Graphite Composer discussed above:
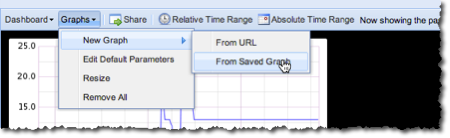
To add in a graph that you saved from Graphite Composer, use the Graphs menu
You can resize the graphs shown on the dashboard, again using the Graphs menu:
To save your dashboard, use the Dashboard -> Save option.
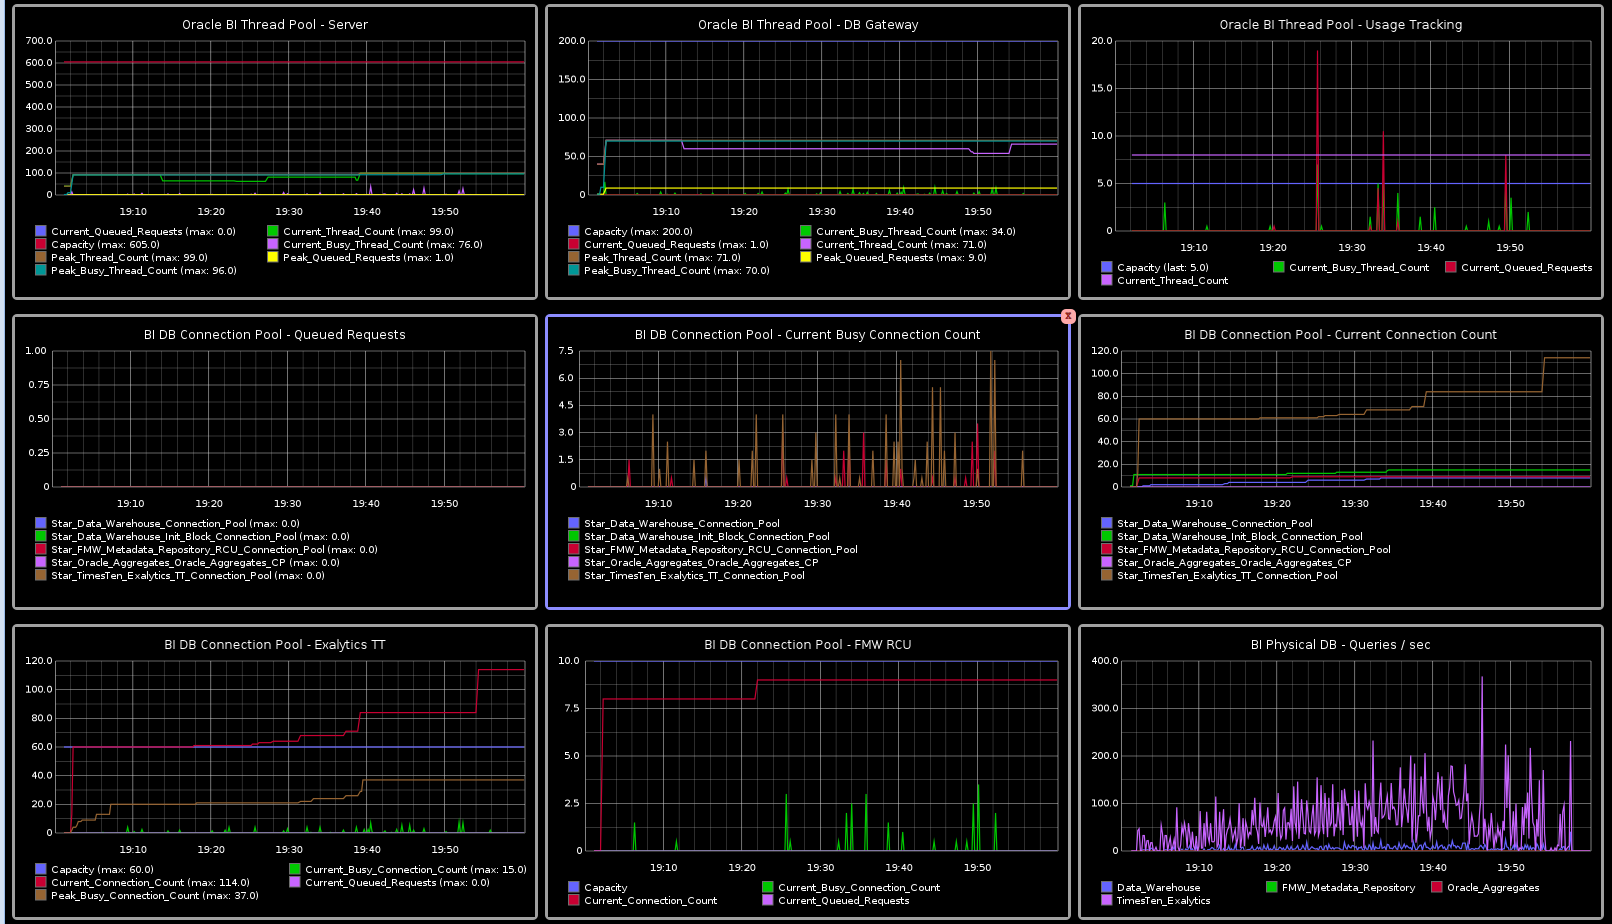
Example Graphite dashboards
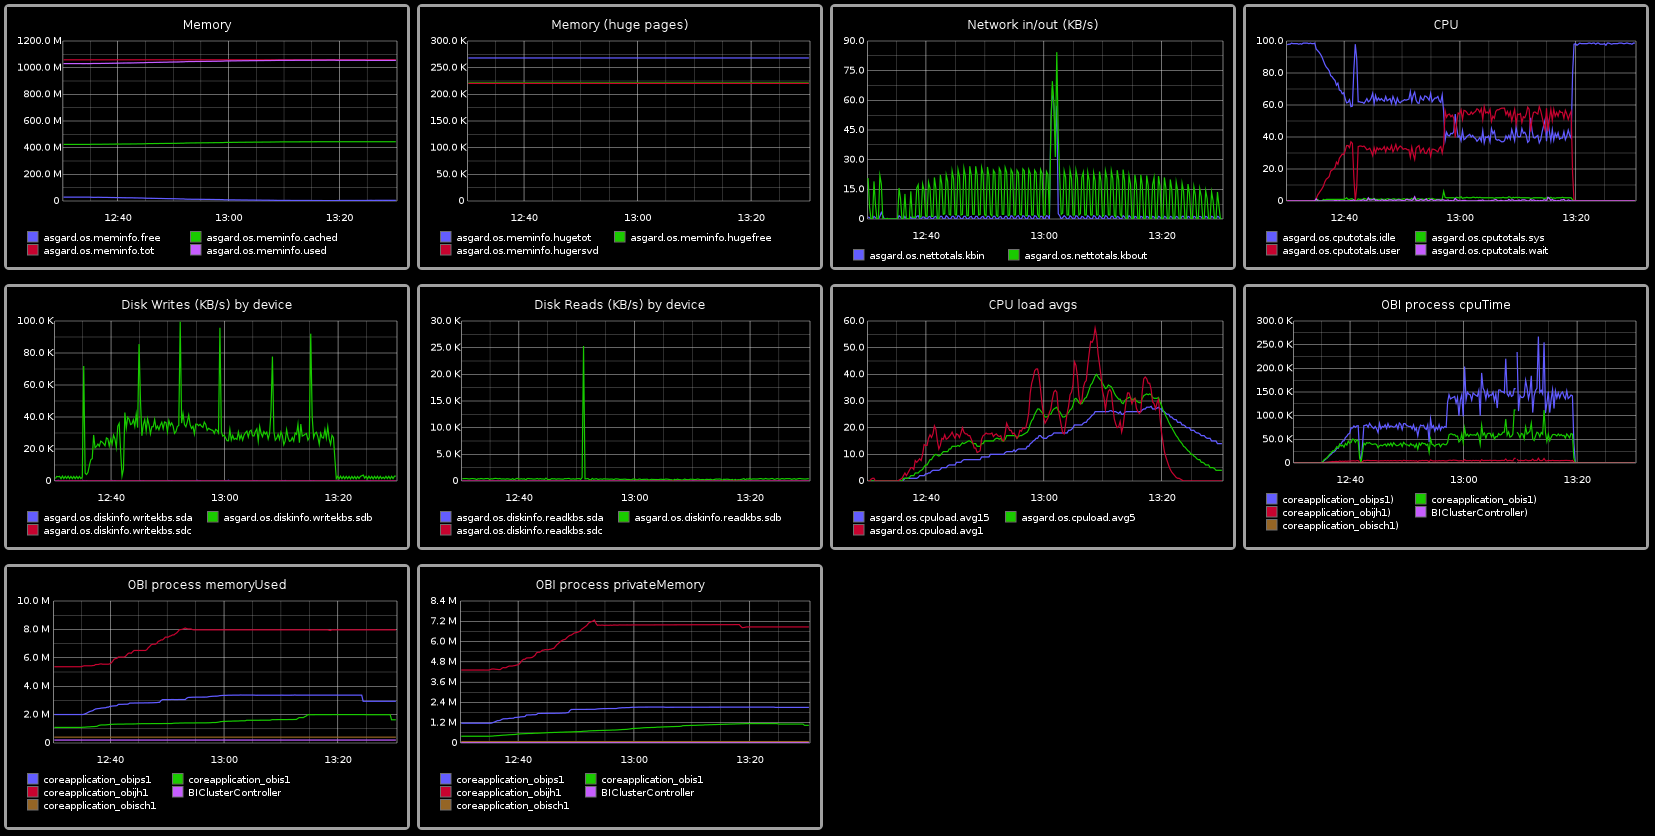
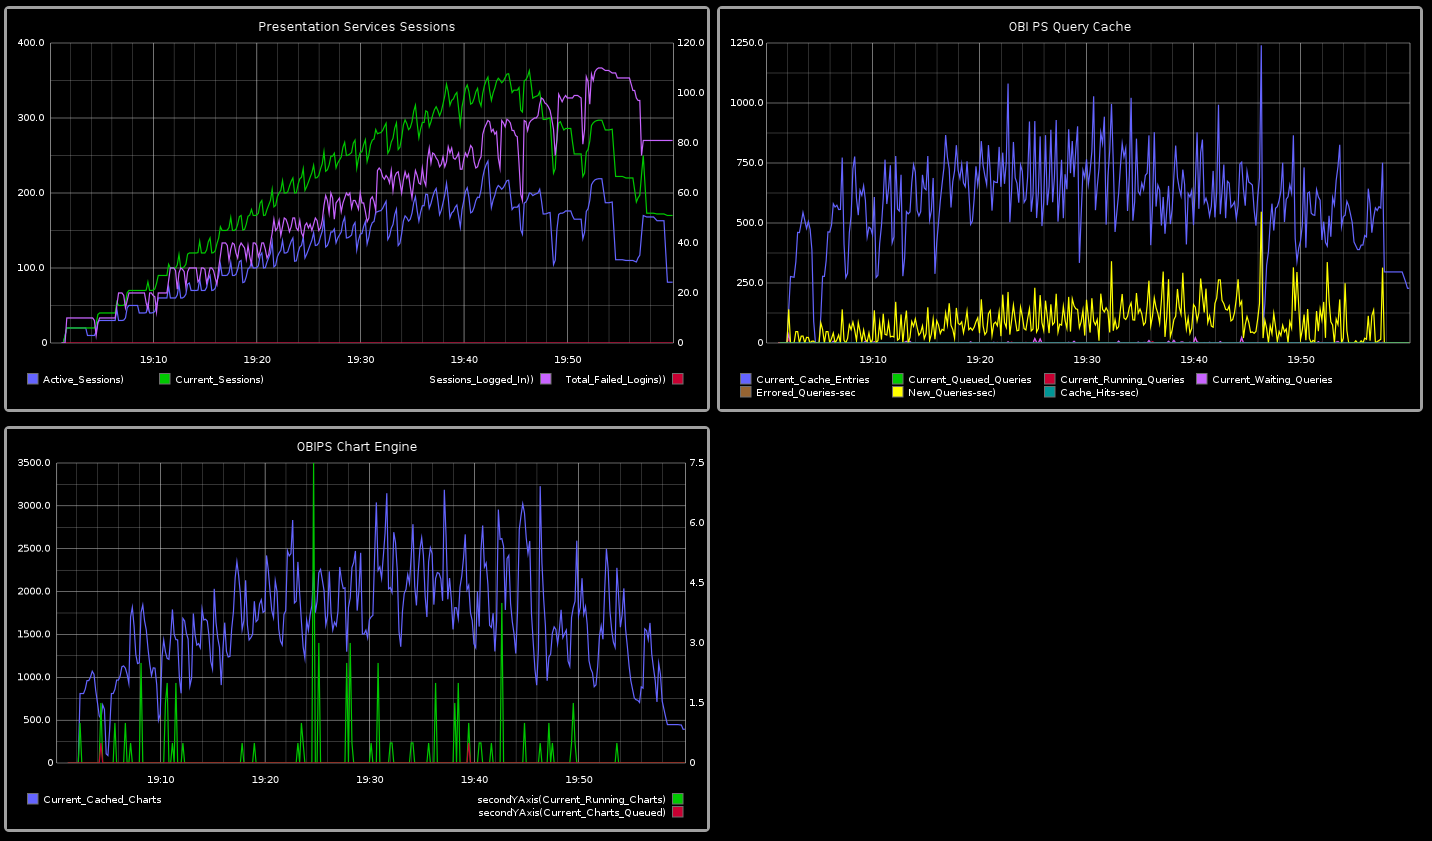
Here are some examples of obi-metrics-agent/Graphite being used in anger. Click on an image to see the full version.
- OS stats (via collectl)
- Presentation Services sessions, cache and charting
- BI Server (nqserver) Connection and Thread Pools
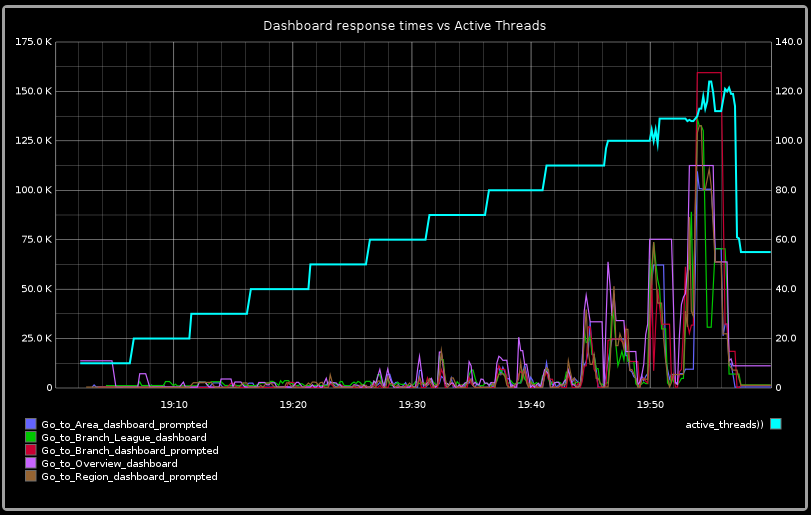
- Response times vs active users (via JMeter)