Linux cluster sysadmin -- OS metric monitoring with colmux

In this mini-series of blog posts I'm taking a look at a few very useful tools that can make your life as the sysadmin of a cluster of Linux machines. This may be a Hadoop cluster, or just a plain simple set of 'normal' machines on which you want to run the same commands and monitoring.
First we looked at using SSH keys for intra-machine authorisation, which is a pre-requisite executing the same command across multiple machines using PDSH, as well as what we look at in this article - monitoring OS metrics across a cluster with colmux.
Colmux is written by Mark Seger, the same person who wrote collectl. It makes use of collectl on each target machine to report back OS metrics across a cluster to a single node.
Install collectl across the cluster
Using pdsh we can easily install collectl on each node (if it’s not already), which is a pre-requisite for colmux:
pdsh -w root@rnmcluster02-node0[1-4] "yum install -y collectl && service collectl start && chkconfig collectl on"
NB by enabling the collectl service on each node it will capture performance data to file locally, which colmux can replay centrally.
Then install colmux itself, which you can download from Sourceforge. It only needs to be actually installed on a single host, but obviously we could push it out across the cluster with pdsh if we wanted to be able to invoke it on any node at will. Note that here I’m running it on a separate linux box (outside of the cluster) rather than on my Mac:
cd /tmp
# Make sure you get the latest version of collectl-utils, from https://sourceforge.net/projects/collectl-utils/files/
# This example is hardcoded to a version and particular sourceforge mirror
curl -O http://garr.dl.sourceforge.net/project/collectl-utils/collectl-utils-4.8.2/collectl-utils-4.8.2.src.tar.gz
tar xf collectl-utils-4.8.2.src.tar.gz
cd collectl-utils-4.8.2
sudo ./INSTALL
# collectl-utils also includes colplot, so if you might want to use it restart
# apache (assuming it's installed)
sudo service httpd restart
Colmux and networking
Couple of important notes:
- The machine you run colmux from needs to have port 2655 open in order for each node’s collectl to send back the data to it.
You also may encounter an issue if you have any odd networking (eg NAT on virtual machines) that causes colmux to not work because it picks the ‘wrong’ network interface of the host to tell collectl on each node to send its data to. Details and workaround here.
colmux in action – real-time view, point in time
Command
colmux -addr 'rnmcluster02-node0[1-4]' -username root
Output
# Mon Dec  1 22:20:40 2014  Connected: 4 of 4
#                    <--------CPU--------><----------Disks-----------><----------Network---------->
#Host                cpu sys inter  ctxsw KBRead  Reads KBWrit Writes   KBIn  PktIn  KBOut  PktOut
rnmcluster02-node01    1   1    28     36      0      0      0      0      0      2      0       2
rnmcluster02-node04    0   0    33     28      0      0     36      8      0      1      0       1
rnmcluster02-node03    0   0    15     17      0      0      0      0      0      1      0       1
rnmcluster02-node02    0   0    18     18      0      0      0      0      0      1      0       1
Real-time view, persisted
-cols puts the hosts across the top and time as rows. Specify one or more columns from the output without -cols. In this example it is the values for cpu value, along with the disk read/write (columns 1, 5 and 7 of the metrics as seen above):
Command
colmux -addr 'rnmcluster02-node0[1-4]' -user root -cols 1,5,7
Output
 cpu                            KBRead                         KBWrit
 node01 node02 node03 node04 |  node01 node02 node03 node04 |  node01 node02 node03 node04
      0      0      0      0 |       0      0      0      0 |      12     28      0      0
      0      0      0      0 |       0      0      0      0 |      12     28      0      0
      1      0      1      0 |       0      0      0      0 |       0      0      0      0
      0      0      0      0 |       0      0      0      0 |       0      0      0      0
      0      0      0      0 |       0      0      0      0 |       0      0      0      0
      0      0      0      0 |       0      0      0      0 |       0     20      0      0
      0      0      0      0 |       0      0      0      0 |      52      4      0      0
      0      0      0      2 |       0      0      0      0 |       0      0      0      0
      1      0      0      0 |       0      0      0      0 |       0      0      0      0
     15     16     15     15 |       0      4      4      4 |      20     40     32     48
      0      0      1      1 |       0      0      0      0 |       0      0      4      0
      1      0      0      0 |       0      0      0      0 |       0      0      0      0
To check the numbers of the columns that you want to reference, run the command with the --test argument:
colmux -addr 'rnmcluster02-node0[1-4]' -user root --test

>>> Headers <<<
#                    <--------CPU--------><----------Disks-----------><----------Network---------->
#Host                cpu sys inter  ctxsw KBRead  Reads KBWrit Writes   KBIn  PktIn  KBOut  PktOut

>>> Column Numbering <<<
 0 #Host   1 cpu     2 sys     3 inter   4 ctxsw   5 KBRead  6 Reads   7 KBWrit
 8 Writes  9 KBIn   10 PktIn  11 KBOut  12 PktOut
And from there you get the numbers of the columns to reference in the -cols argument.
To include the timestamp, use -oT in the -command and offset the column numbers by 1:
Command
colmux -addr 'rnmcluster02-node0[1-4]' -user root -cols 2,6,8 -command '-oT'
Output
         sys                            Reads                          Writes
#Time    node01 node02 node03 node04 |  node01 node02 node03 node04 |  node01 node02 node03 node04
22:24:50      0      0      0      0 |       0      0      0      0 |       0      0      0      0
22:24:51      1      0      0      0 |       0      0      0      0 |       0      0      0      0
22:24:52      0      0      0      0 |       0      0      0      0 |       0     16      0     16
22:24:53      1      0      0      0 |       0      0      0      0 |      36      0     16      0
22:24:54      0      0      0      1 |       0      0      0      0 |       0      0      0      0
22:24:55      0      0      0      0 |       0      0      0      0 |       0     20     32     20
NB There’s a bug with colmux 4.8.2 that prevents you accessing the first metric with -cols when you also enable timestamp -oT – details here.
Specifying additional metrics
Collectl (which is what colmux calls to get the data) can fetch metrics from multiple subsystems on a node. You can access all of these through colmux too. By default when you run colmux you get cpu, disk and network but you can specify others using the -s argument followed by the subsystem identifier.
To examine the available subsystems run collectl on one of the target nodes:
[root@rnmcluster02-node01 ~]# collectl --showsubsys
The following subsystems can be specified in any combinations with -s or
--subsys in both record and playbackmode.  [default=bcdfijmnstx]

These generate summary, which is the total of ALL data for a particular type
  b - buddy info (memory fragmentation)
  c - cpu
  d - disk
  f - nfs
  i - inodes
  j - interrupts by CPU
  l - lustre
  m - memory
  n - network
  s - sockets
  t - tcp
  x - interconnect (currently supported: OFED/Infiniband)
  y - slabs
From the above list we can see that if we want to also show memory detail alongside CPU we need to include m and c in the subsystem list:
Command
colmux -addr 'rnmcluster02-node0[1-4]' -user root -command '-scm'
Output
# Tue Dec  2 08:02:38 2014  Connected: 4 of 4
#                    <--------CPU--------><-----------Memory----------->
#Host                cpu sys inter  ctxsw Free Buff Cach Inac Slab  Map
rnmcluster02-node02    1   0    19     18  33M  15M 345M 167M  30M  56M
rnmcluster02-node04    0   0    30     24  32M  15M 345M 167M  30M  56M
rnmcluster02-node03    0   0    30     36  32M  15M 345M 165M  30M  56M
rnmcluster02-node01    0   0    16     16  29M  15M 326M 167M  27M  81M
Changing the sample frequency
To change the sample frequency use the -i syntax in -command:
Command
colmux -addr 'rnmcluster02-node0[1-4]' -user root -command '-scm -i10 -oT' -cols 2,4
Samples every 10 seconds:
         sys                            ctxsw
#Time    node01 node02 node03 node04 |  node01 node02 node03 node04
08:06:29     -1     -1     -1     -1 |      -1     -1     -1     -1
08:06:39     -1     -1     -1     -1 |      -1     -1     -1     -1
08:06:49      0      0      0      0 |      14     13     15     19
08:06:59      0      0      0      0 |      13     13     17     21
08:07:09      0      0      0      0 |      19     18     15     24
08:07:19      0      0      0      0 |      13     13     15     19
08:07:29      0      0      0      0 |      13     13     14     19
08:07:39      0      0      0      0 |      12     13     13     19
Column width
Add the -colwidth argument
Command
colmux -addr 'rnmcluster02-node0[1-4]' -user root -command '-scm' -cols 1 -colwidth 20
Output
 cpu
  rnmcluster02-node01  rnmcluster02-node02  rnmcluster02-node03  rnmcluster02-node04
                   -1                   -1                   -1                   -1
                   -1                   -1                   -1                   -1
                    1                    0                    0                    0
                    0                    0                    0                    0
                    0                    1                    0                    0
                    0                    0                    1                    0
                    1                    0                    1                    0
                    0                    1                    0                    0
Playback
As well as running interactively, collectl can run as a service and record metric samples to disk. Using colmux you can replay these from across the cluster.
Within the -command, include -p and the path to the collectl log files (assumes that it is the same on each host). As with real-time mode, for different subsystems change the flags after -s
Command
colmux -addr 'rnmcluster02-node0[1-4]' -user root -command '-p /var/log/collectl/*20141201* -scmd -oD'
Output
[...]
# 21:48:50  Reporting: 4 of 4
#                                      <--------CPU--------><-----------Memory-----------><----------Disks----------->
#Host               Date     Time      cpu sys inter  ctxsw Free Buff Cach Inac Slab  Map KBRead  Reads KBWrit Writes
rnmcluster02-node04 20141201 21:48:50    0   0    17     15  58M  10M 340M 162M  30M  39M      0      0      1      0
rnmcluster02-node03 20141201 21:48:50    0   0    11     13  58M  10M 340M 160M  30M  39M      0      0      0      0
rnmcluster02-node02 20141201 21:48:50    0   0    11     15  58M  10M 340M 163M  29M  39M      0      0      1      0
rnmcluster02-node01 20141201 21:48:50    0   0    12     14  33M  12M 342M 157M  27M  63M      0      0      1      0

# 21:49:00  Reporting: 4 of 4
#                                      <--------CPU--------><-----------Memory-----------><----------Disks----------->
#Host               Date     Time      cpu sys inter  ctxsw Free Buff Cach Inac Slab  Map KBRead  Reads KBWrit Writes
rnmcluster02-node04 20141201 21:49:00    0   0    17     15  58M  10M 340M 162M  30M  39M      0      0      4      0
rnmcluster02-node03 20141201 21:49:00    0   0    13     14  58M  10M 340M 160M  30M  39M      0      0      5      0
rnmcluster02-node02 20141201 21:49:00    0   0    12     14  58M  10M 340M 163M  29M  39M      0      0      1      0
rnmcluster02-node01 20141201 21:49:00    0   0    12     15  33M  12M 342M 157M  27M  63M      0      0      6      0

# 21:49:10  Reporting: 4 of 4
#                                      <--------CPU--------><-----------Memory-----------><----------Disks----------->
#Host               Date     Time      cpu sys inter  ctxsw Free Buff Cach Inac Slab  Map KBRead  Reads KBWrit Writes
rnmcluster02-node04 20141201 21:49:10    0   0    23     23  58M  10M 340M 162M  30M  39M      0      0      1      0
rnmcluster02-node03 20141201 21:49:10    0   0    19     24  58M  10M 340M 160M  30M  39M      0      0      2      0
rnmcluster02-node02 20141201 21:49:10    0   0    18     23  58M  10M 340M 163M  29M  39M      0      0      2      1
rnmcluster02-node01 20141201 21:49:10    0   0    18     24  33M  12M 342M 157M  27M  63M      0      0      1      0
[...]
Restrict the time frame by adding to -command the arguments -from and/or -thru
[oracle@rnm-ol6-2 ~]$ colmux -addr 'rnmcluster02-node0[1-4]' -user root -command '-p /var/log/collectl/*20141201* -scmd -oD --from 21:40:00 --thru 21:40:10'
# 21:40:00  Reporting: 4 of 4
#                                      <--------CPU--------><-----------Memory-----------><----------Disks----------->
#Host               Date     Time      cpu sys inter  ctxsw Free Buff Cach Inac Slab  Map KBRead  Reads KBWrit Writes
rnmcluster02-node04 20141201 21:40:00    0   0    16     14  59M  10M 340M 162M  30M  39M      0      0      0      0
rnmcluster02-node03 20141201 21:40:00    0   0    12     14  58M  10M 340M 160M  30M  39M      0      0      8      1
rnmcluster02-node02 20141201 21:40:00    0   0    12     15  59M  10M 340M 162M  30M  39M      0      0      6      1
rnmcluster02-node01 20141201 21:40:00    0   0    13     16  56M  11M 341M 156M  27M  42M      0      0      7      1

# 21:40:10  Reporting: 4 of 4
#                                      <--------CPU--------><-----------Memory-----------><----------Disks----------->
#Host               Date     Time      cpu sys inter  ctxsw Free Buff Cach Inac Slab  Map KBRead  Reads KBWrit Writes
rnmcluster02-node04 20141201 21:40:10    0   0    26     33  59M  10M 340M 162M  30M  39M      1      0     10      2
rnmcluster02-node03 20141201 21:40:10    0   0    20     31  58M  10M 340M 160M  30M  39M      0      0      4      1
rnmcluster02-node02 20141201 21:40:10    0   0    23     35  59M  10M 340M 162M  30M  39M      3      0      9      2
rnmcluster02-node01 20141201 21:40:10    0   0    23     37  56M  11M 341M 156M  27M  42M      4      1      4      1


[oracle@rnm-ol6-2 ~]$
colmux reference
You can find more about colmux from the website:
- http://collectl-utils.sourceforge.net/colmux.html
- http://collectl-utils.sourceforge.net/Colmux-tutorial.html
as well as the built in man page man colmux
Visualising collectl data with colplot
As a little bonus to the above, colmux is part of the collectl-utils package, which also includes colplot, a gnuplot-based web tool that renders collectl data into graphs. It’s pretty easy to set up, running under Apache just fine and just needing gnuplot installed if you haven’t already. It can report metrics across a cluster if you make sure that you first make each node’s collectl data available locally to colplot.
Navigating to the web page shows the interface from which you can trigger graph plots based on the collectl data available:
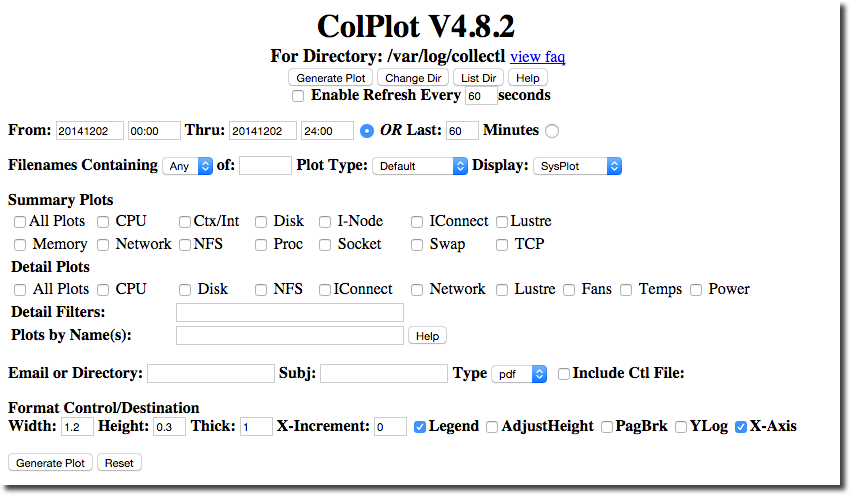
colplot's utilitarian graphs are a refreshing contrast to every webapp that is built nowadays promising “beautiful” visualisations (which no doubt the authors are “passionate” about making “awesome”):
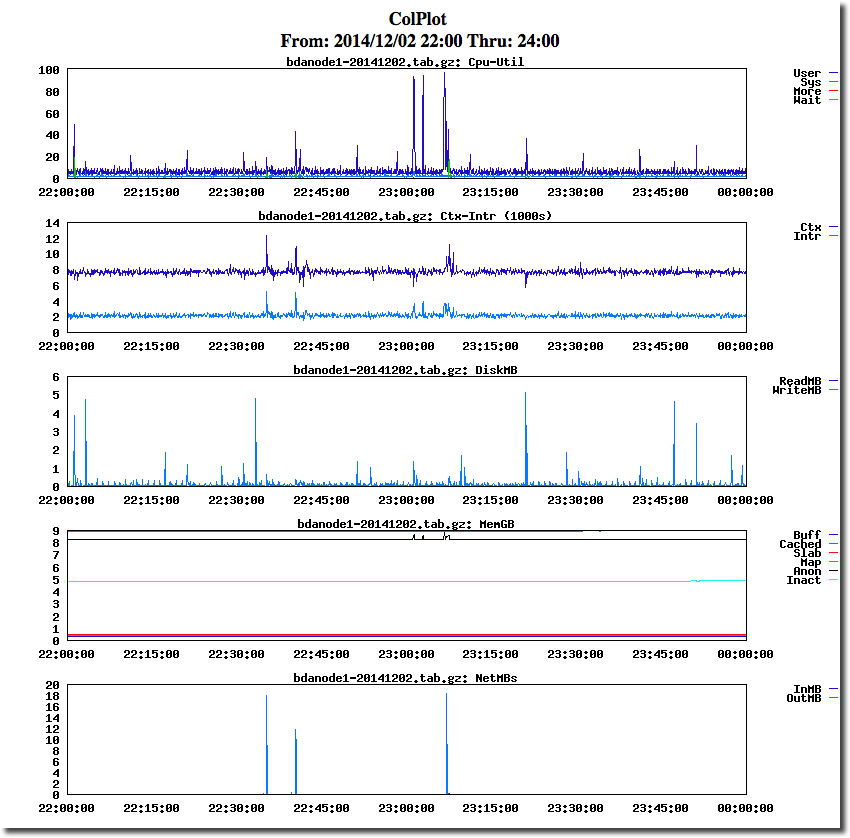
The graphs are functional and can be scaled as needed, but each change is a trip back to the front page to tweak options and re-render:
For me, colplot is an excellent tool for point-in-time analysis and diagnostics, but for more generalised monitoring with drilldown into detail, it is too manual to be viable and I’ll be sticking with collectl -> graphite -> grafana with its interactive and flexible graph rendering:
Do note however that colplot specifically does not drop data points, so if there is a spike in your data you will see it. Other tools (possibly including graphite but I’ve not validated this) will, for larger timespans average out data series so as to provide a smoother picture of a metric (eg instead of a point every second, maybe every ten seconds). If you are doing close analysis of a system’s behaviour in a particular situation this may be a problem. If you are wanting more generalised overview of a system’s health, with the option to drill into data historical as needed, it will be less of an issue.
Summary
When working with multiple Linux machines I would first and foremost make sure SSH keys are set up in order to ease management through password-less logins.
After SSH keys, I would recommend pdsh for parallel execution of the same SSH command across the cluster. It’s a big time saver particularly when initially setting up the cluster given the installation and configuration changes that are inevitably needed.
To monitor a cluster I would always recommend collectl as the base metric collector. colmux works excellently for viewing these metrics from across the cluster in a single place from the commandline. For viewing the metrics over the longer term you can either store them in (or replay them into) Graphite/Carbon, and render them in Grafana. You have the option of colplot too since this is installed as part of colmux.
So now your turn – what particular tools or tips do you have for working with a cluster of Linux machines? Leave your answers in the comments below, or tweet them to me at @rmoff.