Managing Impala and Other Mixed Workloads on the Oracle Big Data Appliance

One of our current client projects uses Cloudera Impala to provide fast ad-hoc querying to the data we’re loading into their Oracle Big Data Appliance Hadoop environment. Impala bypasses MapReduce to provide faster queries than Hive, but to do so it does a lot of processing in-memory and runs server processes on each node in the cluster, leading in some cases to runaway queries blocking other workloads in the same way that OBIEE queries on an Oracle Database can sometimes block ETL and application workloads. Several projects share this same Big Data Appliance, so to try and limit the impact Impala could have on other cluster workloads the client had disabled the Impala Daemons on nine of the twelve nodes in their Big Data Appliance; our concern with this approach was that an Impala query could access data from any datanode in the Big Data Appliance cluster, so whilst HDFS data is typically stored and replicated to three nodes in the cluster running the Impala daemons on just a quarter of the available nodes was likely to lead to data locality issues for Impala and blocks getting shipped across the network unnecessarily.
Going back to OBIEE and the Oracle Database, Oracle have a resource management feature for the Oracle database that allows you to put users and queries into separate resource pools and manage the share of overall resources that each pool gets. I covered this concept on the blog a few years ago, and the version of Cloudera Hadoop (CDH5.3) as used on the client’s Big Data Appliance has a feature called “YARN”, or Yet Another Resource Negotiator, that splits out the resource management and scheduling parts that were bound into MapReduce in Hadoop 1.0 so that MapReduce then just runs as a workload type on Hadoop, and with it then possible to run other workload types, for example Apache Spark, on that same cluster management framework.

Impala isn’t however configured to use YARN by default and uses an internal scheduler to govern how concurrent queries run and use cluster resources, but it can be configured to use YARN in what Cloudera term “Integrated Resource Management” and our initial response was to recommend this approach; however YARN is really optimised for longer-running batch jobs and not the shorter jobs that Impala generates (such that Cloudera recommends you don’t actually use YARN, and control Impala resource usage via service-level process constraints or through a new Impala feature called Admission Control instead). Taking a step back though, how do we actually see what resources Impala is using across the cluster when a query runs, and is there a feature similar to the Oracle Database’s SQL Explain Plan to help us understand how an Impala SQL query is executed? Then, using this and the various resource management options to us, can we use them to understand how YARN and other options will affect the Impala users on the client’s cluster if we enable them? And, given that we were going to test this all out on one of our development Hadoop clusters running back at the office on VMWare, how well could we simulate the multiple concurrent queries and mixed workload we’d then encounter on the real customer Big Data Appliance?
When trying to understand what goes on when a Cloudera Impala SQL query runs, the two main tools in your toolbox are EXPLAIN plans and query profiles. The concept of EXPLAIN plans will be familiar to Oracle developers, and putting “explain” before your Impala SQL query when you’re using the Impala Shell (or pressing the “Explain” button when you’re using the Impala Editor in Hue) will display an output like the one below, showing the steps the optimiser plans to take to return the query results:
[bda7node1.rittmandev.com:21000] > explain
select sum(f.flights) as total_flights, d.dest_city
from flight_delays f join geog_dest d on f.dest = d.dest
join geog_origin o on f.orig = o.orig
where d.dest_state = 'California'
and   o.orig_state in ('Florida','New York','Alaska')
group by d.dest_city
having total_flights > 3000;
Query: explain select sum(f.flights) as total_flights, d.dest_city
from flight_delays f join geog_dest d on f.dest = d.dest
join geog_origin o on f.orig = o.orig
where d.dest_state = 'California'
and   o.orig_state in ('Florida','New York','Alaska')
group by d.dest_city
having total_flights > 3000
+---------------------------------------------------------------------+
| Explain String                                                      |
+---------------------------------------------------------------------+
| Estimated Per-Host Requirements: Memory=154.01MB VCores=2           |
|                                                                     |
| 10:EXCHANGE [UNPARTITIONED]                                         |
| |                                                                   |
| 09:AGGREGATE [FINALIZE]                                             |
| |  output: sum:merge(f.flights)                                     |
| |  group by: d.dest_city                                            |
| |  having: sum(f.flights) > 3000                                    |
| |                                                                   |
| 08:EXCHANGE [HASH(d.dest_city)]                                     |
| |                                                                   |
| 05:AGGREGATE                                                        |
| |  output: sum(f.flights)                                           |
| |  group by: d.dest_city                                            |
| |                                                                   |
| 04:HASH JOIN [INNER JOIN, BROADCAST]                                |
| |  hash predicates: f.orig = o.orig                                 |
| |                                                                   |
| |--07:EXCHANGE [BROADCAST]                                          |
| |  |                                                                |
| |  02:SCAN HDFS [airlines.geog_origin o]                            |
| |     partitions=1/1 files=1 size=147.08KB                          |
| |     predicates: o.orig_state IN ('Florida', 'New York', 'Alaska') |
| |                                                                   |
| 03:HASH JOIN [INNER JOIN, BROADCAST]                                |
| |  hash predicates: f.dest = d.dest                                 |
| |                                                                   |
| |--06:EXCHANGE [BROADCAST]                                          |
| |  |                                                                |
| |  01:SCAN HDFS [airlines.geog_dest d]                              |
| |     partitions=1/1 files=1 size=147.08KB                          |
| |     predicates: d.dest_state = 'California'                       |
| |                                                                   |
| 00:SCAN HDFS [airlines.flight_delays f]                             |
|    partitions=1/1 files=1 size=64.00MB                              |
+---------------------------------------------------------------------+
Fetched 35 row(s) in 0.21s
Like an Oracle SQL explain plan, Impala’s cost-based optimiser uses table and partition stats that you should have gathered previously using Impala’s “compute stats” command to determine what it thinks is the optimal execution plan for your query. To see the actual cost and timings for the various plan steps that are run for a query, you can then use the “summary” statement after your query has run (or for more detail, the “profile” statement”) to see the actual timings and stats for each step in the query execution.
[bda7node1.rittmandev.com:21000] > summary;                                 > ;
+-----------------+--------+----------+----------+---------+------------+-----------+---------------+-------------------------------+
| Operator        | #Hosts | Avg Time | Max Time | #Rows   | Est. #Rows | Peak Mem  | Est. Peak Mem | Detail                        |
+-----------------+--------+----------+----------+---------+------------+-----------+---------------+-------------------------------+
| 10:EXCHANGE     | 1      | 20.35us  | 20.35us  | 7       | 193        | 0 B       | -1 B          | UNPARTITIONED                 |
| 09:AGGREGATE    | 6      | 142.18ms | 180.81ms | 7       | 193        | 6.28 MB   | 10.00 MB      | FINALIZE                      |
| 08:EXCHANGE     | 6      | 59.86us  | 123.39us | 60      | 1.93K      | 0 B       | 0 B           | HASH(d.dest_city)             |
| 05:AGGREGATE    | 6      | 171.72ms | 208.36ms | 60      | 1.93K      | 22.73 MB  | 10.00 MB      |                               |
| 04:HASH JOIN    | 6      | 89.42ms  | 101.82ms | 540.04K | 131.88M    | 12.79 MB  | 5.41 KB       | INNER JOIN, BROADCAST         |
| |--07:EXCHANGE  | 6      | 16.32us  | 19.63us  | 2.81K   | 117        | 0 B       | 0 B           | BROADCAST                     |
| |  02:SCAN HDFS | 1      | 302.83ms | 302.83ms | 469     | 117        | 309.00 KB | 32.00 MB      | airlines.geog_origin o        |
| 03:HASH JOIN    | 6      | 936.71ms | 1.10s    | 15.68M  | 131.88M    | 12.14 MB  | 3.02 KB       | INNER JOIN, BROADCAST         |
| |--06:EXCHANGE  | 6      | 19.02us  | 46.49us  | 1.04K   | 39         | 0 B       | 0 B           | BROADCAST                     |
| |  01:SCAN HDFS | 1      | 266.99ms | 266.99ms | 173     | 39         | 325.00 KB | 32.00 MB      | airlines.geog_dest d          |
| 00:SCAN HDFS    | 6      | 1.07s    | 1.90s    | 131.88M | 131.88M    | 74.03 MB  | 480.00 MB     | airlines.flight_delays_full f |
+-----------------+--------+----------+----------+---------+------------+-----------+---------------+-------------------------------+
Output from the Summary statement gives us some useful information in working out the impact of the various resource management options for the Oracle Big Data Appliance, at least in terms of its impact on individual Impala queries - we’ll look at the impact on the overall Hadoop cluster and individual nodes later on. From the output of the above Summary report I can see that my query ran on all six nodes in the cluster (queries I ran earlier on a smaller version of the fact table ran on just a single node), and I can see how long each step in the query actually took to run. So what happens if I run the same query again on the cluster but disable the Impala daemon service role on three of the nodes, using Cloudera Manager?

Here’s the Summary output after running the query again:
[bda7node1.rittmandev.com:21000] > summary;
+-----------------+--------+----------+----------+---------+------------+-----------+---------------+-------------------------------+
| Operator        | #Hosts | Avg Time | Max Time | #Rows   | Est. #Rows | Peak Mem  | Est. Peak Mem | Detail                        |
+-----------------+--------+----------+----------+---------+------------+-----------+---------------+-------------------------------+
| 10:EXCHANGE     | 1      | 22.01us  | 22.01us  | 7       | 193        | 0 B       | -1 B          | UNPARTITIONED                 |
| 09:AGGREGATE    | 3      | 111.12ms | 117.24ms | 7       | 193        | 6.27 MB   | 10.00 MB      | FINALIZE                      |
| 08:EXCHANGE     | 3      | 30.09us  | 39.02us  | 30      | 1.93K      | 0 B       | 0 B           | HASH(d.dest_city)             |
| 05:AGGREGATE    | 3      | 161.26ms | 173.57ms | 30      | 1.93K      | 22.84 MB  | 10.00 MB      |                               |
| 04:HASH JOIN    | 3      | 156.50ms | 238.90ms | 540.04K | 131.88M    | 12.81 MB  | 5.41 KB       | INNER JOIN, BROADCAST         |
| |--07:EXCHANGE  | 3      | 20.19us  | 28.93us  | 1.41K   | 117        | 0 B       | 0 B           | BROADCAST                     |
| |  02:SCAN HDFS | 1      | 477.38ms | 477.38ms | 469     | 117        | 309.00 KB | 32.00 MB      | airlines.geog_origin o        |
| 03:HASH JOIN    | 3      | 1.48s    | 1.66s    | 15.68M  | 131.88M    | 12.14 MB  | 3.02 KB       | INNER JOIN, BROADCAST         |
| |--06:EXCHANGE  | 3      | 12.07us  | 14.89us  | 519     | 39         | 0 B       | 0 B           | BROADCAST                     |
| |  01:SCAN HDFS | 1      | 308.83ms | 308.83ms | 173     | 39         | 325.00 KB | 32.00 MB      | airlines.geog_dest d          |
| 00:SCAN HDFS    | 3      | 3.39s    | 6.85s    | 131.88M | 131.88M    | 74.11 MB  | 480.00 MB     | airlines.flight_delays_full f |
+-----------------+--------+----------+----------+---------+------------+-----------+---------------+-------------------------------+
What the Summary statement doesn’t show you is the overall time the query took to run, and the query ran against three nodes took 9.48s to run compared to 3.59s for the one before where I had all six nodes’ Impala daemon enabled. In-fact I’d expect a query running on the client’s BDA with just three out of twelve nodes enabled to run even slower because of the block locality issue - Impala has a feature called block locality tracking which keeps track of where HDFS data blocks are actually located on the cluster and tries to run impalad tasks on the right nodes, but three out of twelve nodes running makes that job really hard - but the other factor that we need to consider is how running multiple queries concurrently affects things when only a few nodes are handling all the Impala user queries.
To try and simulate concurrent queries running I opened six terminal session against nodes actually running Impala Daemon service roles and submitted the same query from each session, with a second or two gap between each query; with all six nodes enabled the average response time rose to about 6s, but with just three enabled the response rose fairly consistently to around 27s.

This is of course what you’d expect when everything was trying to run on the same three (now resource-starved) server nodes, and again I’d expect this to be even more pronounced on the client’s twelve-node BDA. What this test of course didn’t cover was running workloads other than Impala on the same cluster, or running queries against different datasets, but it did at least show us how response-time increases fairly dramatically (albeit consistently) as more Impala users come onto the system.
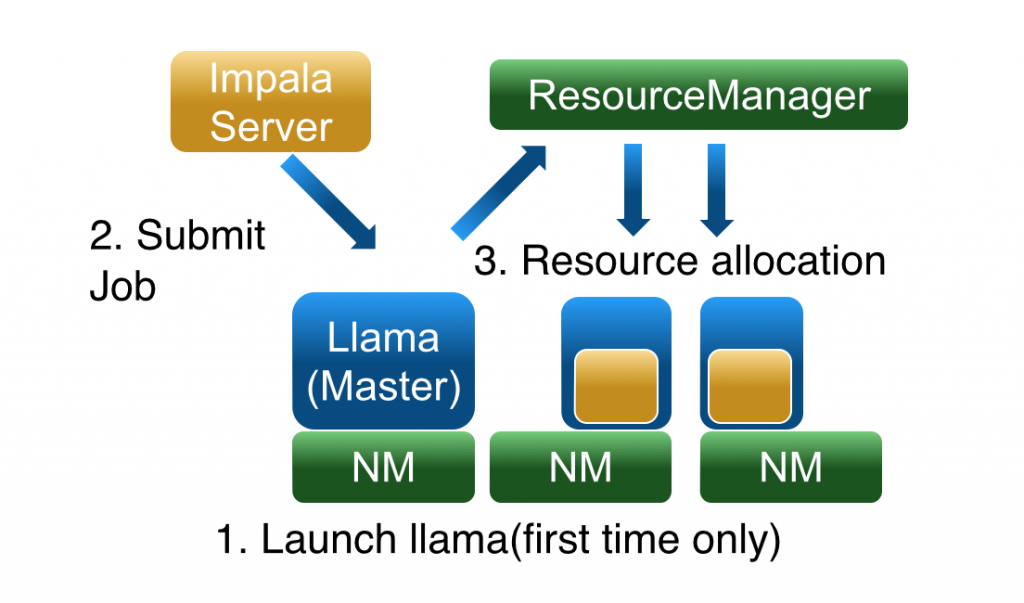
So now we have some baseline benchmarking figures, let’s configure Impala to use YARN, using Cloudera Manager on the CDH5.3 setup used on the client’s BDA and our development cluster back in the office. There’s actually two parts to Impala running on YARN in CDH5.x; YARN itself as the overall cluster resource management layer, and another component called Llama (Low-Latency, or “Long-Lived”, Application Master) that sits between YARN and Impala and reduces the time that each Impala query takes to obtain YARN resource allocations.
Enabling YARN and Llama (and if you want to, configuring Llama and thereby Impala for high-availability) is done through a wizard in CDH5.3 that also offers to set up an Linux feature called Cgroups that YARN can use to limit the “containers” it uses for resource management at the OS-level.
Once you’ve run through the wizard and restarted the cluster, Impala should be configured to use YARN instead of its own scheduler to request resources, which in-theory will allow Hadoop and the Big Data Appliance to consider Impala workloads alongside MapReduce, Spark and HBase when scheduling jobs across the cluster. Before we get into the options YARN gives us for managing these workloads I ran the same Impala queries again, first as a single query and then with six running concurrently, to see what impact YARN on its own had on query response times.
The single query on its own took around the same time as without YARN to run (3-4s), but when I ran six concurrent queries together the response time went up from the 3-4s that I saw without YARN enabled to between 5s and 18s depending on the session, with quite a bit of variation between response times compared to the consistent times I saw when YARN wasn’t being used - which surprised me as one of the stated benefits of YARN is making job execution times more predictable and smooth, though this cloud be more of an overall-cluster thing and there are also recommendations around configuring YARN and Llama’s resource estimation more efficient for Impala in the Cloudera docs.
[bda7node1.rittmandev.com:21000] > summary;
+-----------------+--------+----------+----------+---------+------------+-----------+---------------+-------------------------------+
| Operator        | #Hosts | Avg Time | Max Time | #Rows   | Est. #Rows | Peak Mem  | Est. Peak Mem | Detail                        |
+-----------------+--------+----------+----------+---------+------------+-----------+---------------+-------------------------------+
| 10:EXCHANGE     | 1      | 41.38us  | 41.38us  | 7       | 193        | 0 B       | -1 B          | UNPARTITIONED                 |
| 09:AGGREGATE    | 6      | 115.28ms | 123.04ms | 7       | 193        | 6.28 MB   | 10.00 MB      | FINALIZE                      |
| 08:EXCHANGE     | 6      | 44.44us  | 67.62us  | 60      | 1.93K      | 0 B       | 0 B           | HASH(d.dest_city)             |
| 05:AGGREGATE    | 6      | 170.91ms | 201.47ms | 60      | 1.93K      | 22.82 MB  | 10.00 MB      |                               |
| 04:HASH JOIN    | 6      | 82.25ms  | 98.34ms  | 540.04K | 131.88M    | 12.81 MB  | 5.41 KB       | INNER JOIN, BROADCAST         |
| |--07:EXCHANGE  | 6      | 15.39us  | 18.99us  | 2.81K   | 117        | 0 B       | 0 B           | BROADCAST                     |
| |  02:SCAN HDFS | 1      | 244.40ms | 244.40ms | 469     | 117        | 309.00 KB | 32.00 MB      | airlines.geog_origin o        |
| 03:HASH JOIN    | 6      | 850.55ms | 942.47ms | 15.68M  | 131.88M    | 12.14 MB  | 3.02 KB       | INNER JOIN, BROADCAST         |
| |--06:EXCHANGE  | 6      | 13.99us  | 19.05us  | 1.04K   | 39         | 0 B       | 0 B           | BROADCAST                     |
| |  01:SCAN HDFS | 1      | 222.03ms | 222.03ms | 173     | 39         | 325.00 KB | 32.00 MB      | airlines.geog_dest d          |
| 00:SCAN HDFS    | 6      | 1.54s    | 2.88s    | 131.88M | 131.88M    | 74.03 MB  | 480.00 MB     | airlines.flight_delays_full f |
+-----------------+--------+----------+----------+---------+------------+-----------+---------------+-------------------------------+
But it seems clear that users of Impala on the client cluster should expect some sort of overhead from using YARN to manage Impala’s resources, with the payoff being better balance between Impala workloads and the other uses they’re putting the BDA cluster too - however I think there’s more we can do to fine-tune how Llama and YARN allocate memory to Impala queries up-front (allocating a set amount of memory for all queries, rather than making an estimate and then adding more memory mid-query if it’s needed) and of course we’ve not really tested it on a cluster with a full, mixed workload running. But what about our original scenario, where only a certain percentage of the overall cluster resources or nodes are allocated to Impala query processing? To set up that sort of division resources we can use another feature of YARN called dynamic allocation, and dynamic resource pools that we can set up through Cloudera Manager again.
Dynamic allocation is one of the ways that YARN can be configured to manage multiple workloads on a Hadoop cluster (the other way is through static service pools, and I’ll come to those in a moment). Using dynamic allocation I can set up a resource pool for the airline flight delays application that my Impala SQL queries are associated with and allocate it 25% of overall cluster resources, with the remainder of cluster resources allocated to other applications. I can keep that weighting simple as I have done in the screenshot below, or I can allocate resources based on virtual cores and memory, but I found it simpler to just set these overall weightings and let YARN worry about cores and RAM.

Depending on the scheduling policy you select, YARN will prioritise Impala and other jobs in different ways, but the recommended scheduling policy for mixed workloads is dominent resource fairness which balances RAM and CPU depending on which resource pool needs them most at a particular time. Note also that Impala can either be managed as part of the overall YARN workload or separately, a choice you can make in the Impala service configuration settings in Cloudera Manager (the “Enable Dynamic Resource Pools” setting that’s checked below, but was unchecked for the screenshot above)

There’s also a separate control you can place on Impala queries called Admission Control, that limits the number of queries that can run or be queued for a resource pool at any particular time. The docs are a bit vague on when to use admission control, when to use YARN or not and so on, but my take on this is that if it’s just Impala queries you’re worried about and throttling their use solves the problem then use this feature and leave Impala outside of YARN, but if you need to manage overall mixed workloads then do it all through YARN. For my testing example though I just went with simple resource pool weighting, and you can see from the screenshot below where multiple queries are running at once for my pool, CPU and RAM resources are constrained as expected.

To make a particular Impala query run within a specific resource pool you can either allocate that user to a named resource pool, or you can specific the resource pool in your Impala shell session like this:
[bda7node1.rittmandev.com:21000] > set request_pool = airlines;
REQUEST_POOL set to airlines
[bda7node1.rittmandev.com:21000] > select sum(f.flights) as total_flights, d.dest_city
from airlines.flight_delays_full f join airlines.geog_dest d on f.dest = d.dest
join airlines.geog_origin o on f.orig = o.orig
where d.dest_state = 'California'
and o.orig_state in ('Florida','New York','Alaska')
group by d.dest_city
having total_flights > 3000;
Looking then at a typical summary output for a query running with these restrictions (25% of resources overall) and other queries running concurrently, the numbers don’t look all that different to before and results took between 8s and 30s to return - again I was surprised on the variance but I think YARN is more about overall cluster performance rather than individual queries, and you shouldn’t read too much into specific times on a dev server with an unrepresentative overall workload.
[bda7node1.rittmandev.com:21000] > summary;
+-----------------+--------+----------+----------+---------+------------+-----------+---------------+-------------------------------+
| Operator        | #Hosts | Avg Time | Max Time | #Rows   | Est. #Rows | Peak Mem  | Est. Peak Mem | Detail                        |
+-----------------+--------+----------+----------+---------+------------+-----------+---------------+-------------------------------+
| 10:EXCHANGE     | 1      | 26.78us  | 26.78us  | 7       | 193        | 0 B       | -1 B          | UNPARTITIONED                 |
| 09:AGGREGATE    | 6      | 209.10ms | 262.02ms | 7       | 193        | 6.28 MB   | 10.00 MB      | FINALIZE                      |
| 08:EXCHANGE     | 6      | 63.20us  | 118.89us | 60      | 1.93K      | 0 B       | 0 B           | HASH(d.dest_city)             |
| 05:AGGREGATE    | 6      | 282.56ms | 401.37ms | 60      | 1.93K      | 22.76 MB  | 10.00 MB      |                               |
| 04:HASH JOIN    | 6      | 99.56ms  | 114.14ms | 540.04K | 131.88M    | 12.85 MB  | 5.41 KB       | INNER JOIN, BROADCAST         |
| |--07:EXCHANGE  | 6      | 15.49us  | 17.94us  | 2.81K   | 117        | 0 B       | 0 B           | BROADCAST                     |
| |  02:SCAN HDFS | 1      | 531.08ms | 531.08ms | 469     | 117        | 309.00 KB | 32.00 MB      | airlines.geog_origin o        |
| 03:HASH JOIN    | 6      | 1.20s    | 1.54s    | 15.68M  | 131.88M    | 12.14 MB  | 3.02 KB       | INNER JOIN, BROADCAST         |
| |--06:EXCHANGE  | 6      | 24.29us  | 68.23us  | 1.04K   | 39         | 0 B       | 0 B           | BROADCAST                     |
| |  01:SCAN HDFS | 1      | 287.31ms | 287.31ms | 173     | 39         | 325.00 KB | 32.00 MB      | airlines.geog_dest d          |
| 00:SCAN HDFS    | 6      | 2.34s    | 3.13s    | 131.88M | 131.88M    | 74.03 MB  | 480.00 MB     | airlines.flight_delays_full f |
+-----------------+--------+----------+----------+---------+------------+-----------+---------------+-------------------------------+
A point to note is that I found it very hard to get Impala queries to run when I got down to specifying virtual core and memory limits rather than just overall weightings, so I’d go with these high-level resource pool prioritisations which seemed to work and didn’t unduly affect query response times. For example the setting below looked clever, but queries always seemed to time out and I never really got a satisfactory setup working properly.

Note that for YARN dynamic resource pools to be used, all Linux/CDH users will need to be assigned to resource pools so they don't run as "unconstrained"; this can also be done from the Dynamic Resource Pools configuration page.
Finally though, all of this management through resource pools might not be the best way to control resource usage by YARN. The Cloudera docs say quite clearly on the Integrated Resource Management page that:
"When using YARN with Impala, Cloudera recommends using the static partitioning technique (through a static service pool) rather than the combination of YARN and Llama. YARN is a central, synchronous scheduler and thus introduces higher latency and variance which is better suited for batch processing than for interactive workloads like Impala (especially with higher concurrency). Currently, YARN allocates memory throughout the query, making it hard to reason about out-of-memory and timeout conditions.
What this means in-practice is that, if you’ve got a single project using the Big Data Appliance and you just want to specify at a high-level what proportion of resources Impala, HBase, MapReduce and the other services under YARN management use, you can define this as static service pool settings in Cloudera Manager and have these restrictions enforced by Linux Cgroups. In the screenshot below I unwound all of the dynamic resource pool settings I created a moment ago and allocated 25% of overall cluster resources to Impala, with the wizard then using those top-level values to set limits for services across all nodes in the cluster based on their actual RAM and CPU, the services running on them and so on.

Then, going back to Cloudera Manager and running some queries, you can see these static service pool limits being applied in real-time and their effect in the form of graphs for particular cluster resources.

So given all of this, what was our recommendation to the client about how best to set up resource management for Impala and other workloads on their Big Data Appliance? Not too much should be read into individual numbers - it's hard to simulate a proper mixed workload on a development server, and of course their BDA has 12 nodes, more memory, faster CPUs. However it's probably fair to say these are the obvious conclusions:
- Running Impala daemons on just a subset of nodes isn't actually a bad way to constrain resources used by Impala, but it'll only work on clusters with a small amount of nodes so that there's a good chance one node will have one of the three copies of a data block. On a system of the scale of our customer's, we'll probably hit unacceptable overheads in terms of block locality. I would not carry on with this approach because of that.
- If the customer BDA will be running a mixed workload, i.e. data loading, long-running Hive/Pig/Spark jobs as well as short-running Impala jobs, enabling Impala for YARN and setting overall resource pools for applications would be the best approach, but individual Impala queries will probably run slower than now (even given the restriction in resources), due to the overhead YARN imposes when scheduling and running jobs. But this will be the best way to allocate resource between applications and provide a generally "smoother" experience for users
- If the BDA needs to be optimised mostly for Impala queries, then don't manage Impala under YARN, leave it outside of this and just use Static service pools to allocate Impala roughly 25% of resources across all nodes. In both this and the previous instance (Impala on YARN) then all nodes should be re-enabled for Impala so as to minimize issues over block locality
- If the only real issue is Impala queries for a particular application taking all resources/becoming runaway, Impala could be left outside of YARN but enabled for admission control so as to limit the total number of running/queued queries for a particular application.