Using Python to ‘Wrangle’ Your Messy Data

or How to Organize Your Comic Book Collection Based on Issue Popularity
In addition to being a product manager at Rittman Mead, I consider myself to be a nerd of the highest order. My love of comic books, fantasy, sci-fi and general geekery began long before the word ‘Stark’ had anything to do with Robert Downey Jr or memes about the impending winter. As such, any chance to incorporate my hobbies into my work is a welcomed opportunity. For my next few blog entries, I’ve decided to construct a predictive classification model using comic book sales data whose eventual goal will be to build a model that can accurately predict whether a comic will rocket off the shelves or if it will be a sales dud. The first blog of the series shows some of the pitfalls that can come up when preparing your data for analysis. Data preparation, or data wrangling as it has come to be known, is an imperfect process that usually takes multiple iterations of transformation, evaluation and refactoring before the data is “clean” enough for analysis.
While the steps involved in data wrangling vary based on the state and availability of the raw data, for this blog I have chosen to focus on the gathering of data from disparate sources, the enrichment of that data by merging their attributes and the restructuring of it to facilitate analysis. Comic book sales data is readily available on the interwebs, however finding that data in a usable format proved to be a more difficult task. In the end, I had to resort to dreaded process of screen scraping the data from a comic research site. For those of you who are lucky enough be unfamiliar with it, screen scraping is the process of programmatically downloading HTML data and stripping away that formatting to make it suitable for use. This is generally used as a last resort because web sites are volatile creatures that are prone to change their appearance as often as my teenage kids do preparing to leave the house. However, for the purposes of this series, as my friend Melvin the handyman would often say, “We works with what we gots.”
![]() This leads us to the first issue you may run into while wrangling your data. You have access to lots of data but it’s not pretty. So make it pretty. Working with raw data is like being a sculptor working with wood. Your job is not to change the core composition of the data to suit your purposes but to chip away at the excess to reveal what was there all along, a beautiful horse… er I mean insight. Sorry, I got lost in my analogy. Actually to expand on this analogy a bit, the first tool I pulled out of my toolbox for this project was Python, the Leatherman of programming languages. Python is fast, plays well with other technologies and most importantly in this case, Python is ubiquitous. Used for tasks ranging from process automation and ETL to gaming and academic pursuits, Python is truly a multipurpose tool. As such, if you have a functional need, chances are there is a native module or someone has already written a public library to perform that function. In my case, I needed some scripts to “scrape” HTML tables containing comic sales data and combine that data with other comic data that I retrieved elsewhere. The “other” data is metadata about each of the issues. Metadata is just data about data. In this case, information about who authored it, how it was sold, when it was published, etc... More on that later.
This leads us to the first issue you may run into while wrangling your data. You have access to lots of data but it’s not pretty. So make it pretty. Working with raw data is like being a sculptor working with wood. Your job is not to change the core composition of the data to suit your purposes but to chip away at the excess to reveal what was there all along, a beautiful horse… er I mean insight. Sorry, I got lost in my analogy. Actually to expand on this analogy a bit, the first tool I pulled out of my toolbox for this project was Python, the Leatherman of programming languages. Python is fast, plays well with other technologies and most importantly in this case, Python is ubiquitous. Used for tasks ranging from process automation and ETL to gaming and academic pursuits, Python is truly a multipurpose tool. As such, if you have a functional need, chances are there is a native module or someone has already written a public library to perform that function. In my case, I needed some scripts to “scrape” HTML tables containing comic sales data and combine that data with other comic data that I retrieved elsewhere. The “other” data is metadata about each of the issues. Metadata is just data about data. In this case, information about who authored it, how it was sold, when it was published, etc... More on that later.
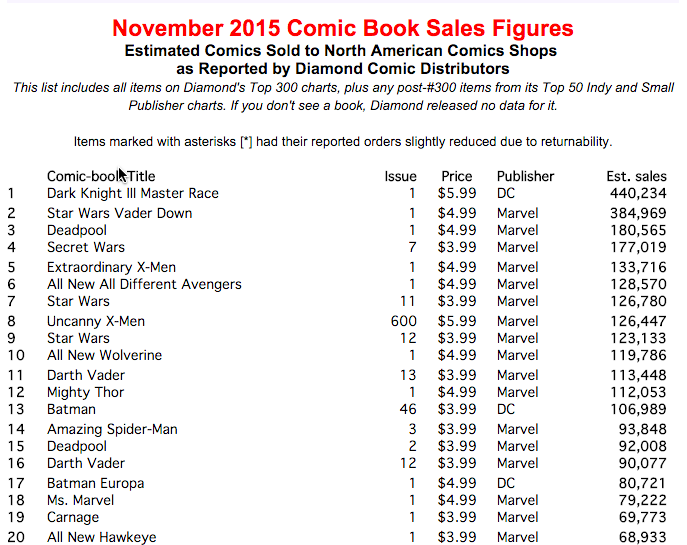 Luckily for me, the format of the data I was scraping was tabular, so extracting the data and transforming it into Python objects was a relatively simple matter of iterating through the table rows and binding each table column to the designated Python object field. There was still a lot of unnecessary content on the page that needs to be ignored, like the titles and all of the other structural tags, but once I found the specific table holding the data, I was able to isolate it. At that point, I wrote the objects to to a CSV file, to make the data easy to transport and to facilitate usability by other languages and/or processes.
The heavy lifting in this process was performed by three different Python modules: urllib2, bs4 and csv. Urllib2, as the name implies, provides functions to open URLs. In this case, I found a site that hosted a page containing the estimated issue sales for every month going back to the early 1990’s. To extract each month without manually updating the hardcoded URL over and over, I created a script that accepted MONTH and YEAR as arguments, month_sales_scraper.py
The response from the urlopen(url) function call was the full HTML code that is typically rendered by a web browser. In that format, it does me very little good, so I needed to employ a parser to extract the data from the HTML. In this context, a parser is a program that is used to read in a specific document format, break it down into its constituent parts while preserving the established relationships between those parts, and then finally provide a means to selectively access said parts. So an HTML parser would allow me to easily access all the <TD> column tags for a specific table within an HTML document. For my purposes, I chose BeautifulSoup, or bs4.
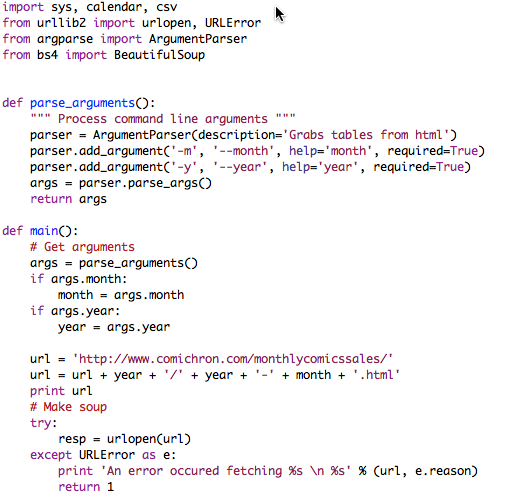
BeautifulSoup provided search functions that I used to find the specific HTML table containing the sales data and loop through each row, while using the column values to populate a Python object.
This Python object, named data, contains fields populated with data from different sources. The year and month are populated using the arguments passed to the module. The format field is dynamically set based on logic related to the rankings and the remaining fields are set based on their source’s position in the HTML table. As you can see, there is a lot of hard coded logic that would need to be updated, should the scraped site change their format. However, for now this logic gets it done.
The final step of this task was to write those Python objects to a CSV file. The python module, CSV, provides the function writerow(), which accepts an array as a parameter and writes each of the array elements as columns in the CSV.
![]()
My first pass raised the an exception because the title field contained unicode characters that the CSV writer could not handle.
![]()
To rectify this, I had to add a check for unicode and encoded the content as UTF-8. Unicode and UTF-8 are character encodings; meaning they provide a map computers use to identify characters. This includes alphabets and logographic symbols from different languages as well as common symbols like ®.
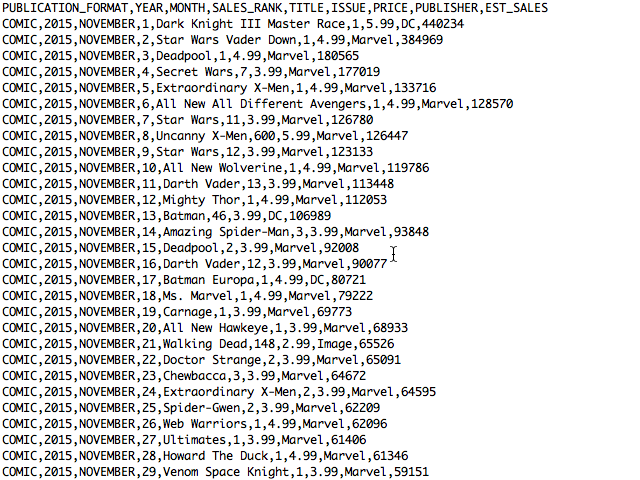
Additionally, there was the matter of reformatting the values of some of the numeric fields to allow math to be performed on them later(ie stripping ‘$’ and commas). Other than that, the data load went pretty smoothly. A file named (MONTH)_(YEAR).CSV was generated for each month. Each file turned out like so:
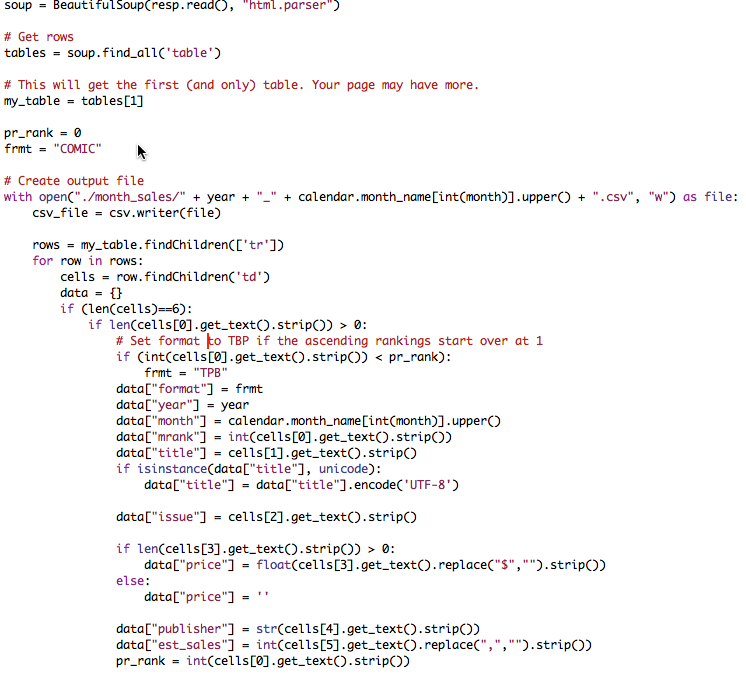
While this generated tens of thousands of rows of comic sales data, it was not enough. Rather, it had the volume but not the breadth of information I needed. In order to make an accurate prediction, I needed to feed more variables to the model than just the comic’s title, issue number, and price. The publisher was not relevant as I decided to limit this exercise to only Marvel comics and passing in the the estimated sales would be cheating, as rank is based on sales. So to enhance my dataset, I pulled metadata about each of the issues down from “the Cloud” using Marvel’s Developer API. Thankfully, since the API is a web service, there was no need for screen scraping.
![]() Retrieving and joining this data was not as easy as one might think. My biggest problem was that the issue titles from the scraped source were not an exact match to the titles stored in the Marvel database. For example, the scraped dataset lists one title as ‘All New All Different Avengers”. Using their API to search the Marvel database with that title retrieved no results. Eventually, I was able to manually find it in their database listed as “All-New All-Different Avengers”. In other cases, there were extra words like “The Superior Foes of Spider-Man” vs “Superior Foes of Spider-Man”. So in order to perform a lookup by name, I needed to know the titles as they expected them. To do this I decided to pull a list of all the series titles whose metadata was modified during the timeframes for which I had sales data. Again, I ran into a roadblock. The Marvel API only allows you to retrieve up to 100 results per request and Marvel has published thousands of titles. To get around this I had to perform incremental pulls, segmented alphabetically.
Retrieving and joining this data was not as easy as one might think. My biggest problem was that the issue titles from the scraped source were not an exact match to the titles stored in the Marvel database. For example, the scraped dataset lists one title as ‘All New All Different Avengers”. Using their API to search the Marvel database with that title retrieved no results. Eventually, I was able to manually find it in their database listed as “All-New All-Different Avengers”. In other cases, there were extra words like “The Superior Foes of Spider-Man” vs “Superior Foes of Spider-Man”. So in order to perform a lookup by name, I needed to know the titles as they expected them. To do this I decided to pull a list of all the series titles whose metadata was modified during the timeframes for which I had sales data. Again, I ran into a roadblock. The Marvel API only allows you to retrieve up to 100 results per request and Marvel has published thousands of titles. To get around this I had to perform incremental pulls, segmented alphabetically.
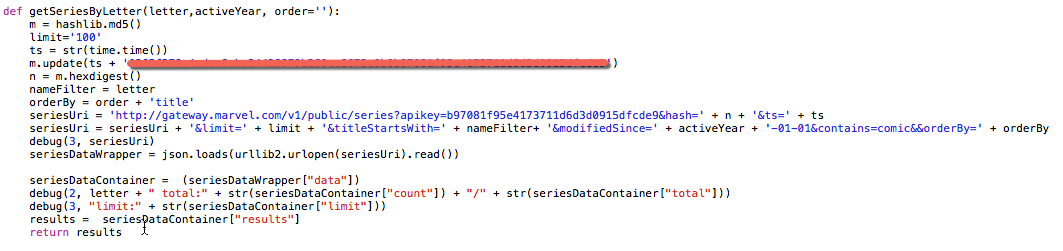
Even then there were a few minor issues, as some letters like ‘S’ had more than 100 titles. To get around that I had to pull the list for ‘S’ titles sorted ascending and descending then combine the results, making sure to remove duplicates. So my advice on this one is be sure to read up on the limitations of any API you are using. It may enforce limits but you may be able to work around the limits using creative querying.
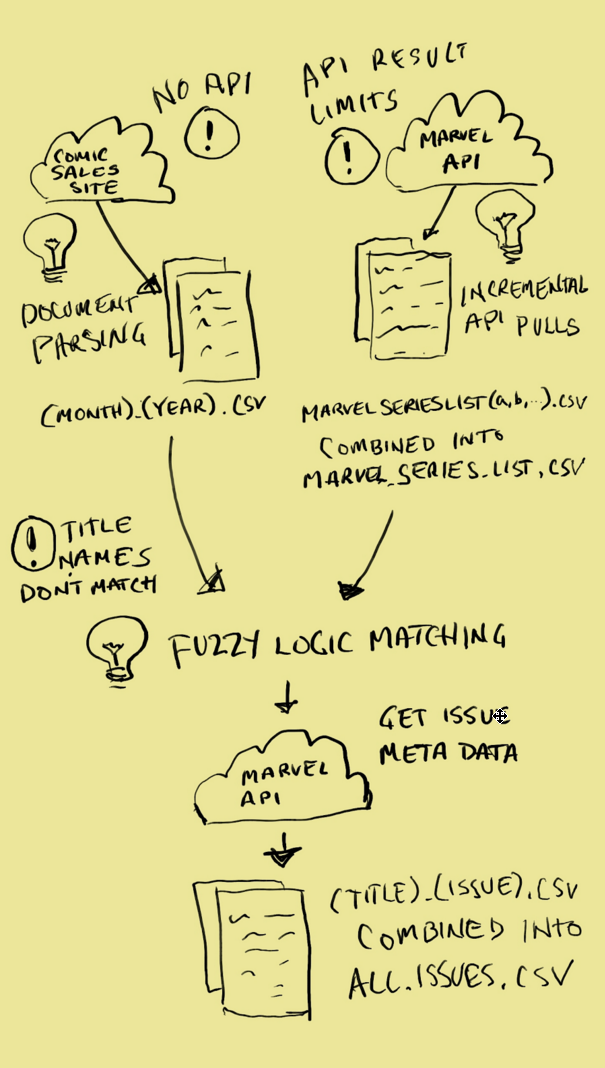
At this point I have my list of Marvel series titles, stored in some CSV files that I eventually combined into a single file, MarvelSeriesList.csv, for ease of use. Actually, I have more than that. While retrieving the series titles, I also pulled down the ID for the series and an appropriateness rating. Searching the API by ID will be much more accurate than name and the appropriateness rating may be useful when building out the prediction model. The next step was to iterate through each row of the CSVs we created from the sales data, find the matching ID from MarvelSeriesList.csv and use that ID to retrieve its metadata using the API.
![]() If you remember, the point of doing that last step was that the titles stored in the sales data files don’t match the titles in the API, so I needed to find a way to join the two sources. Rather than writing cases to handle each of the scenarios (e.g. mismatched punctuation, extra filler words), I looked for a python library to perform some fuzzy matching. What I found was a extremely useful library called, Fuzzy Wuzzy. Fuzzy Wuzzy provides a function called extractOne() that allows you to pass in a term and compare it with an array of values. The extractOne() function will then return the term in the array that has the highest match percentage. Additionally, you can specify a lower bound for acceptable matches (ie. only return result where the match is >= 90%).
If you remember, the point of doing that last step was that the titles stored in the sales data files don’t match the titles in the API, so I needed to find a way to join the two sources. Rather than writing cases to handle each of the scenarios (e.g. mismatched punctuation, extra filler words), I looked for a python library to perform some fuzzy matching. What I found was a extremely useful library called, Fuzzy Wuzzy. Fuzzy Wuzzy provides a function called extractOne() that allows you to pass in a term and compare it with an array of values. The extractOne() function will then return the term in the array that has the highest match percentage. Additionally, you can specify a lower bound for acceptable matches (ie. only return result where the match is >= 90%).
Again, it took a few passes to get the configuration to work effectively. The first time through about only about 65% of the titles in the sales file found a match. That was throwing away too much data for my liking so I had to look at the exceptions and figure out why the matches were falling through. One issue that I found was titles that tacked on the publication years in the Marvel database, like “All-New X-Men (2012)”, had a match score in the 80’s when matched against a sales title like, “All New X-Men”. This was a pretty consistent issue, so rather than lowering the match percentage, which could introduce some legitimate mismatches, I decided to strip the year, if present, on mismatches and run it through that matching process again. This got me almost there. The only other issue I ran into was Fuzzy Wuzzy had trouble matching acronyms/acrostics. So ‘S.H.E.I.L.D.’ had a match score in the 50’s when matching ‘SHIELD’. That’s because half the characters (periods) were missing. Since there were only two titles affected, I built a lookup dictionary of special cases that needed to be translated. For the purposes of this exercise, I would still have had enough matches to skip that step, but by doing it brought us up to 100% matching between the two sources. Once the matching function was working, I pulled out urllib2 and retrieved all the metadata I could for each of the issues.
The resulting files contained not only sales data (title, issue number, month rank, estimated sales), but information about the creative team, issue descriptions, characters, release dates and associated story arcs. This would be enough to get us started with building our predictive classification model.
 That being said, there was still a lot of structural rearranging required to make it ready for the type of analysis I wanted to do, but we will deal with that in the next blog. Hopefully, you picked up some useful tips on how to combine data from different sources or at the very least found solace in knowing that while you may not be the coolest person in the world, somewhere out there is a grown man who still likes to read comic books enough to write a blog about it. Be sure to tune in next week, True Believers, as we delve into The Mysteries of R!