New OTN Article - OBIEE Performance Analytics: Analysing the Impact of Suboptimal Design


I’m pleased to have recently had my first article published on the Oracle Technology Network (OTN). You can read it in its full splendour and glory(!) over there, but I thought I’d give a bit of background to it and the tools demonstrated within.
OBIEE Performance Analytics Dashboards
One of the things that we frequently help our clients with is reviewing and optimising the performance of their OBIEE systems. As part of this we’ve built up a wealth of experience in the kind of suboptimal design patterns that can cause performance issues, as well as how to go about identifying them empirically. Getting a full stack view on OBIEE performance behaviour is key to demonstrating where an issue lies, prior to being able to resolve it and proving it fixed, and for this we use the Rittman Mead OBIEE Performance Analytics Dashboards.

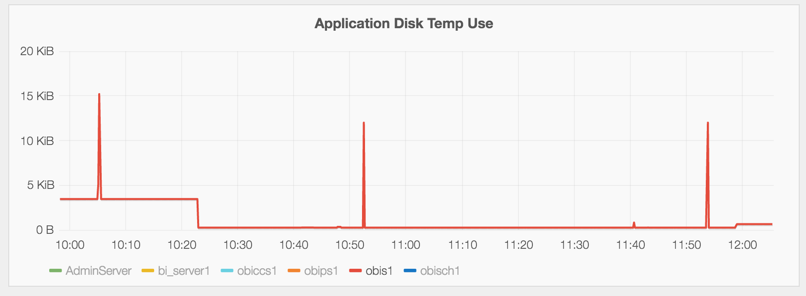
OBIEE implementations that cause heavy use of temporary files on disk by the BI Server can result in performance problems. Until recently in OBIEE, it was really difficult to track because of the transitory nature of the files. By the time the problem had been observed (for example, disk full messages), the query responsible had moved on and so the temporary files deleted. At Rittman Mead we have developed lightweight diagnostic tools that collect, amongst other things, the amount of temporary disk space used by each of the OBIEE components.

https://www.youtube.com/playlist?list=PLFY1_sCDBPebV2mlY7AOUFAq7U1LsMiy7
You can read more about our Performance Analytics offering here, or get in touch to find out more!