An Introduction to Oracle Stream Analytics


Oracle Stream Analytics (OSA) is a graphical tool that provides “Business Insight into Fast Data”. In layman terms, that translates into an intuitive web-based interface for exploring, analysing, and manipulating streaming data sources in realtime. These sources can include REST, JMS queues, as well as Kafka. The inclusion of Kafka opens OSA up to integration with many new-build data pipelines that use this as a backbone technology.
I’ve been exploring OSA from the comfort of my own Mac, courtesy of Docker and a Docker image for OSA created by Guido Schmutz. The benefits of Docker are many and covered elsewhere, but what I loved about it in this instance was that I didn’t have to download a VM that was 10s of GB. Nor did I have to spend time learning how to install OSA from scratch, which whilst interesting wasn’t a priority compared to just trying to tool out and seeing what it could do. [Update] it turns out that installation is a piece of cake, and the download is less than 1Gb … but in general the principle still stands - Docker is a great way to get up and running quickly with something
In this article we’ll take OSA for a spin, looking at some of the functionality and terminology, and then real examples of use with live Twitter data.
To start with, we sign in to Oracle Stream Analytics:
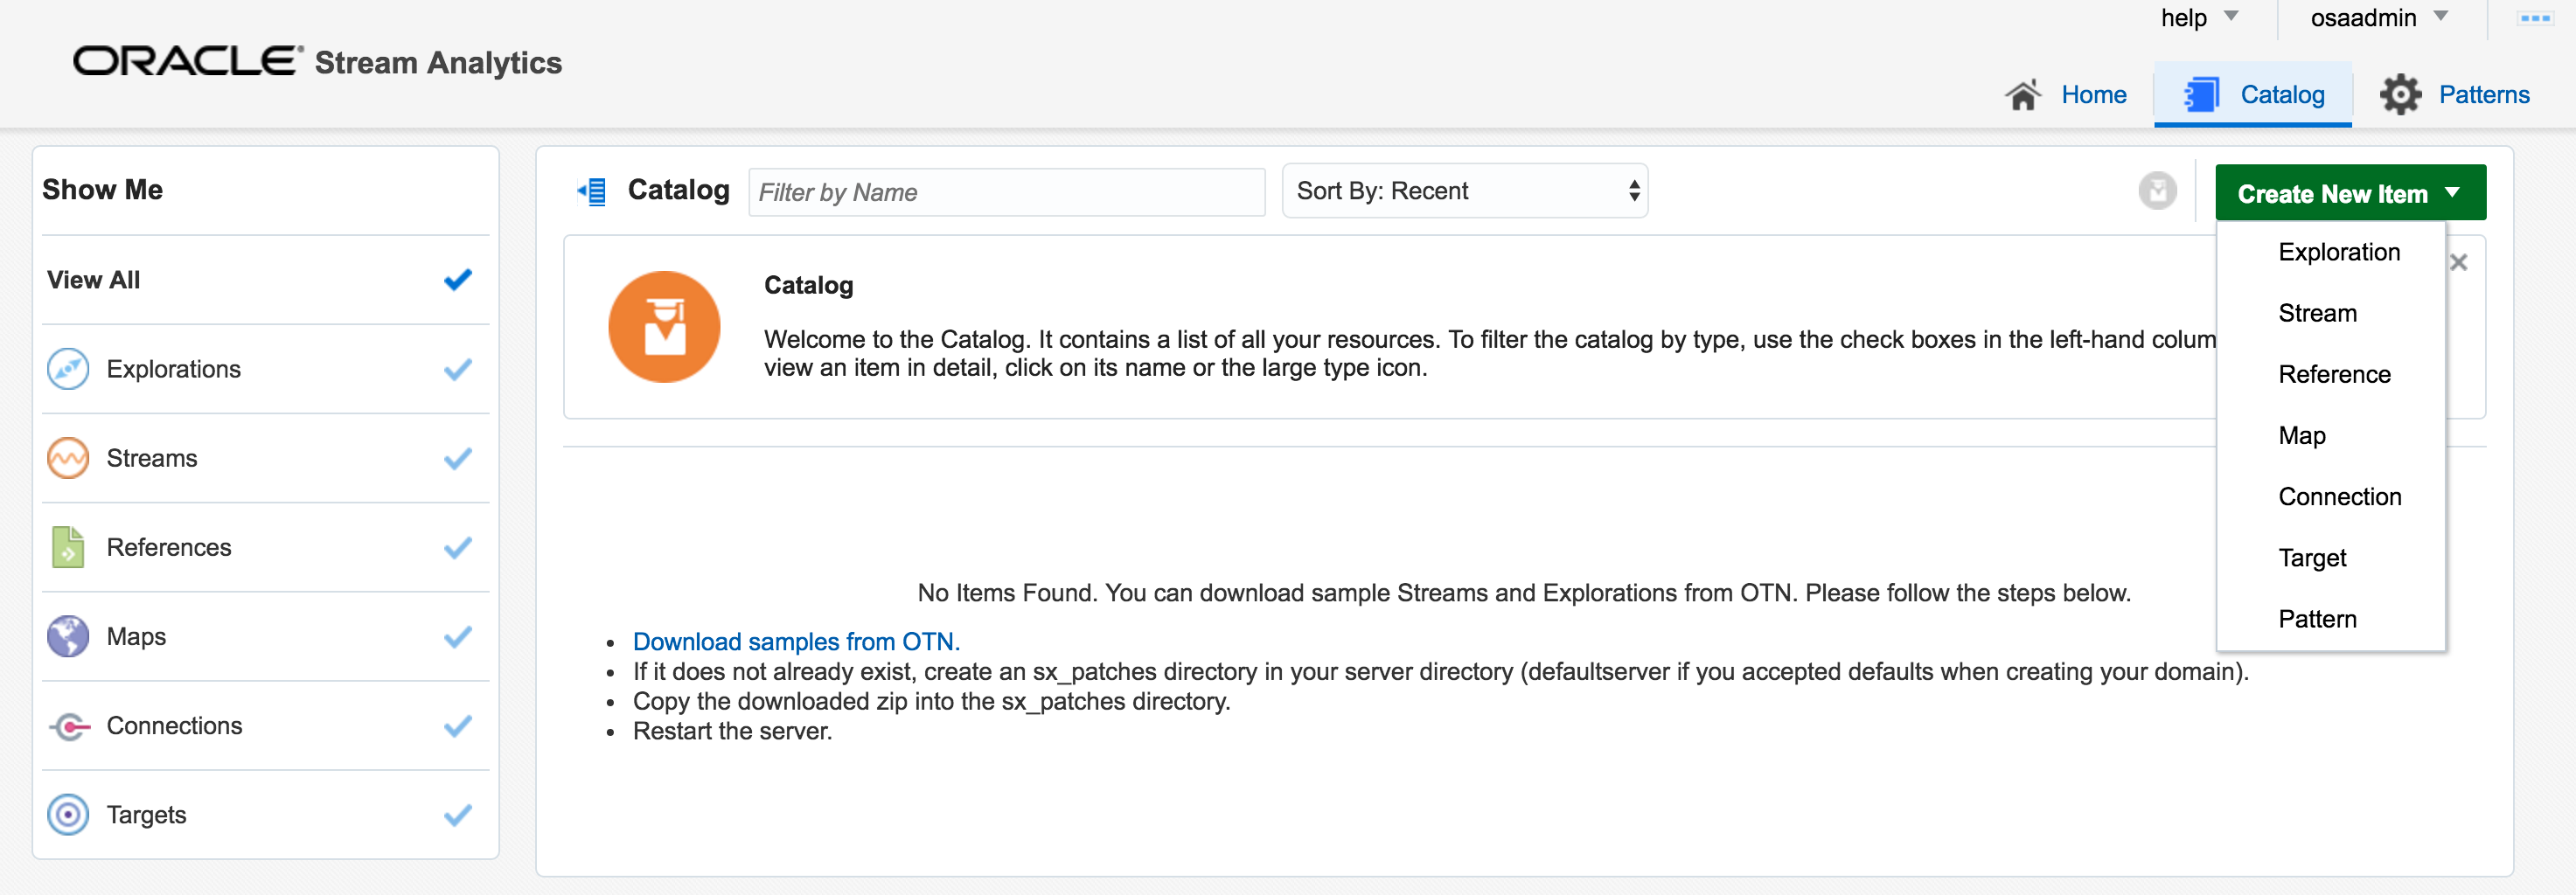
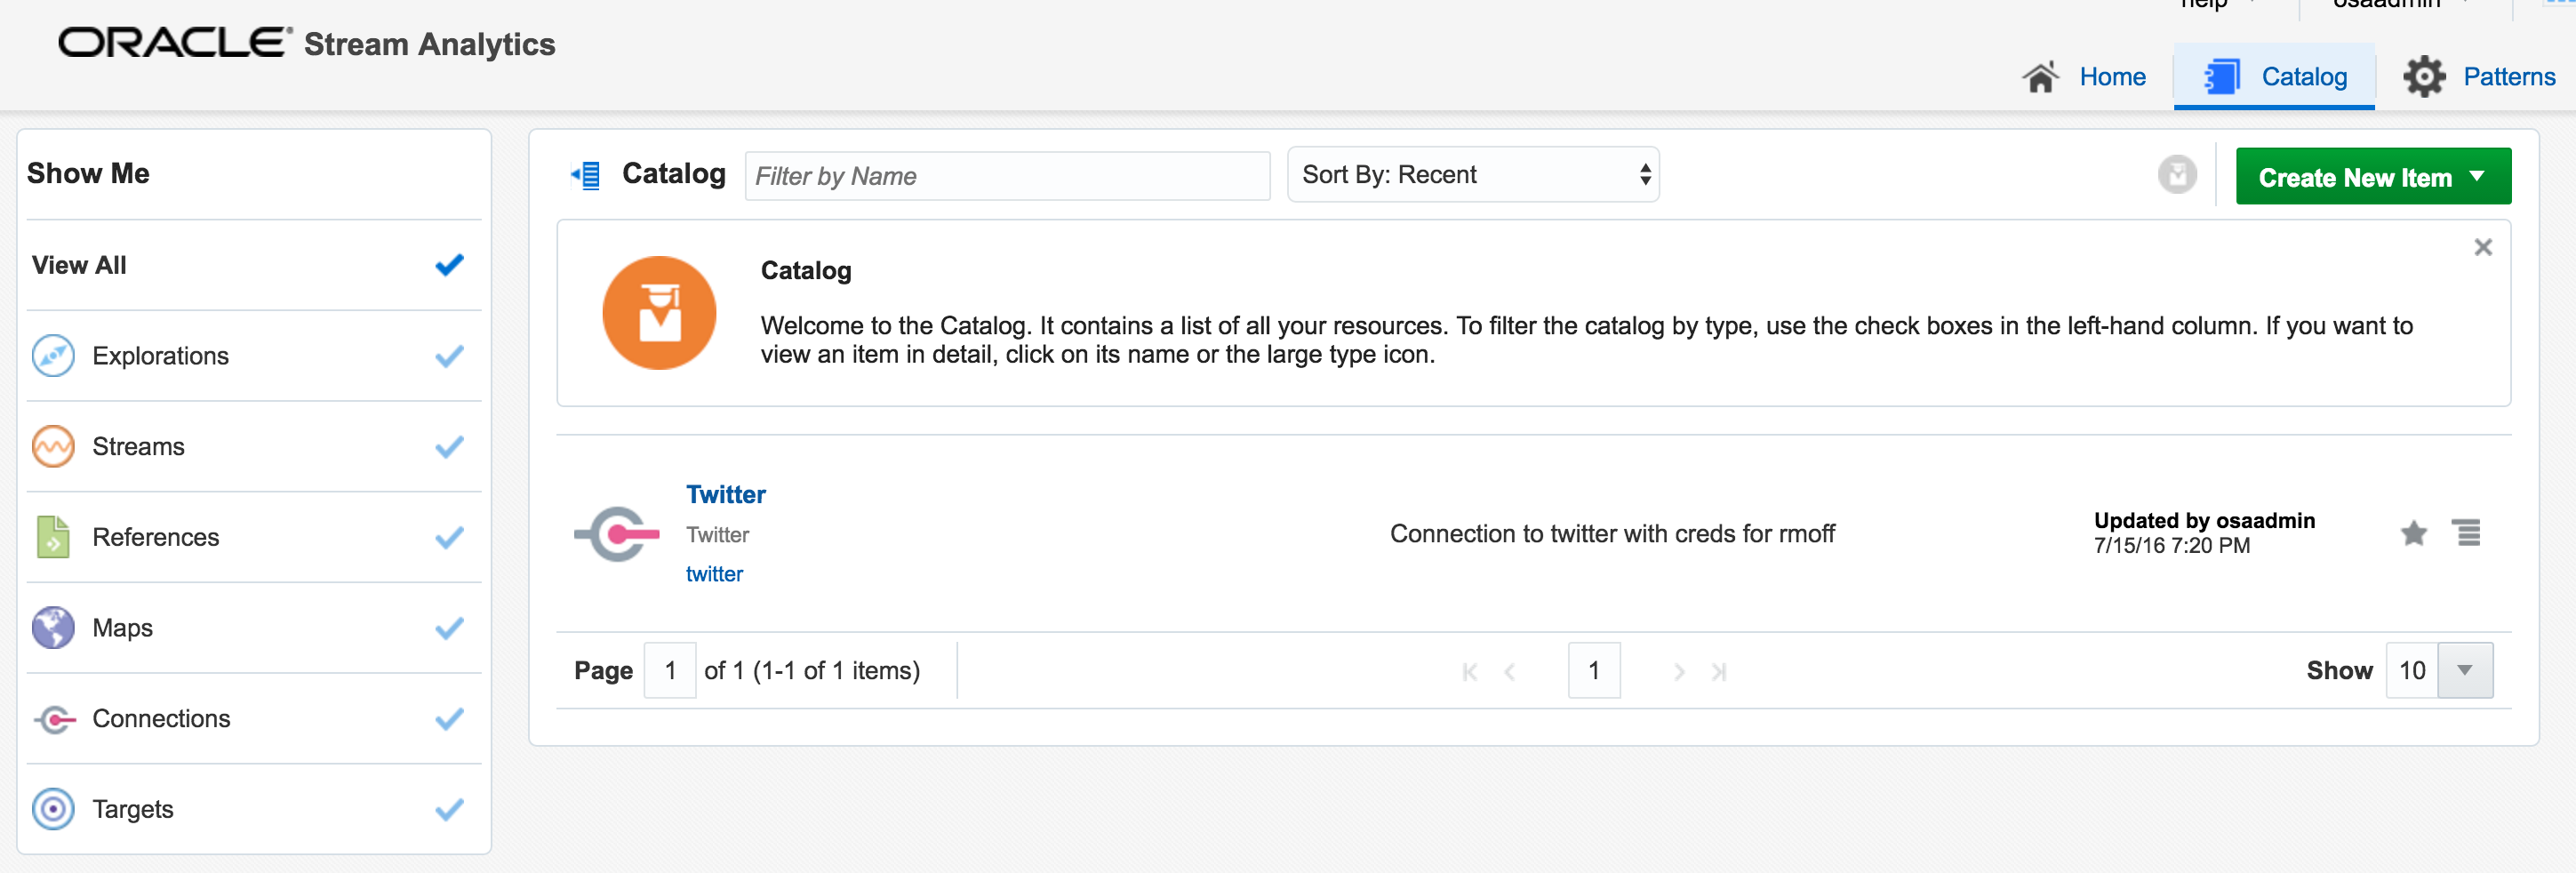
- Streams - definitions of sources of data such as Kafka, JMS, and a dummy data generator (event generator)
- Connections - Servers etc from which Streams are defined
- Explorations - front-end for seeing contents of Streams in realtime, as well as applying light transformations
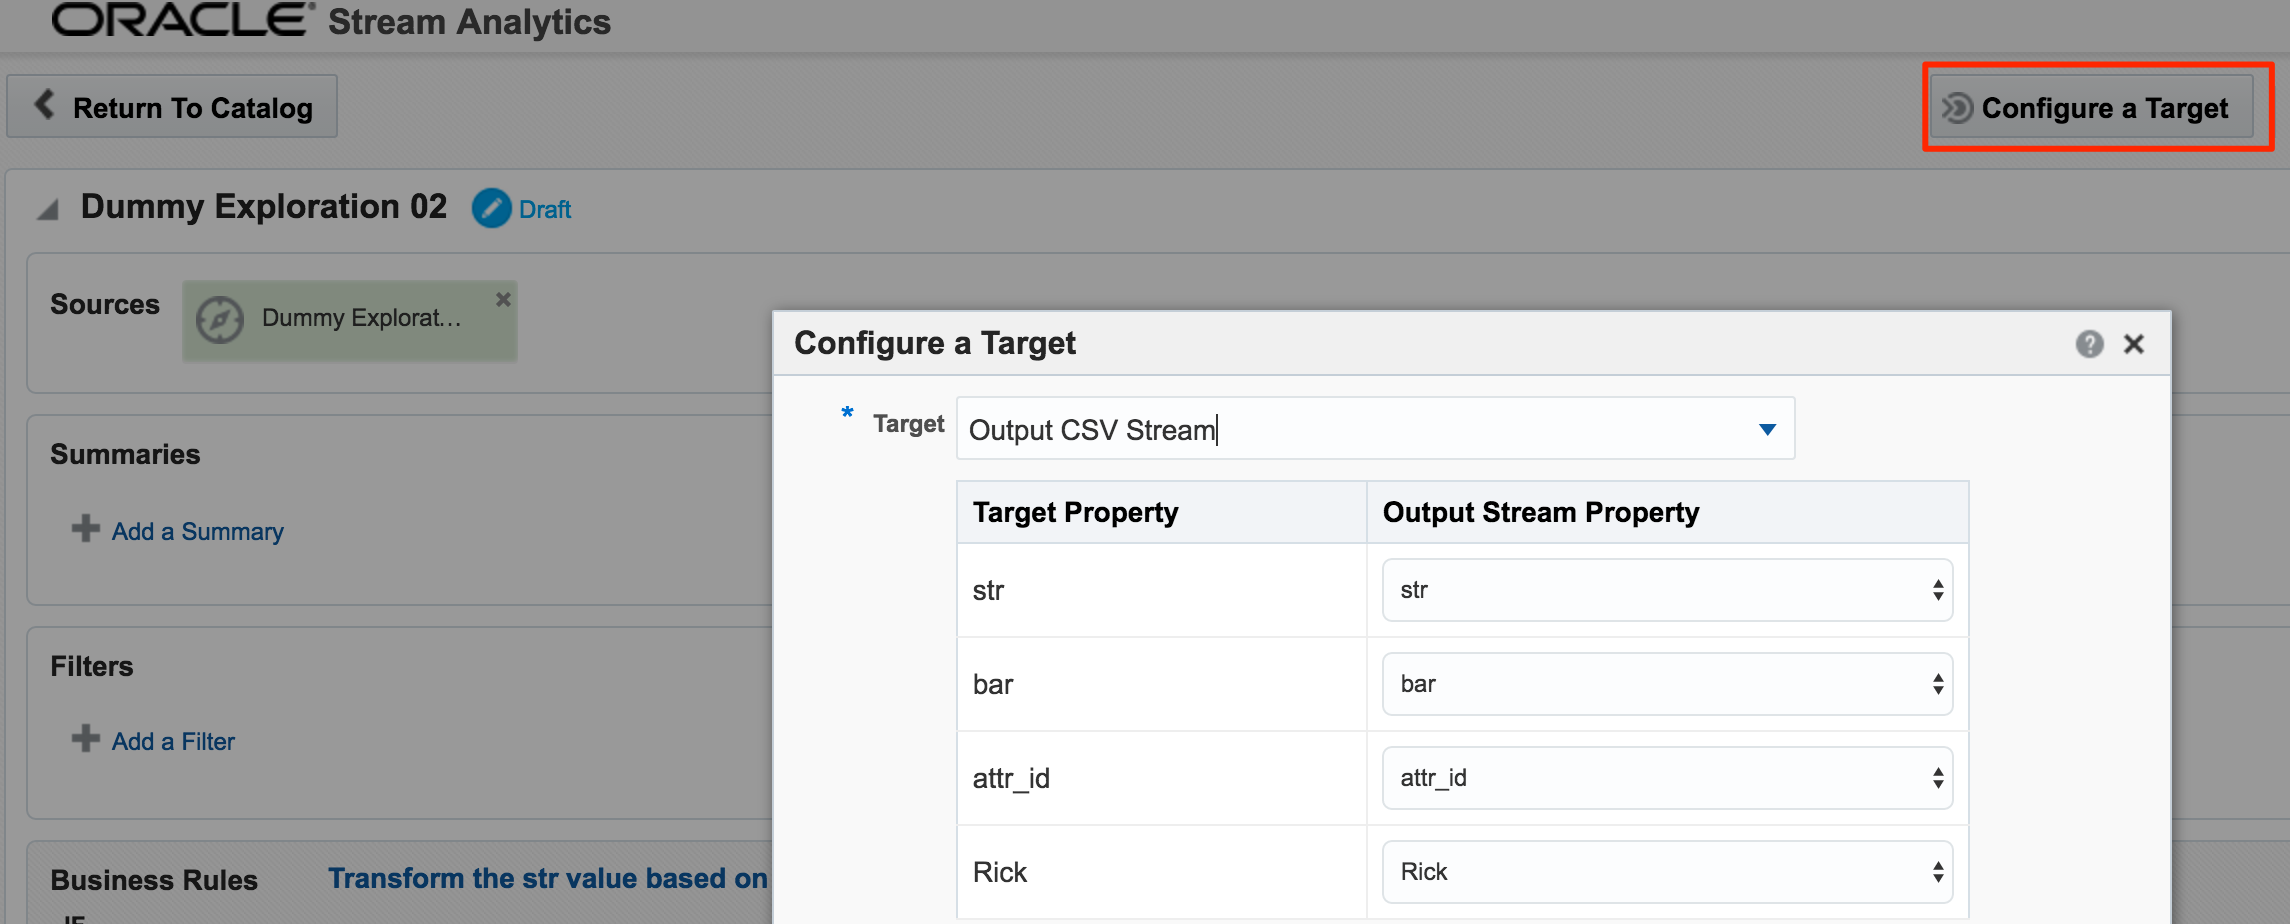
- Targets - destination for transformed streams
Viewing Realtime Twitter Data with OSA
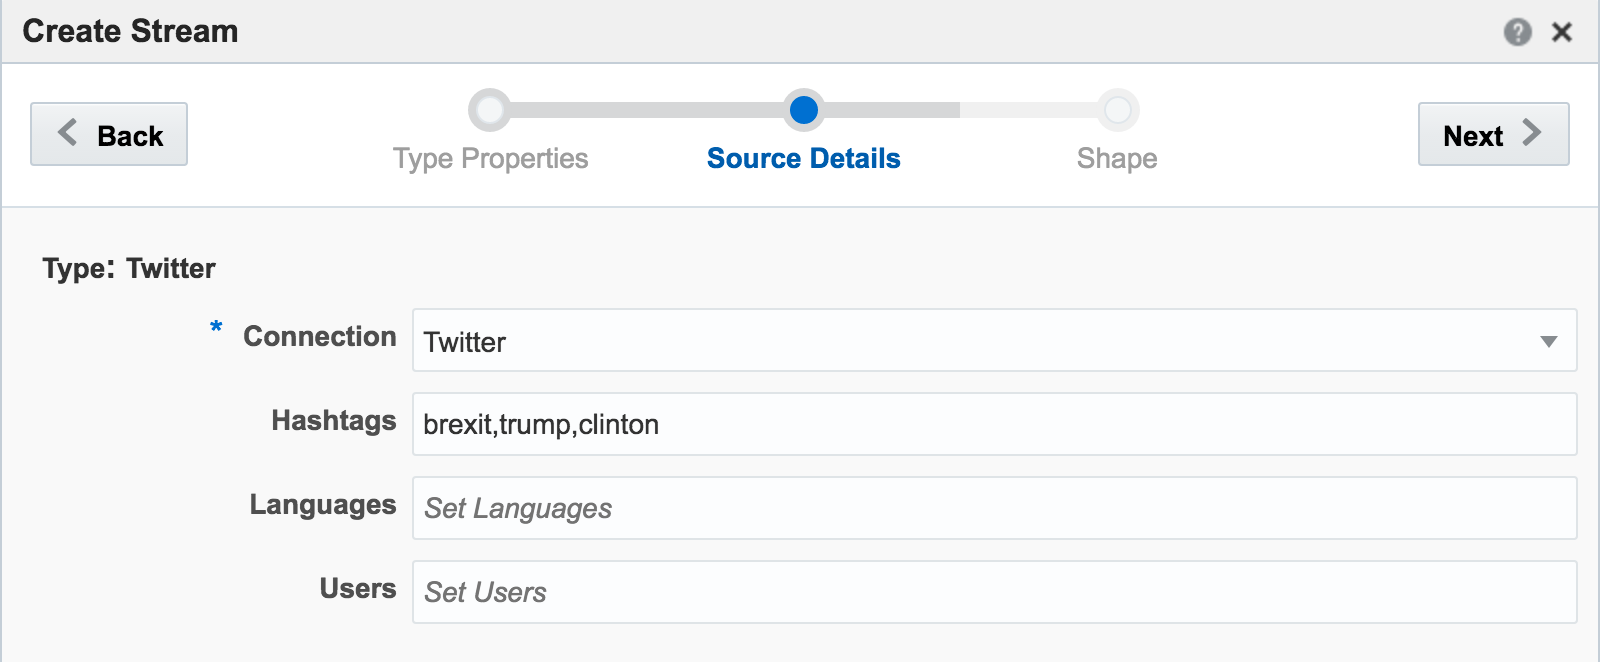
The first example I’ll show is the canonical big data/streaming example everywhere – Twitter. Twitter is even built into OSA as a Stream source. If you go to https://dev.twitter.com you can get yourself a set of credentials enabling you to query the live Twitter firehose for given hashtags or users.
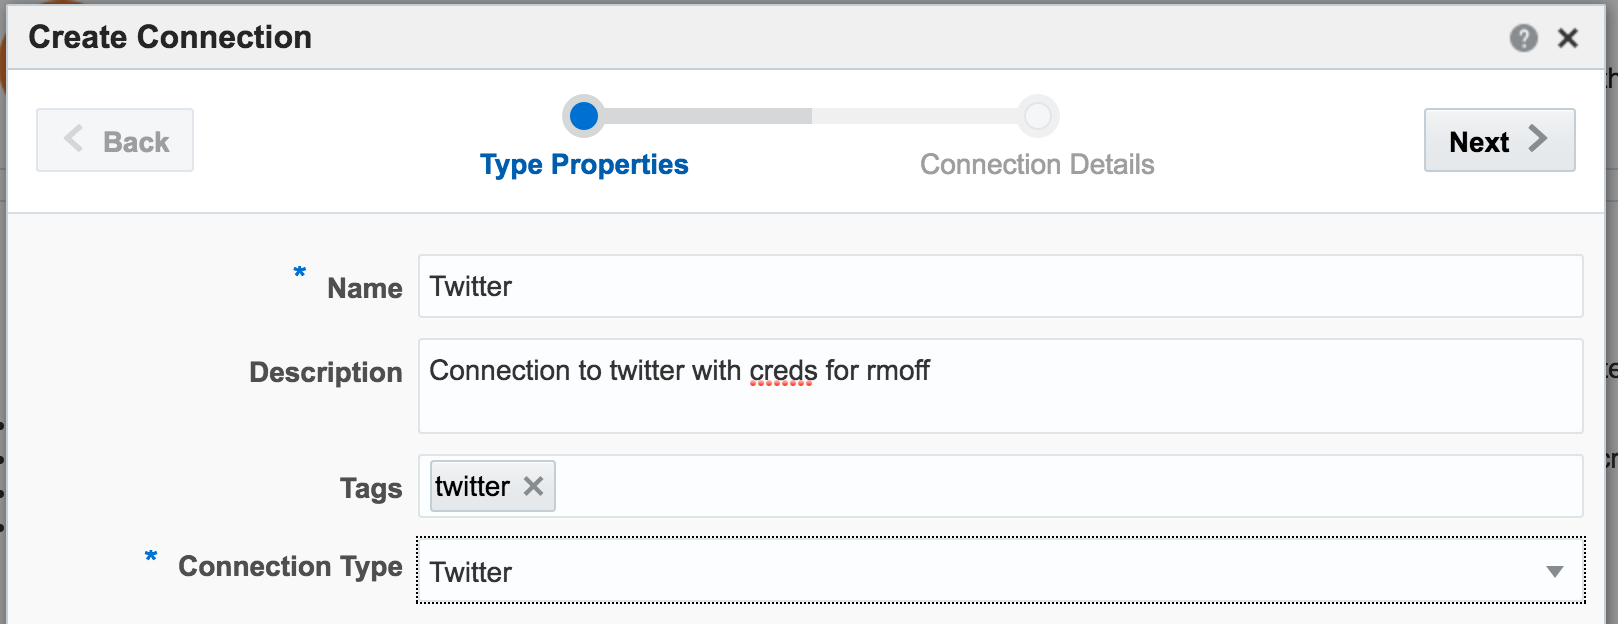
With my twitter dev credentials, I create a new Connection in OSA:
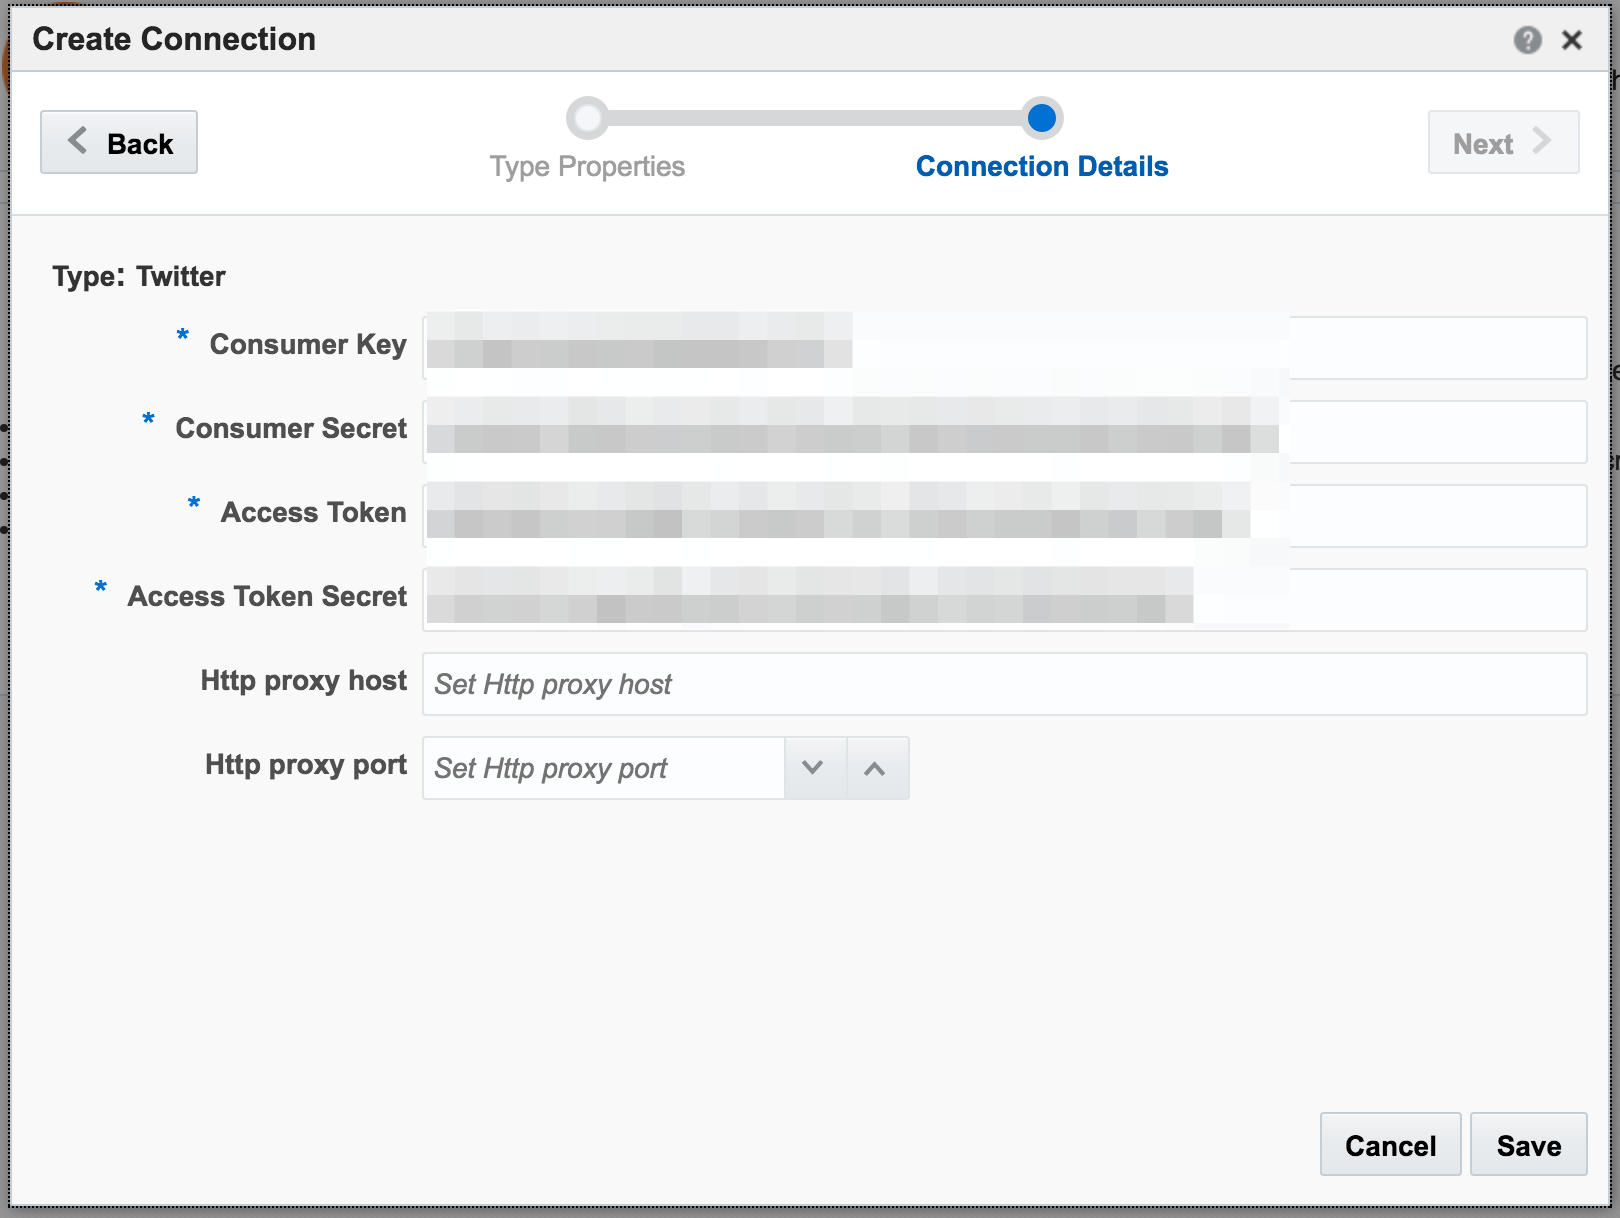
Unable to deploy OEP application then check the OSA log file for errors such as unable to reach Twitter, or invalid credentials.
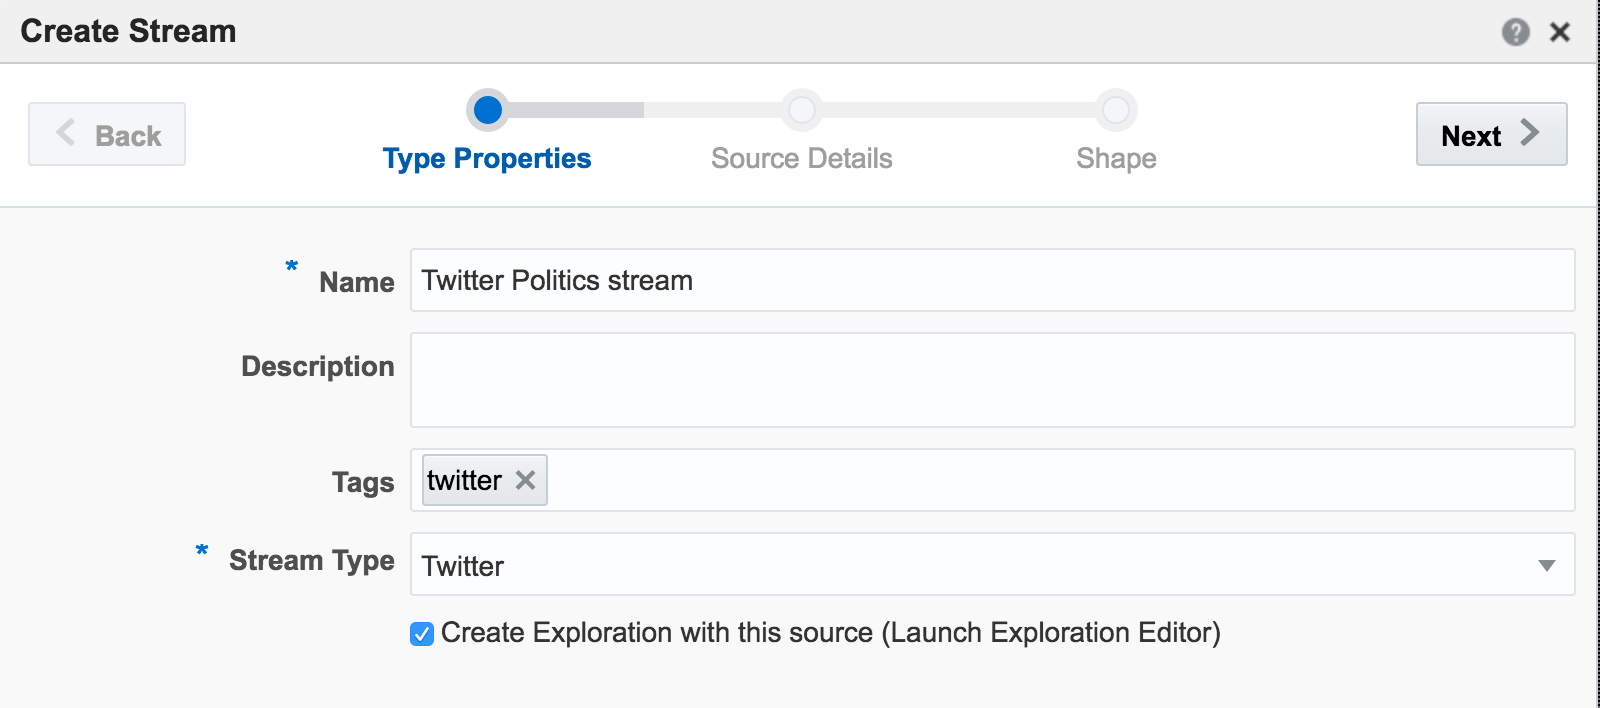
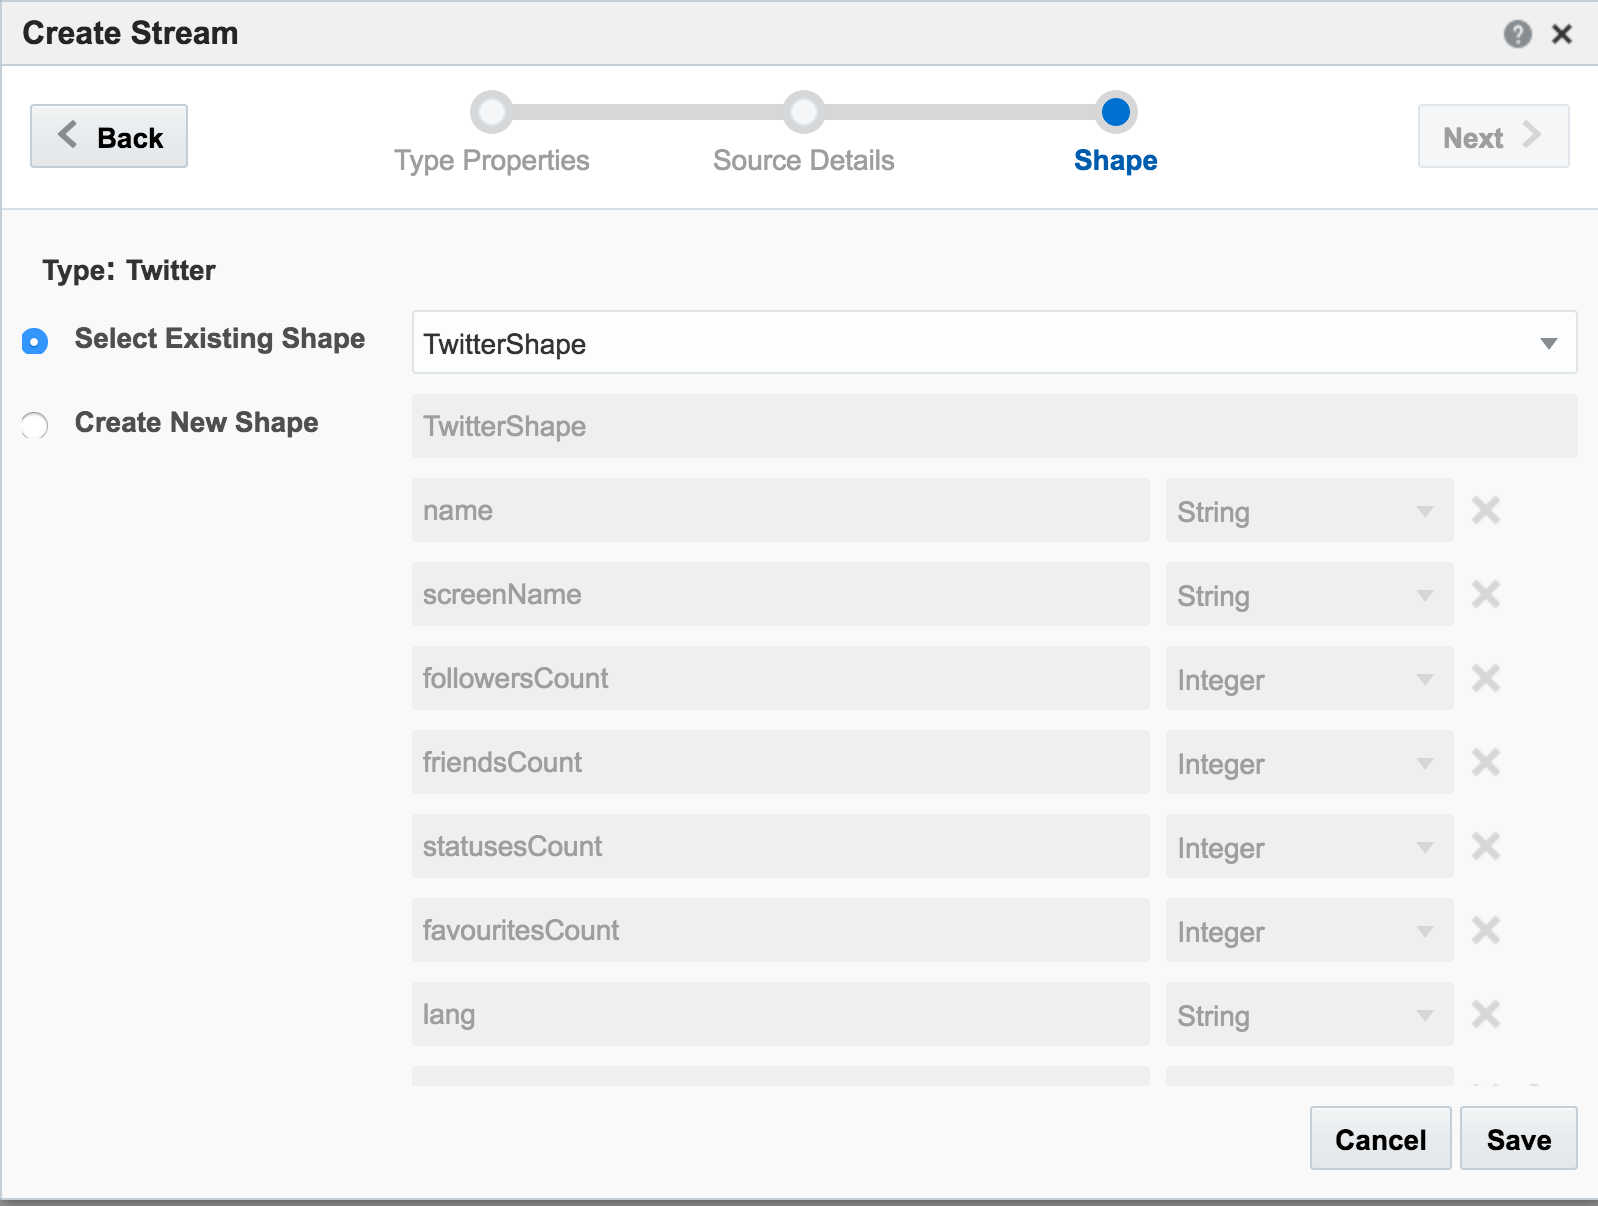
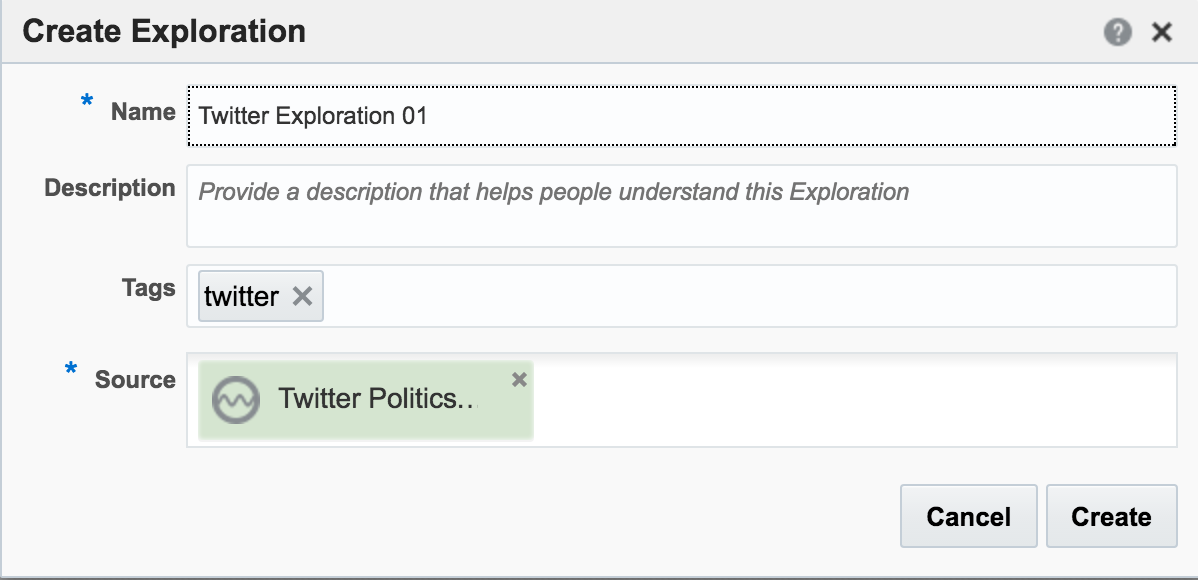
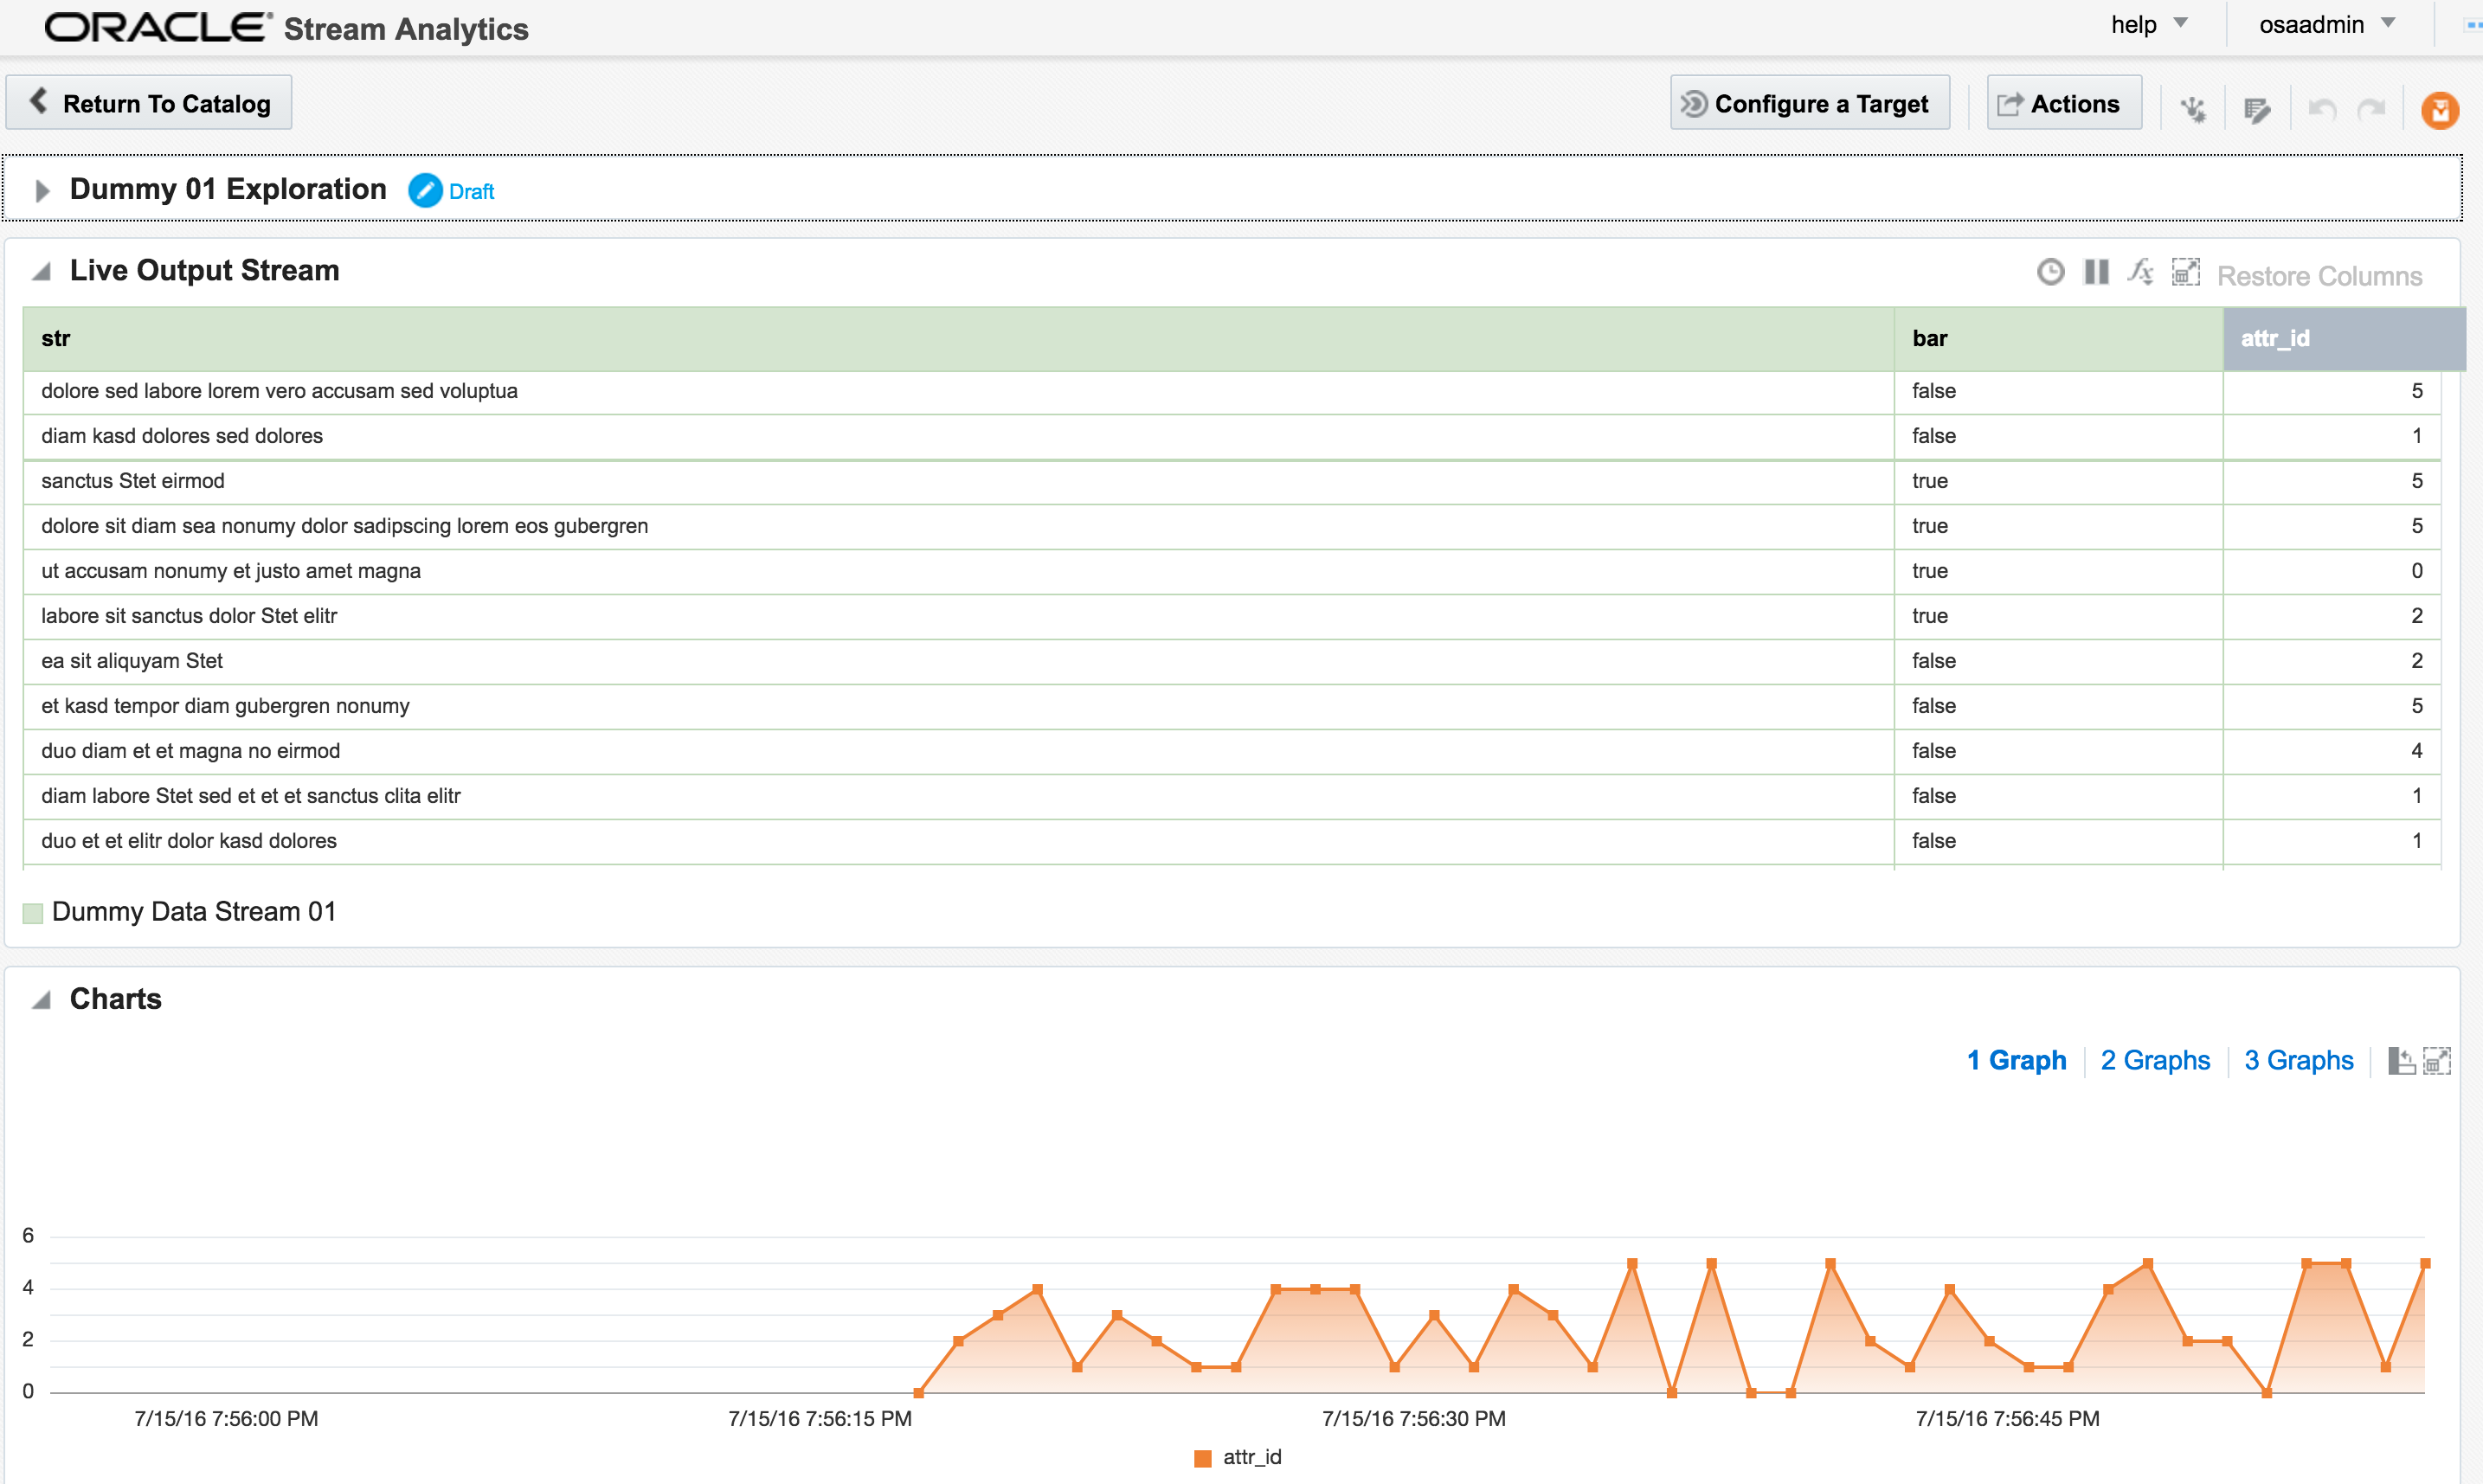
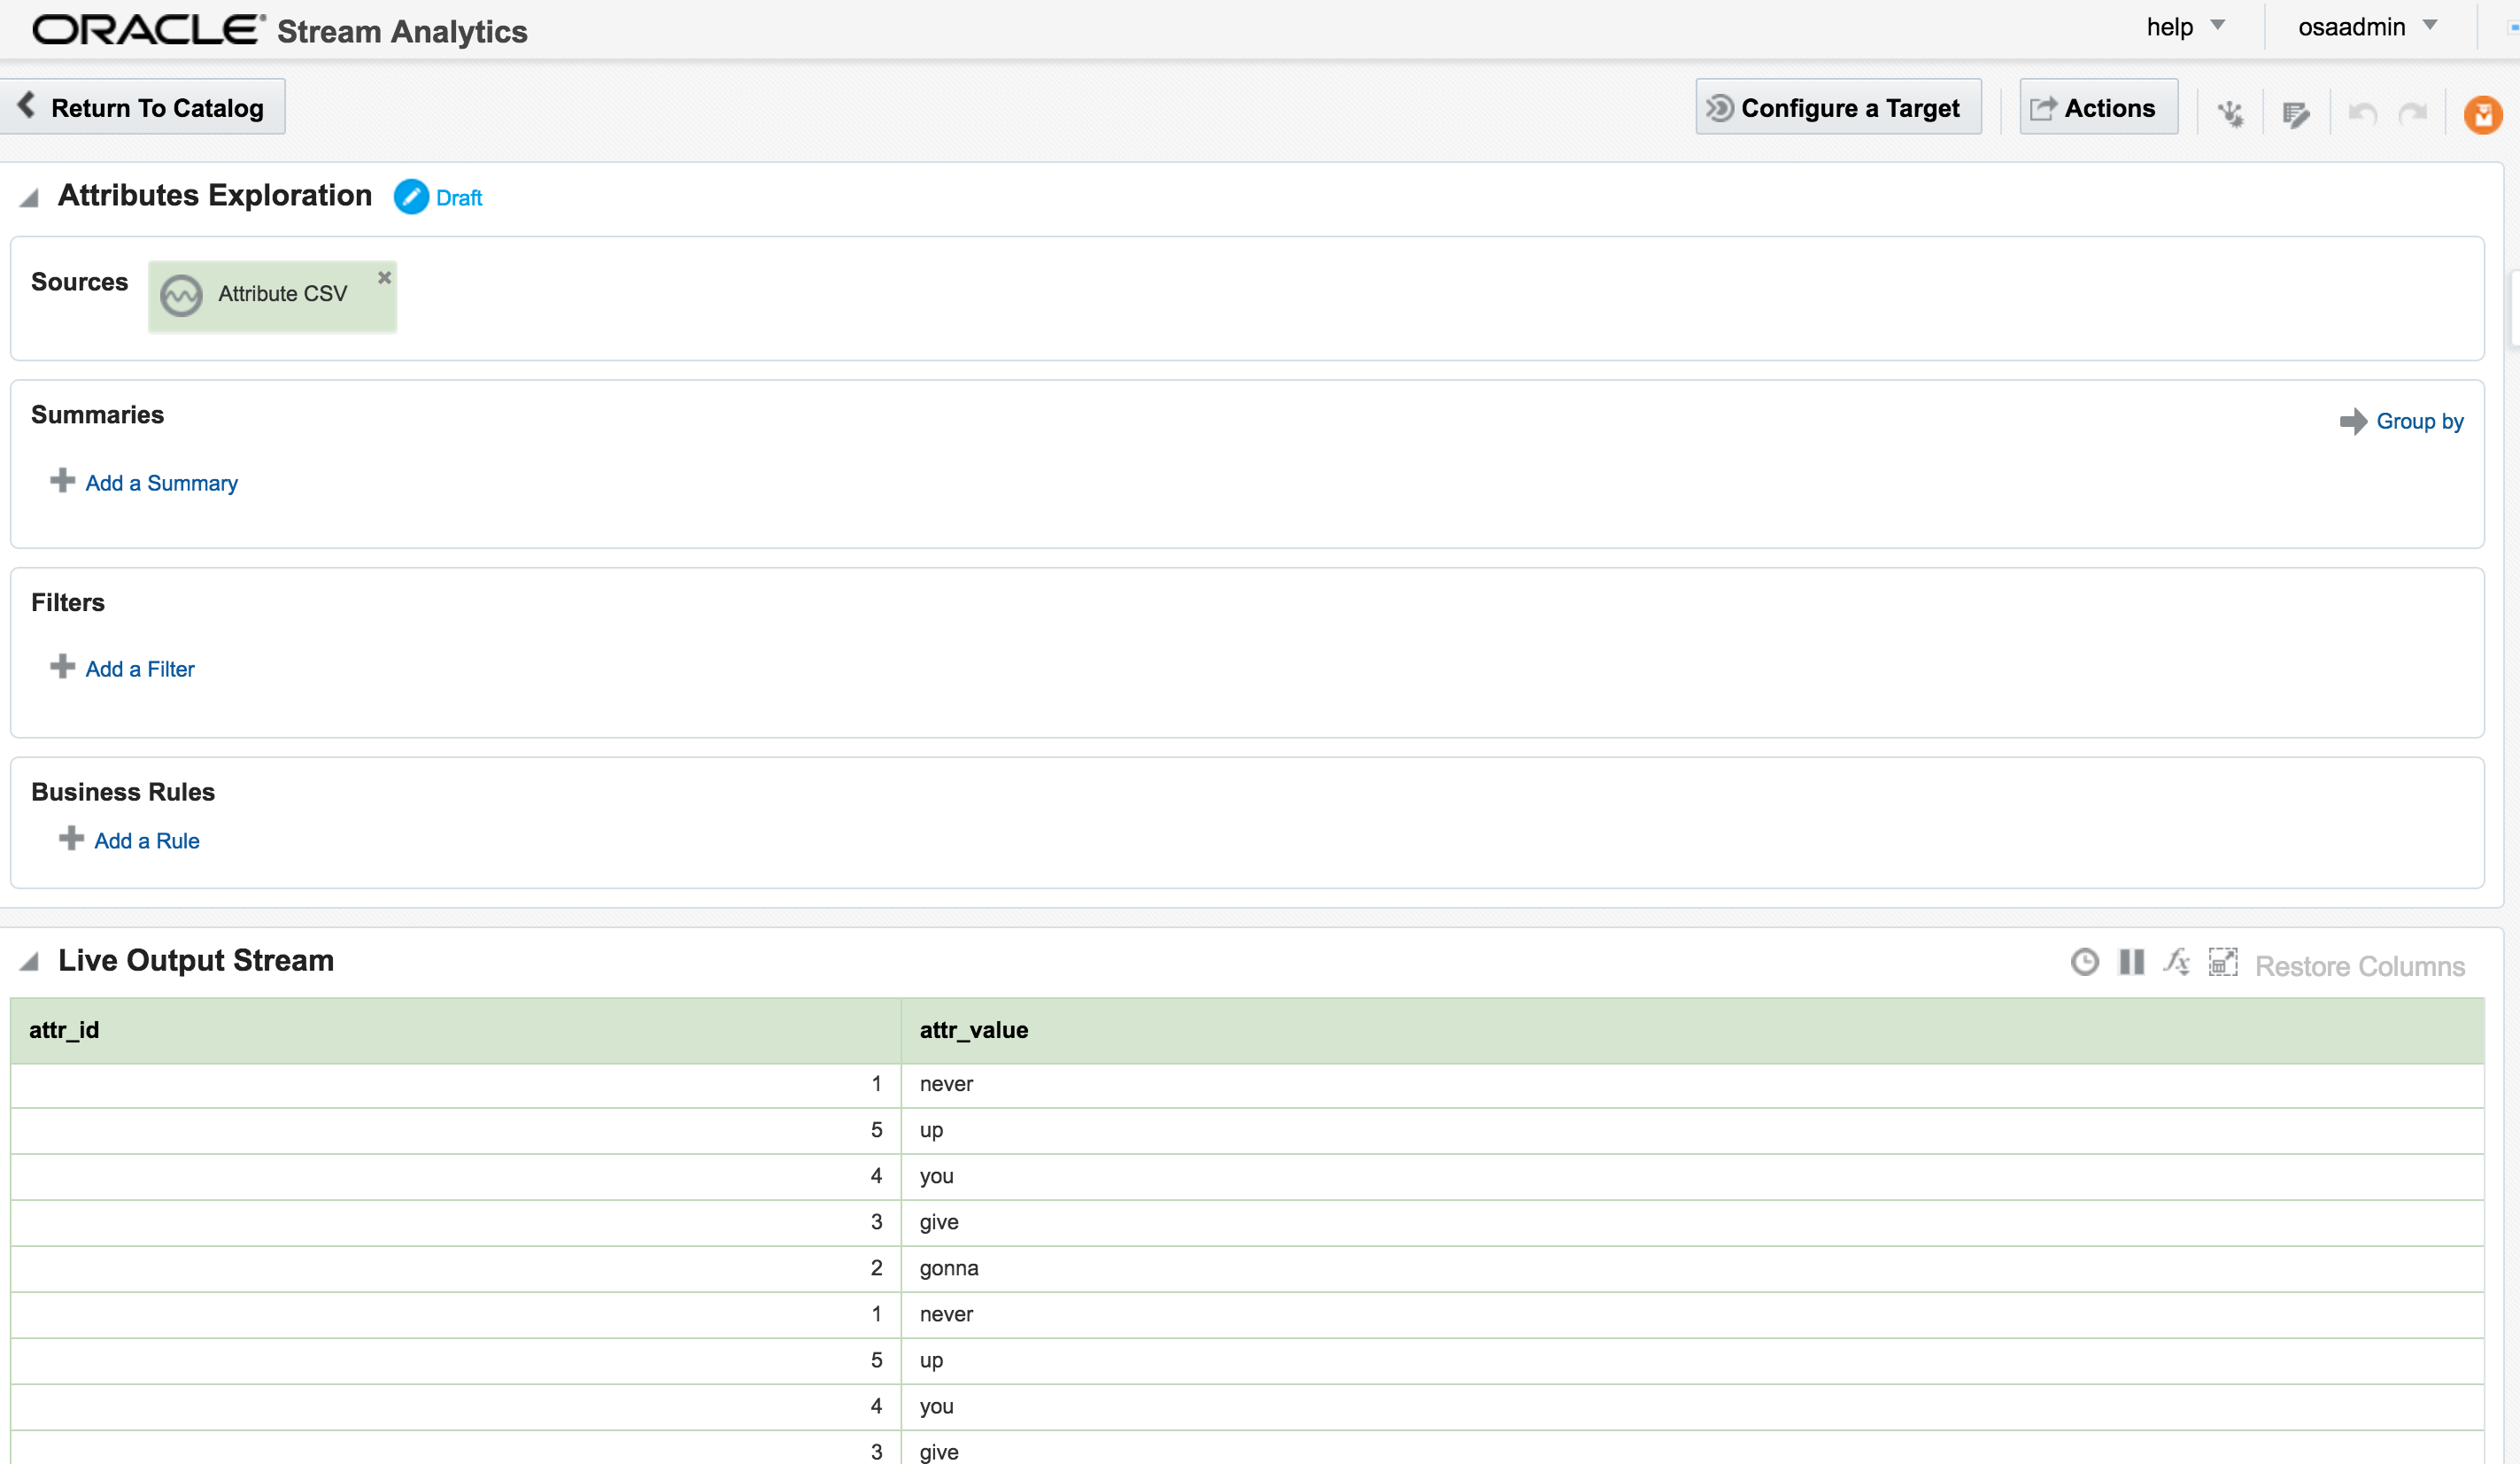
Assuming the Stream is created successfully you are then prompted to create an Exploration from where you can see the Stream in realtime:
I’ll leave this example here for now, but finish by using the Publish option from the Actions menu, which makes it available as a source for subsequent analyses.
Adding Lookup Data to Streams
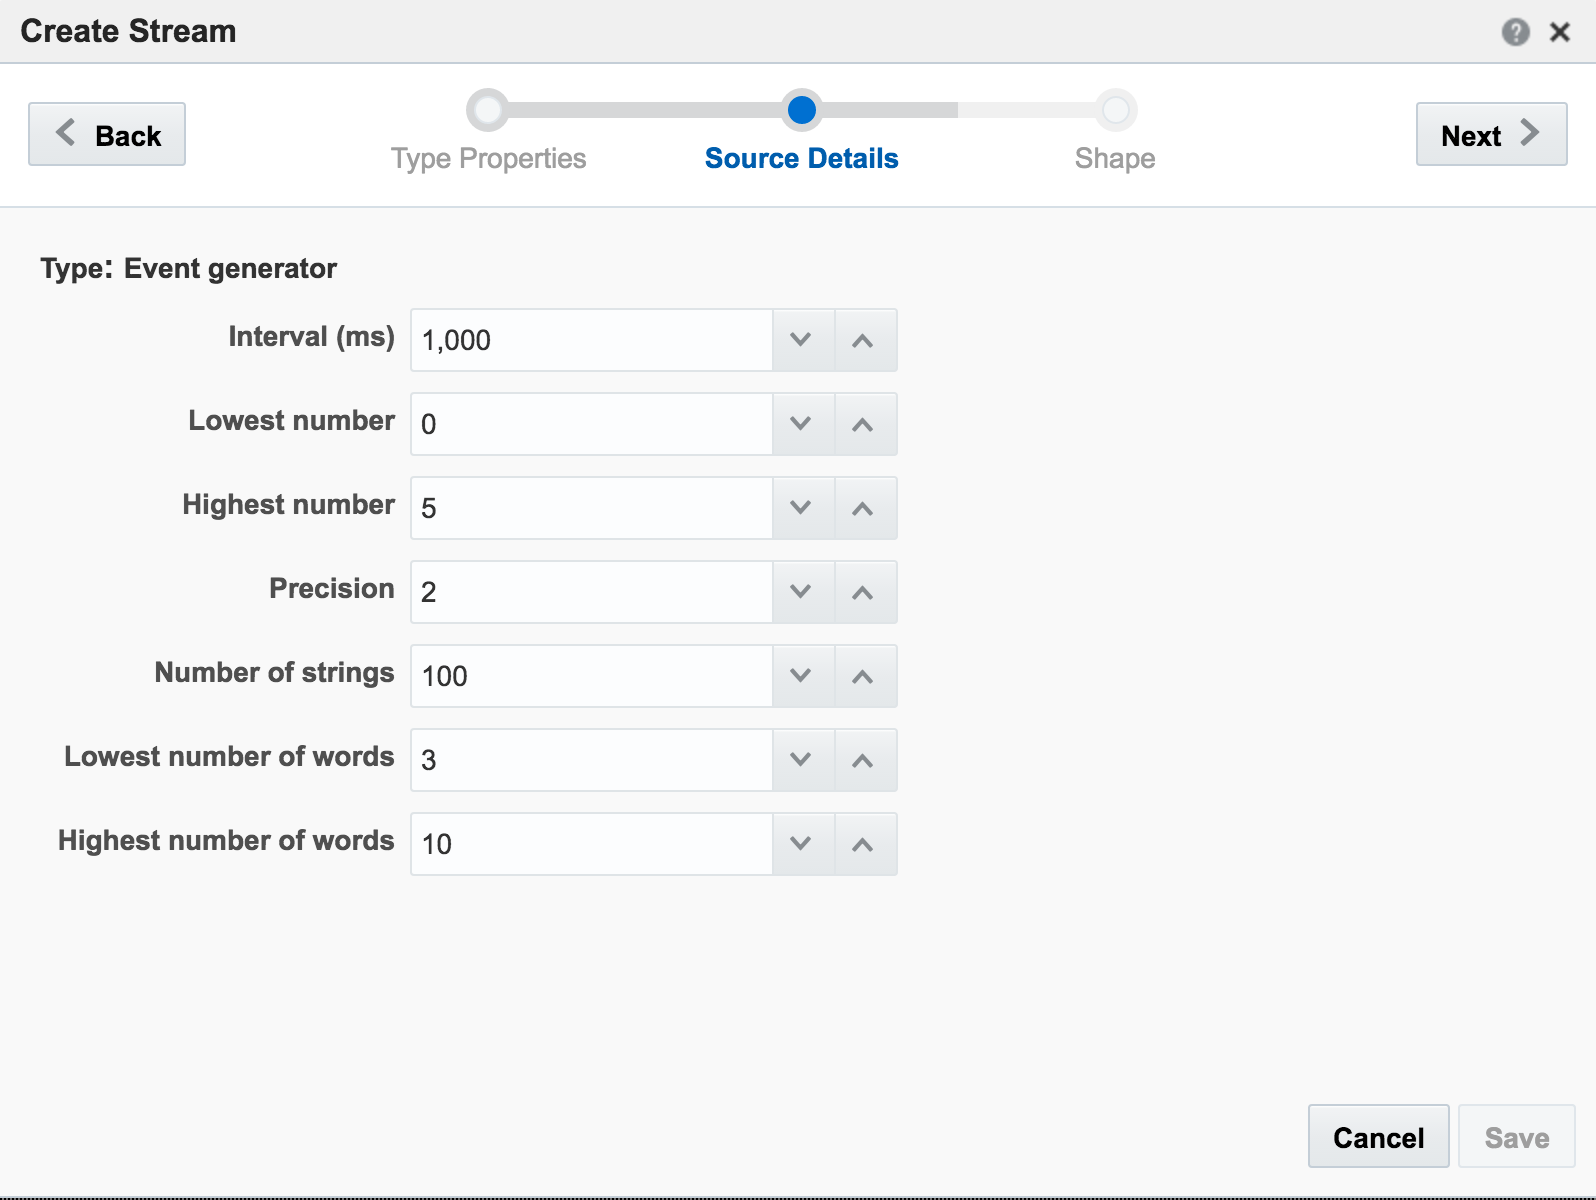
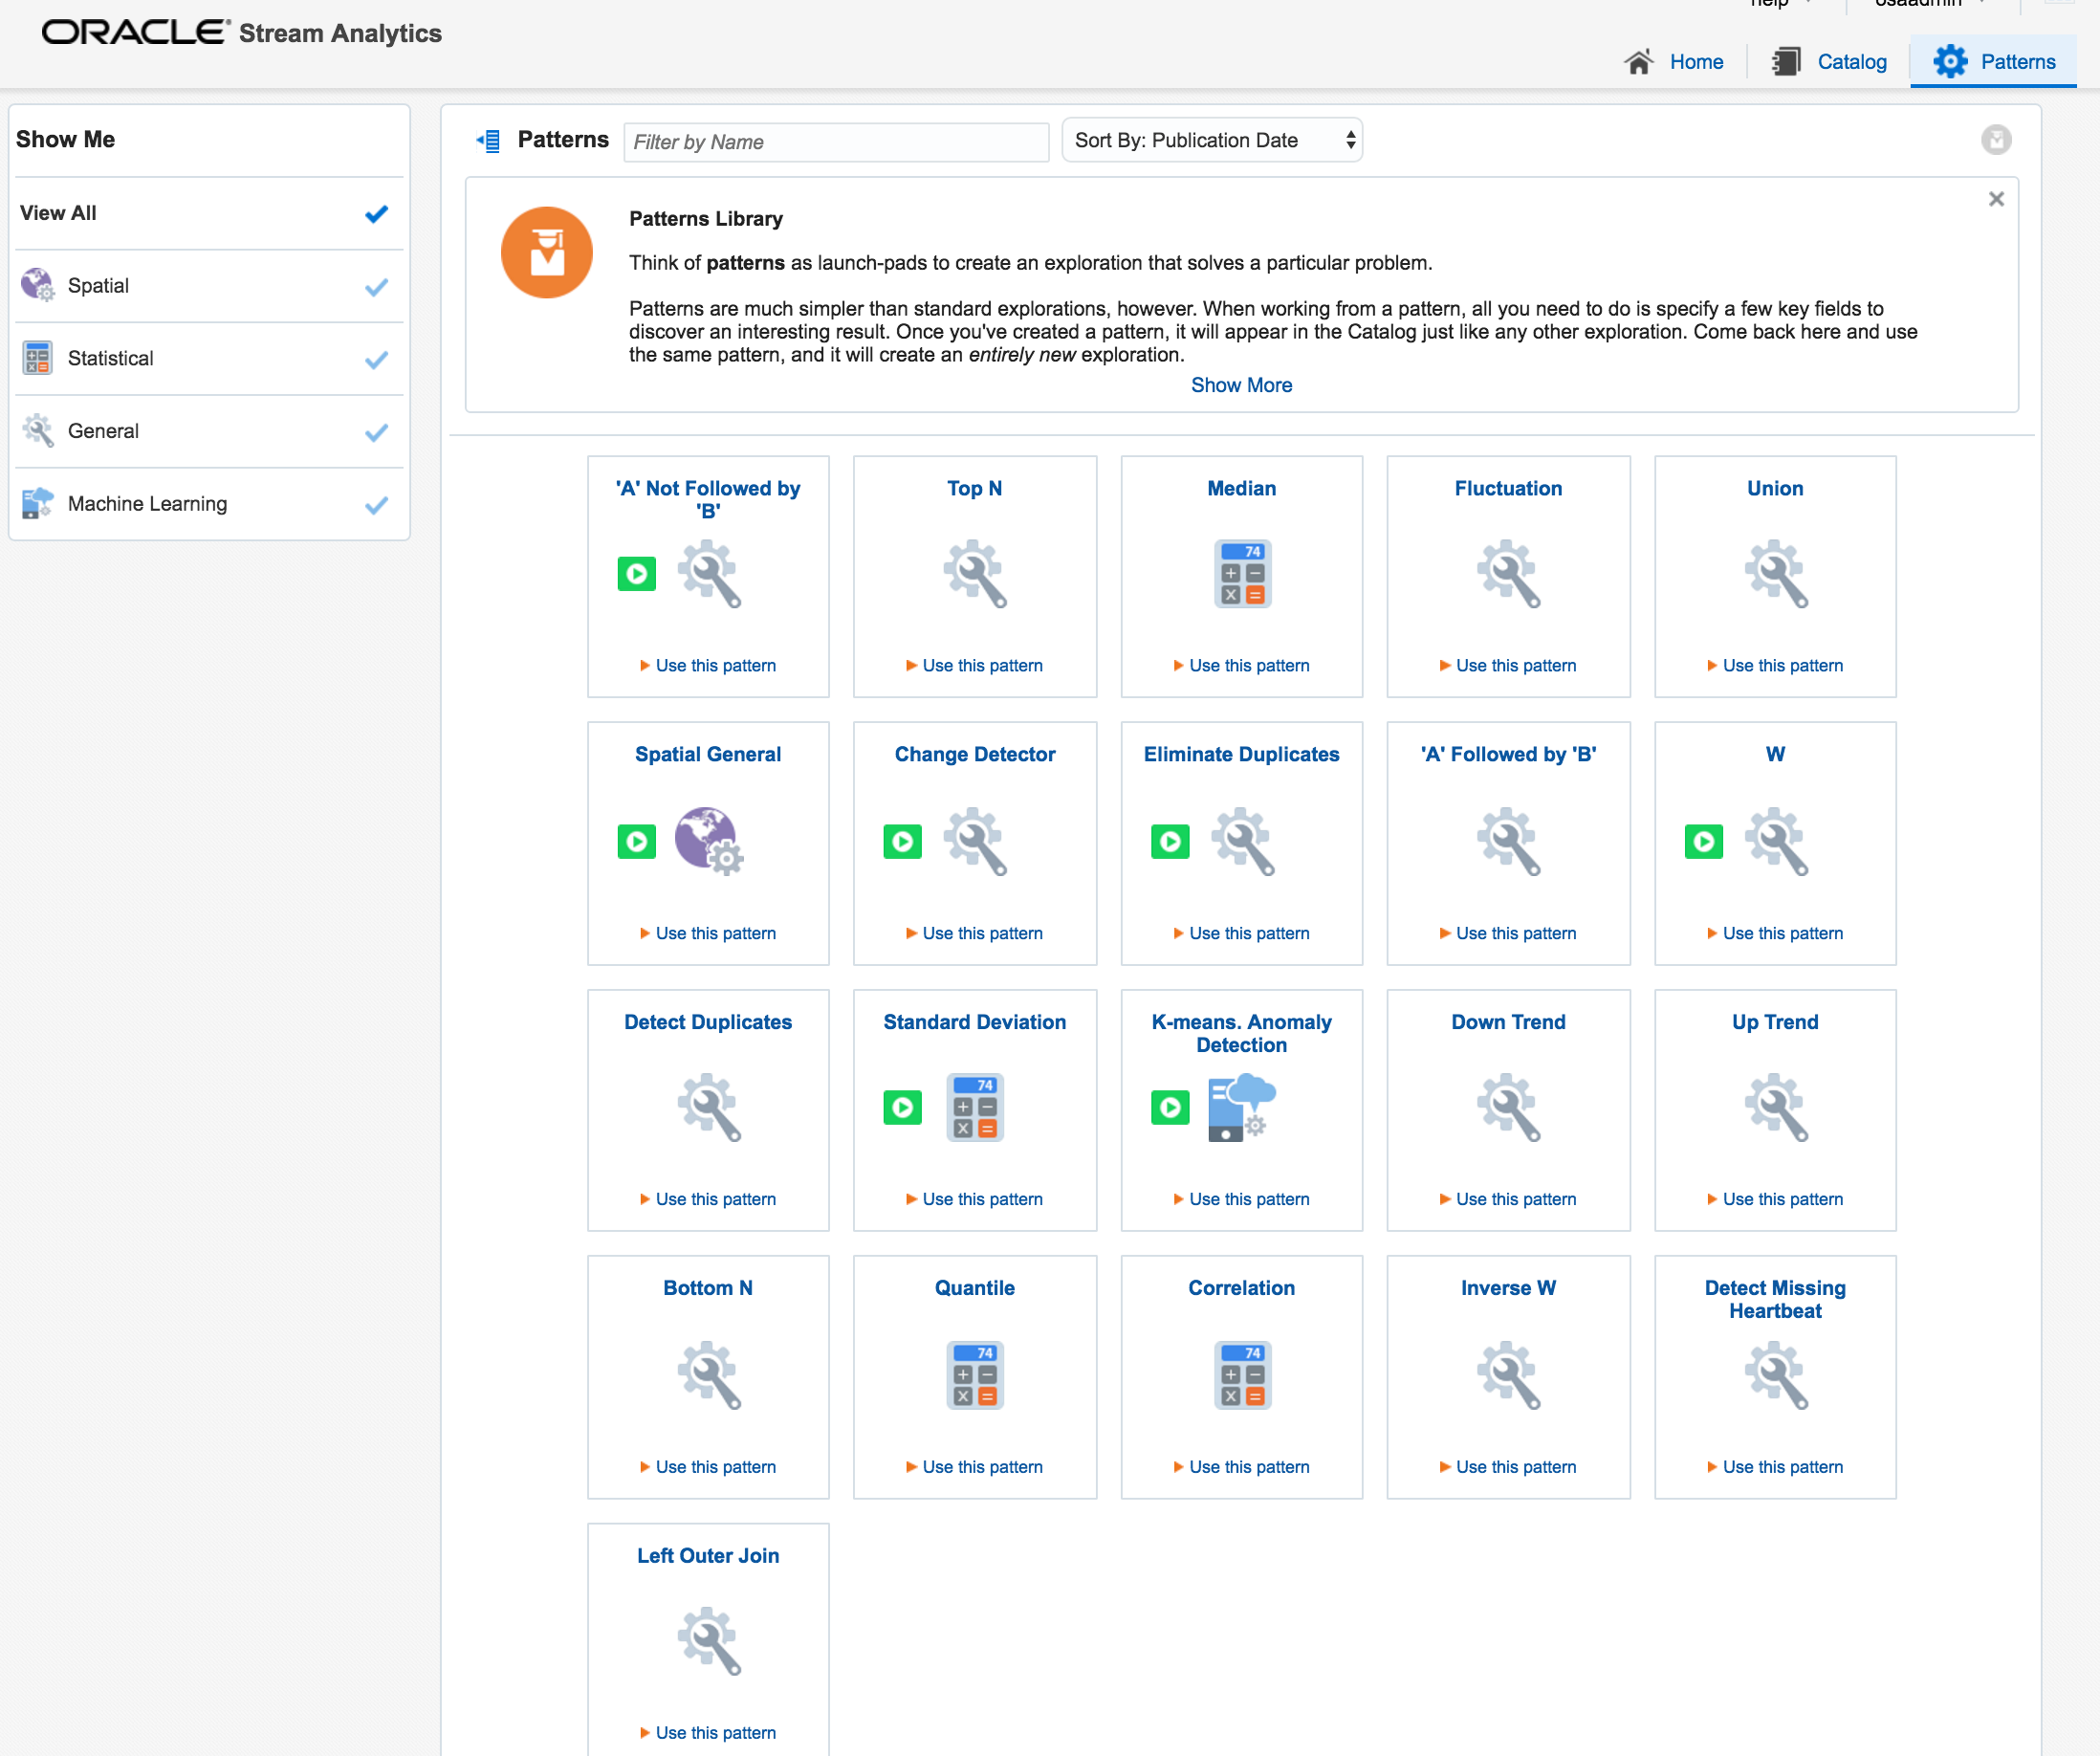
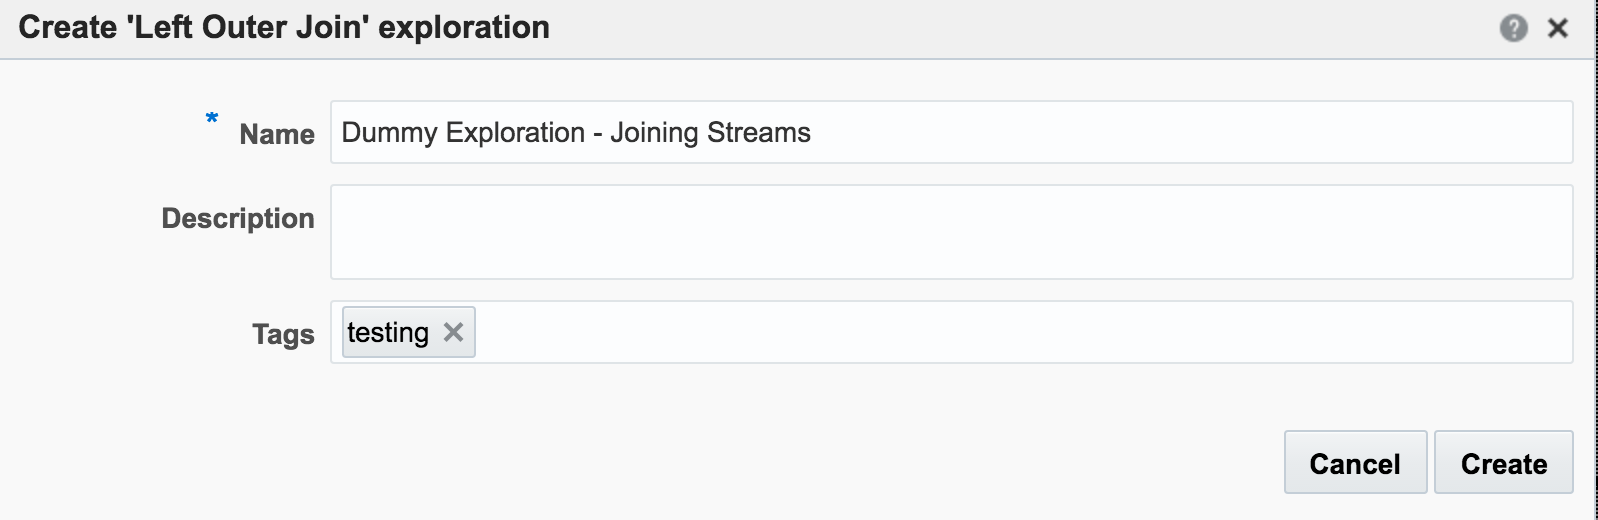
Let's look now at some more of the options available for transforming and 'wrangling' streaming data with OSA. Here I’m going to show how two streams can be joined together (but not crossed) based on a common field, and the resulting stream used as the input for a subsequent process. The data is simulated, using a CSV file (read by OSA on a loop) and OSA's Event Generator.
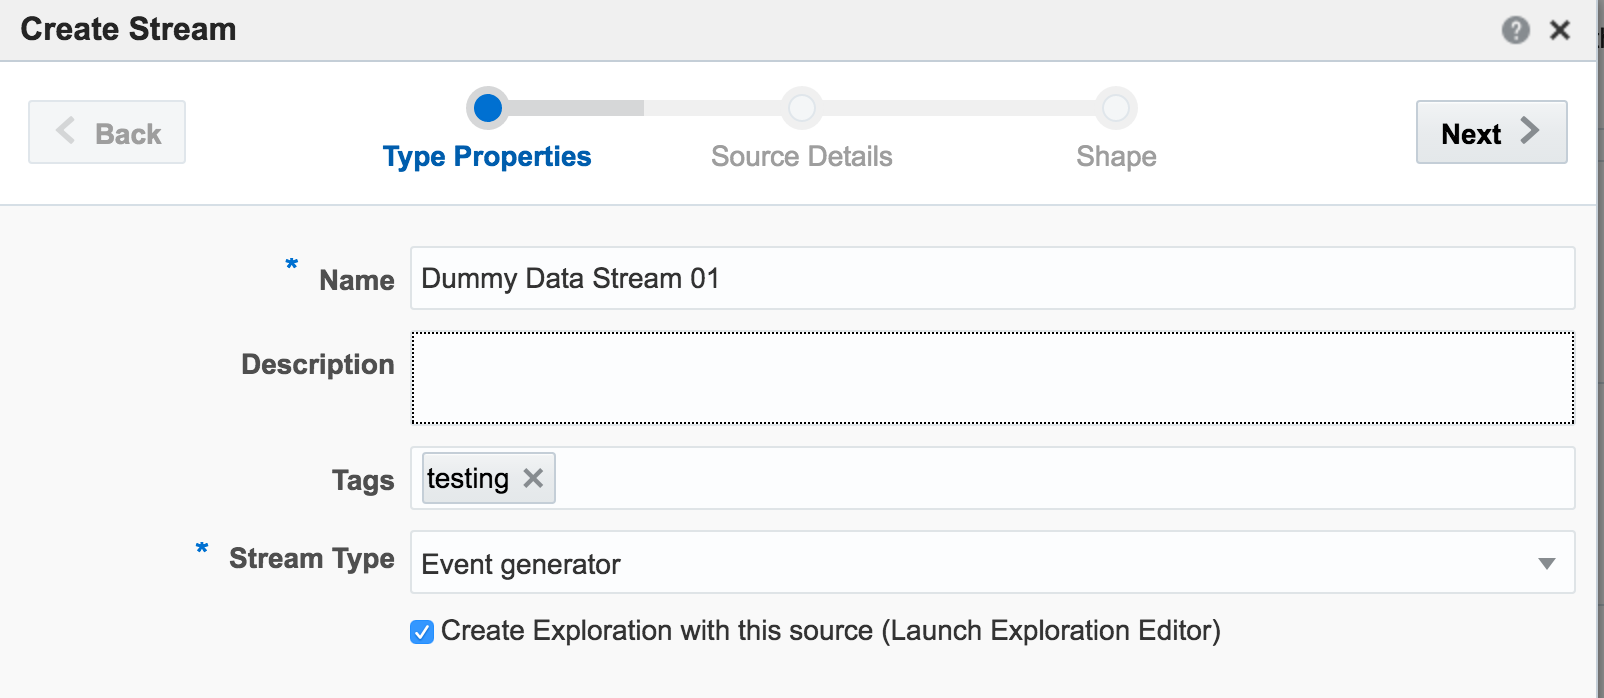
From the Catalog page I create a new Stream, using Event Generator as the Type:
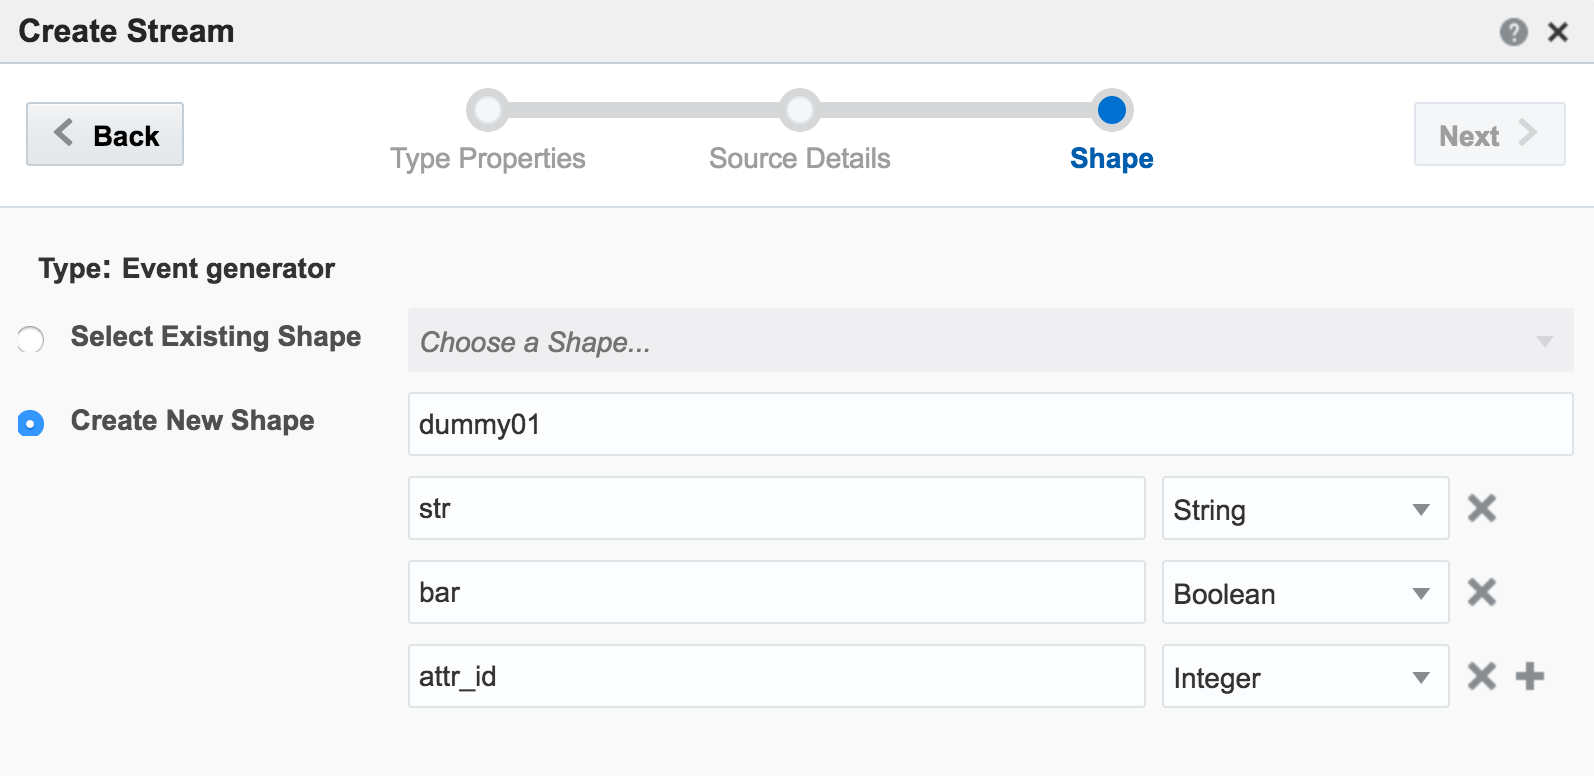
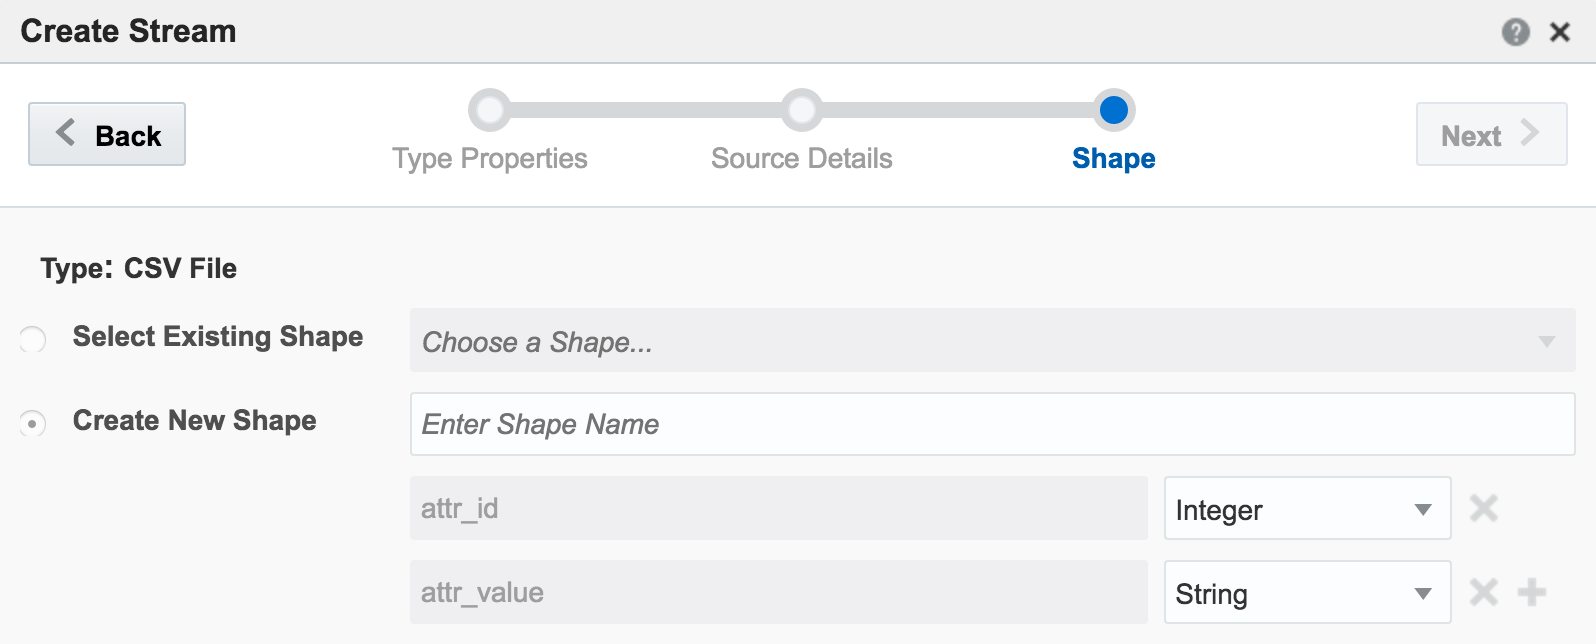
attr_id,attr_value
1,never
2,gonna
3,give
4,you
5,up
The stream type is CSV, and I can configure how often OSA reads from it, as well as telling OSA to loop back to the beginning when it's read to the end, thus simulating a proper stream. The ‘shape’ is picked up automatically from the file, based on the first row (headers) and then inferred data types:
attr_id would be matched. Unless both streams happen to be in sync on the same attr_id from the outset then this isn’t going to happen that often, and certainly wouldn’t in a real-life data stream.
So now we have the two joined streams:
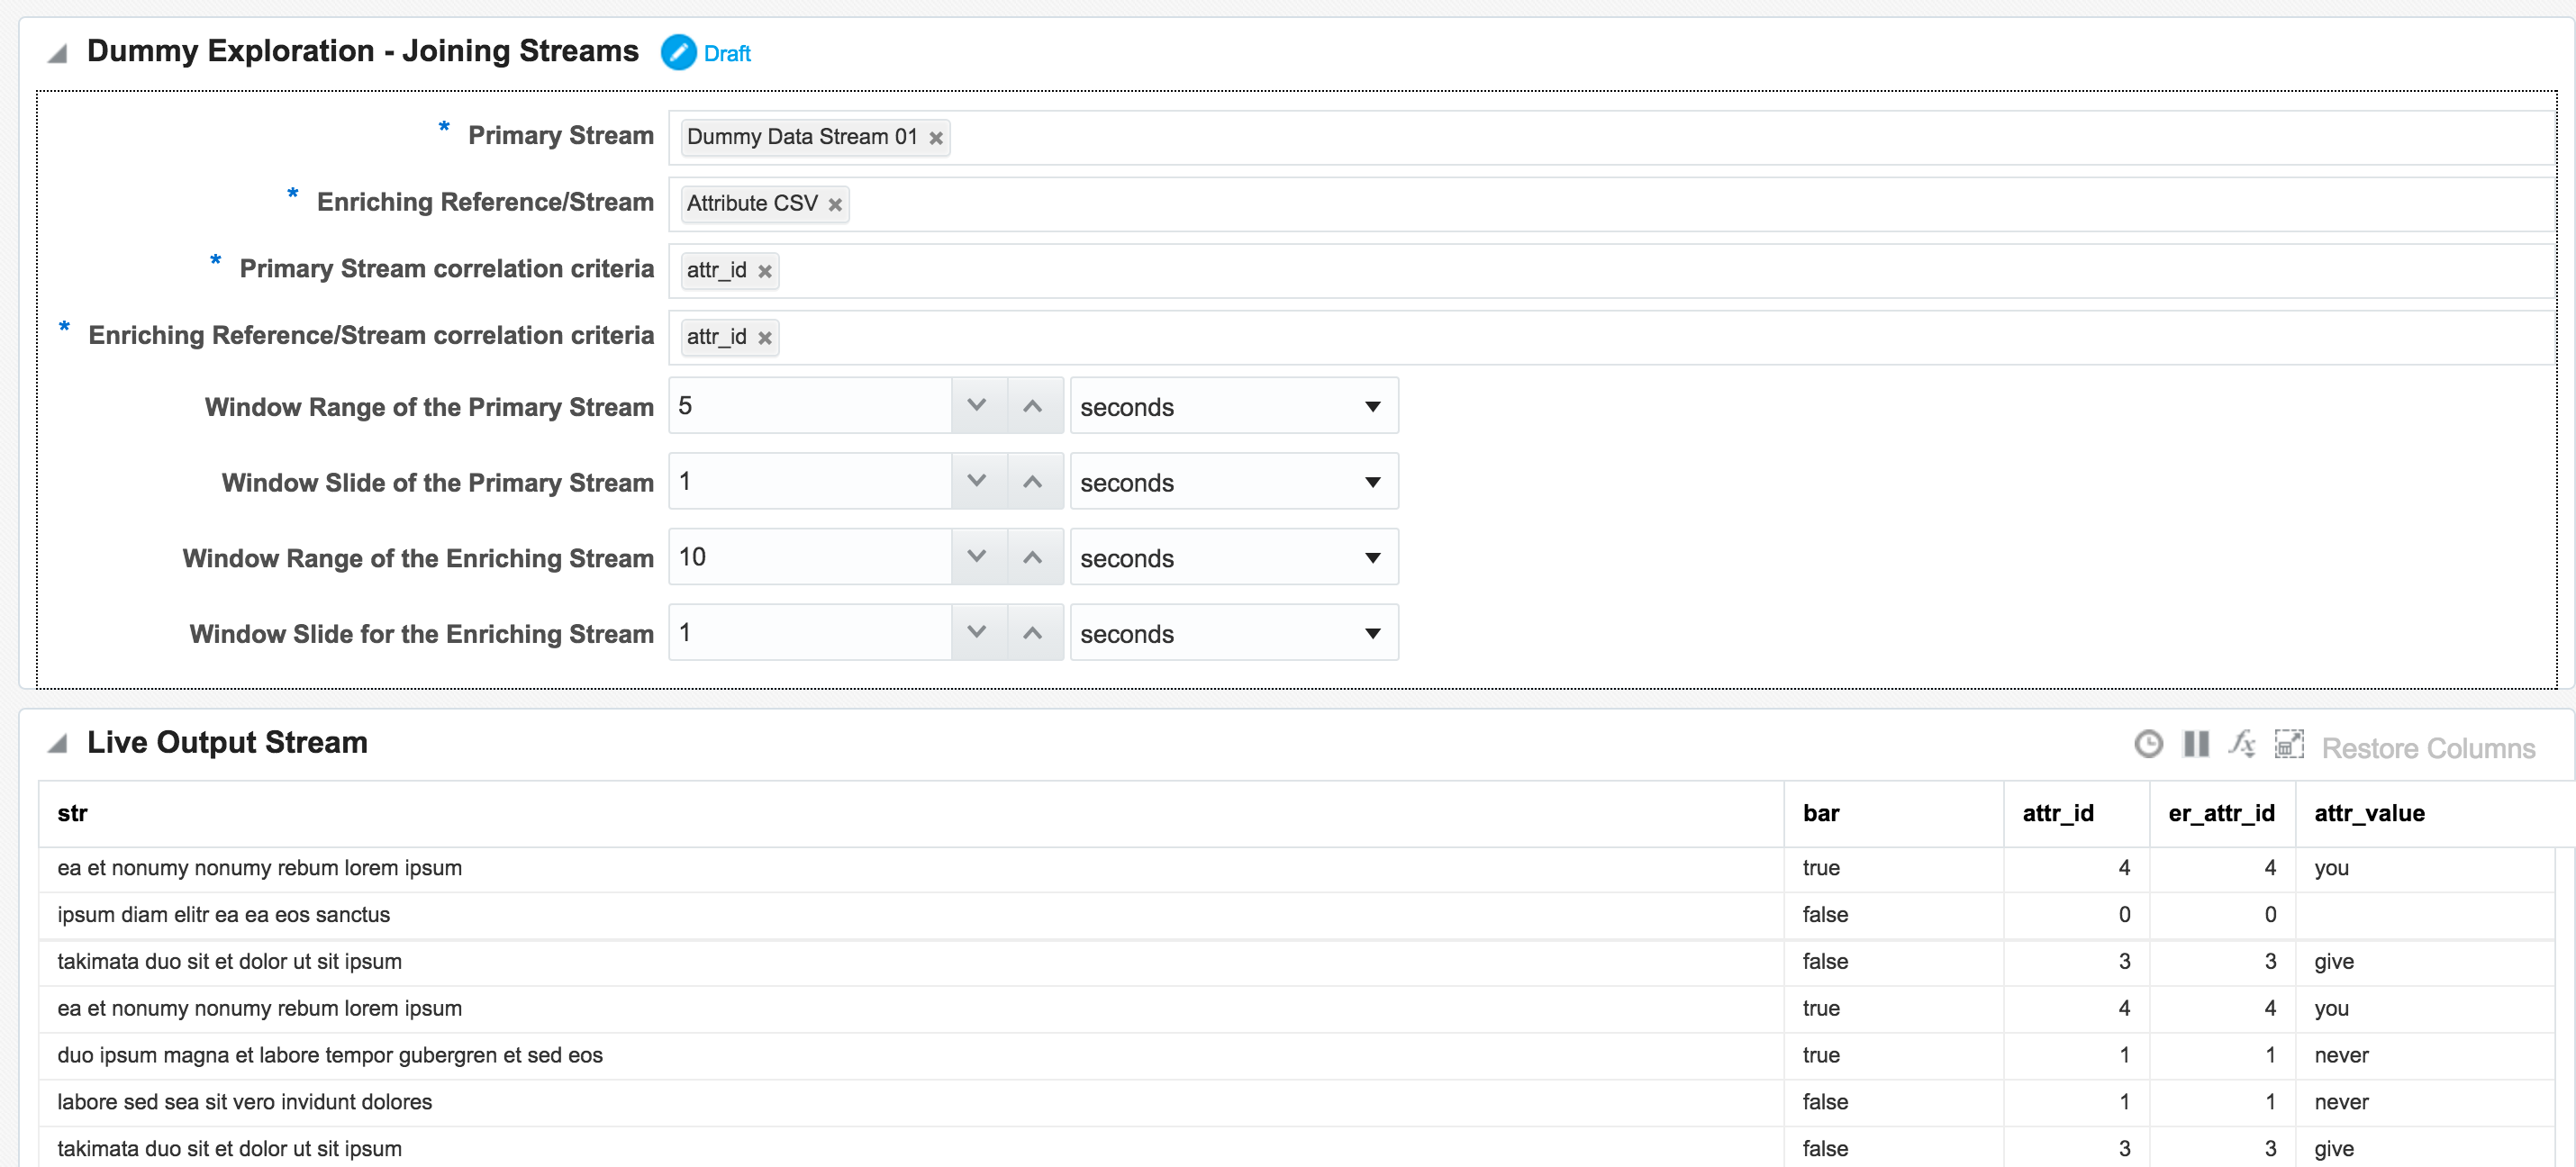
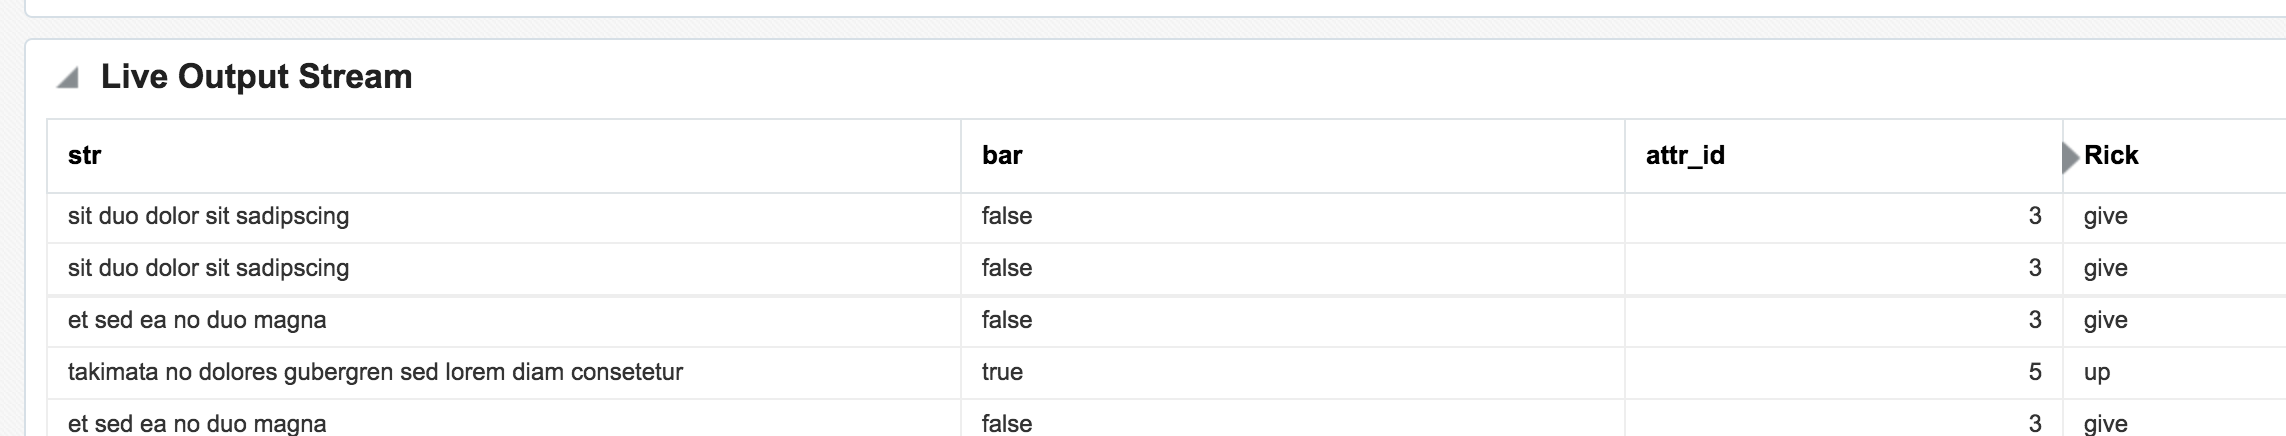
attr_id (duplicated since it appears in both streams), as well as renamed the attr_value:
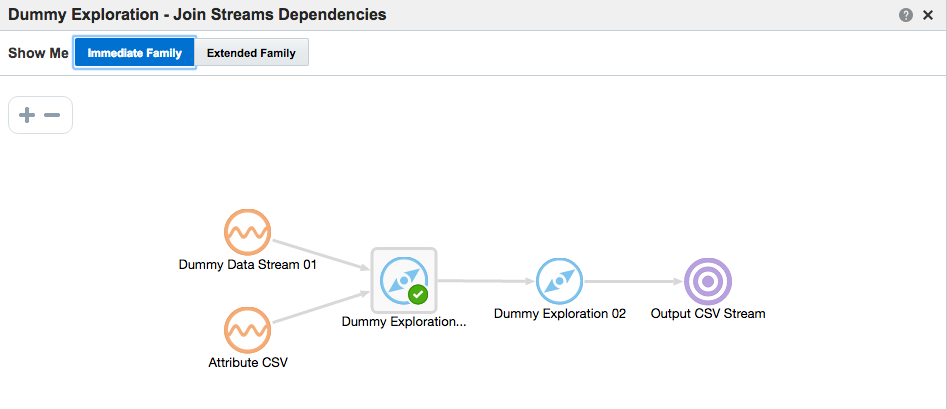
Daisy-Chaining, Targets, and Topology
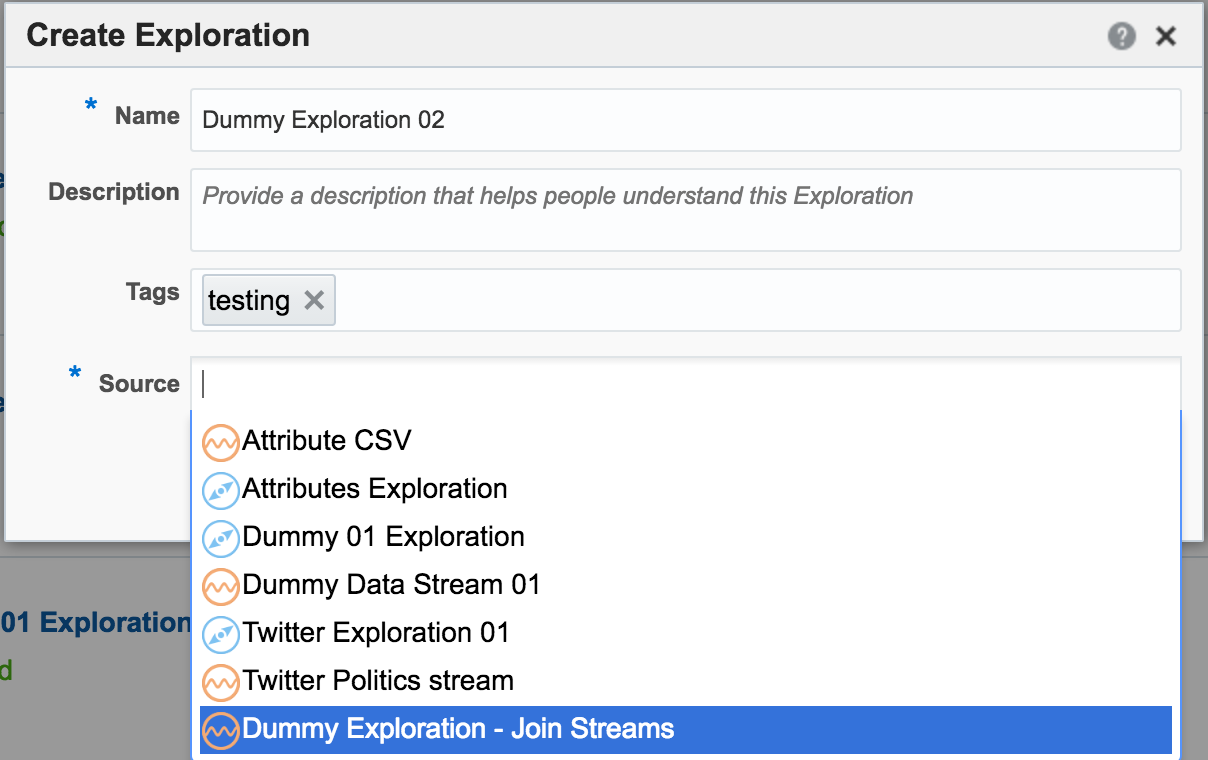
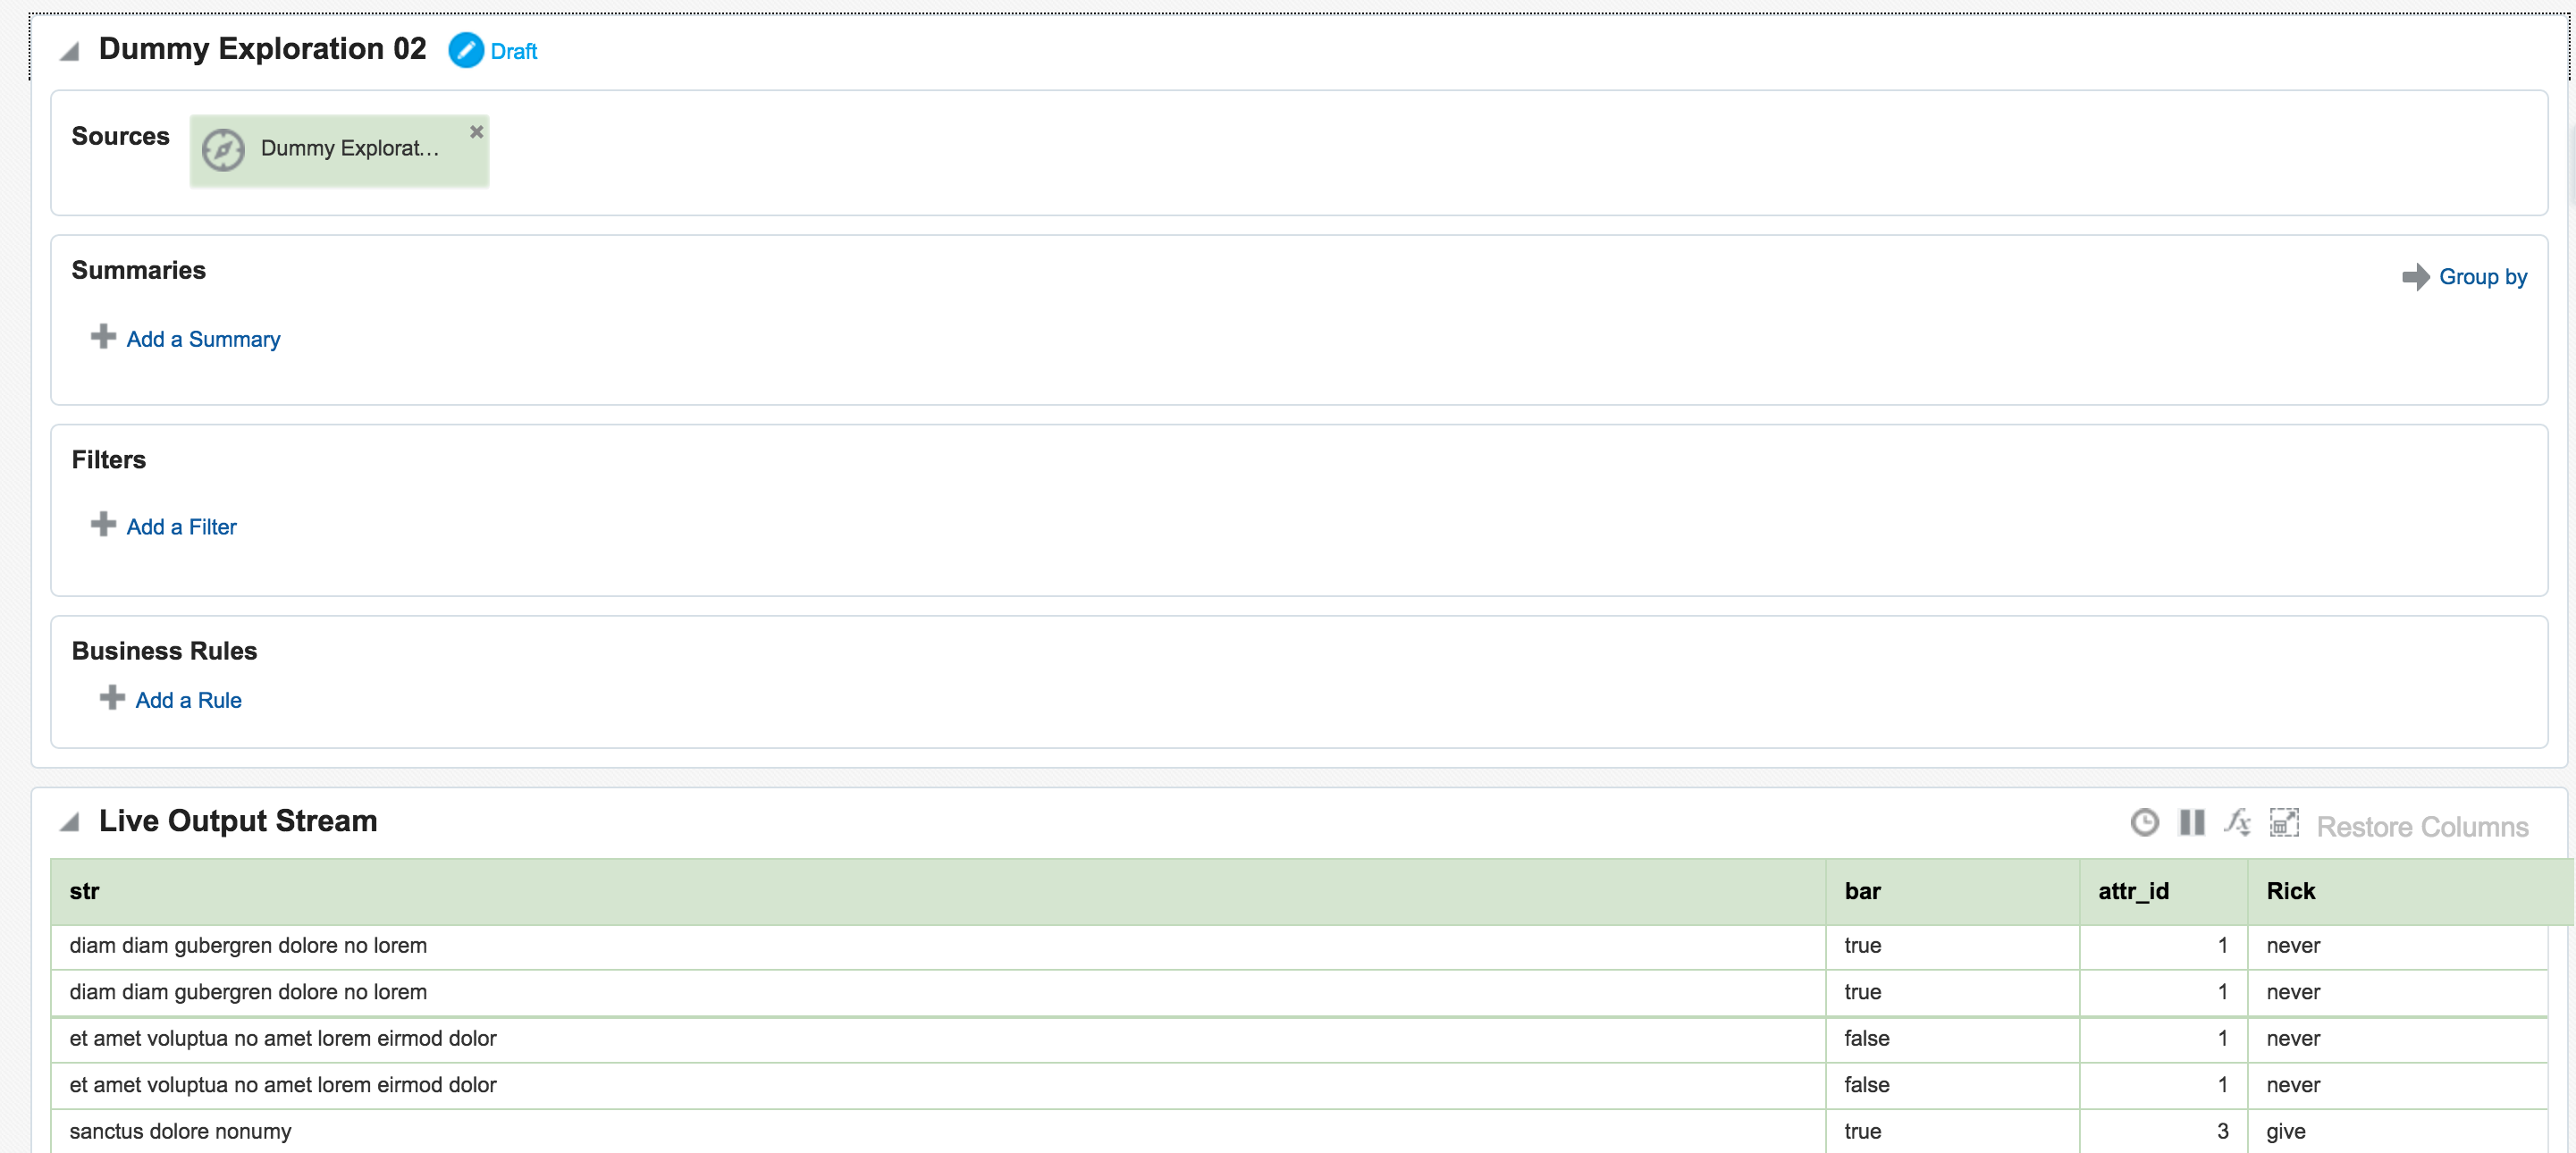
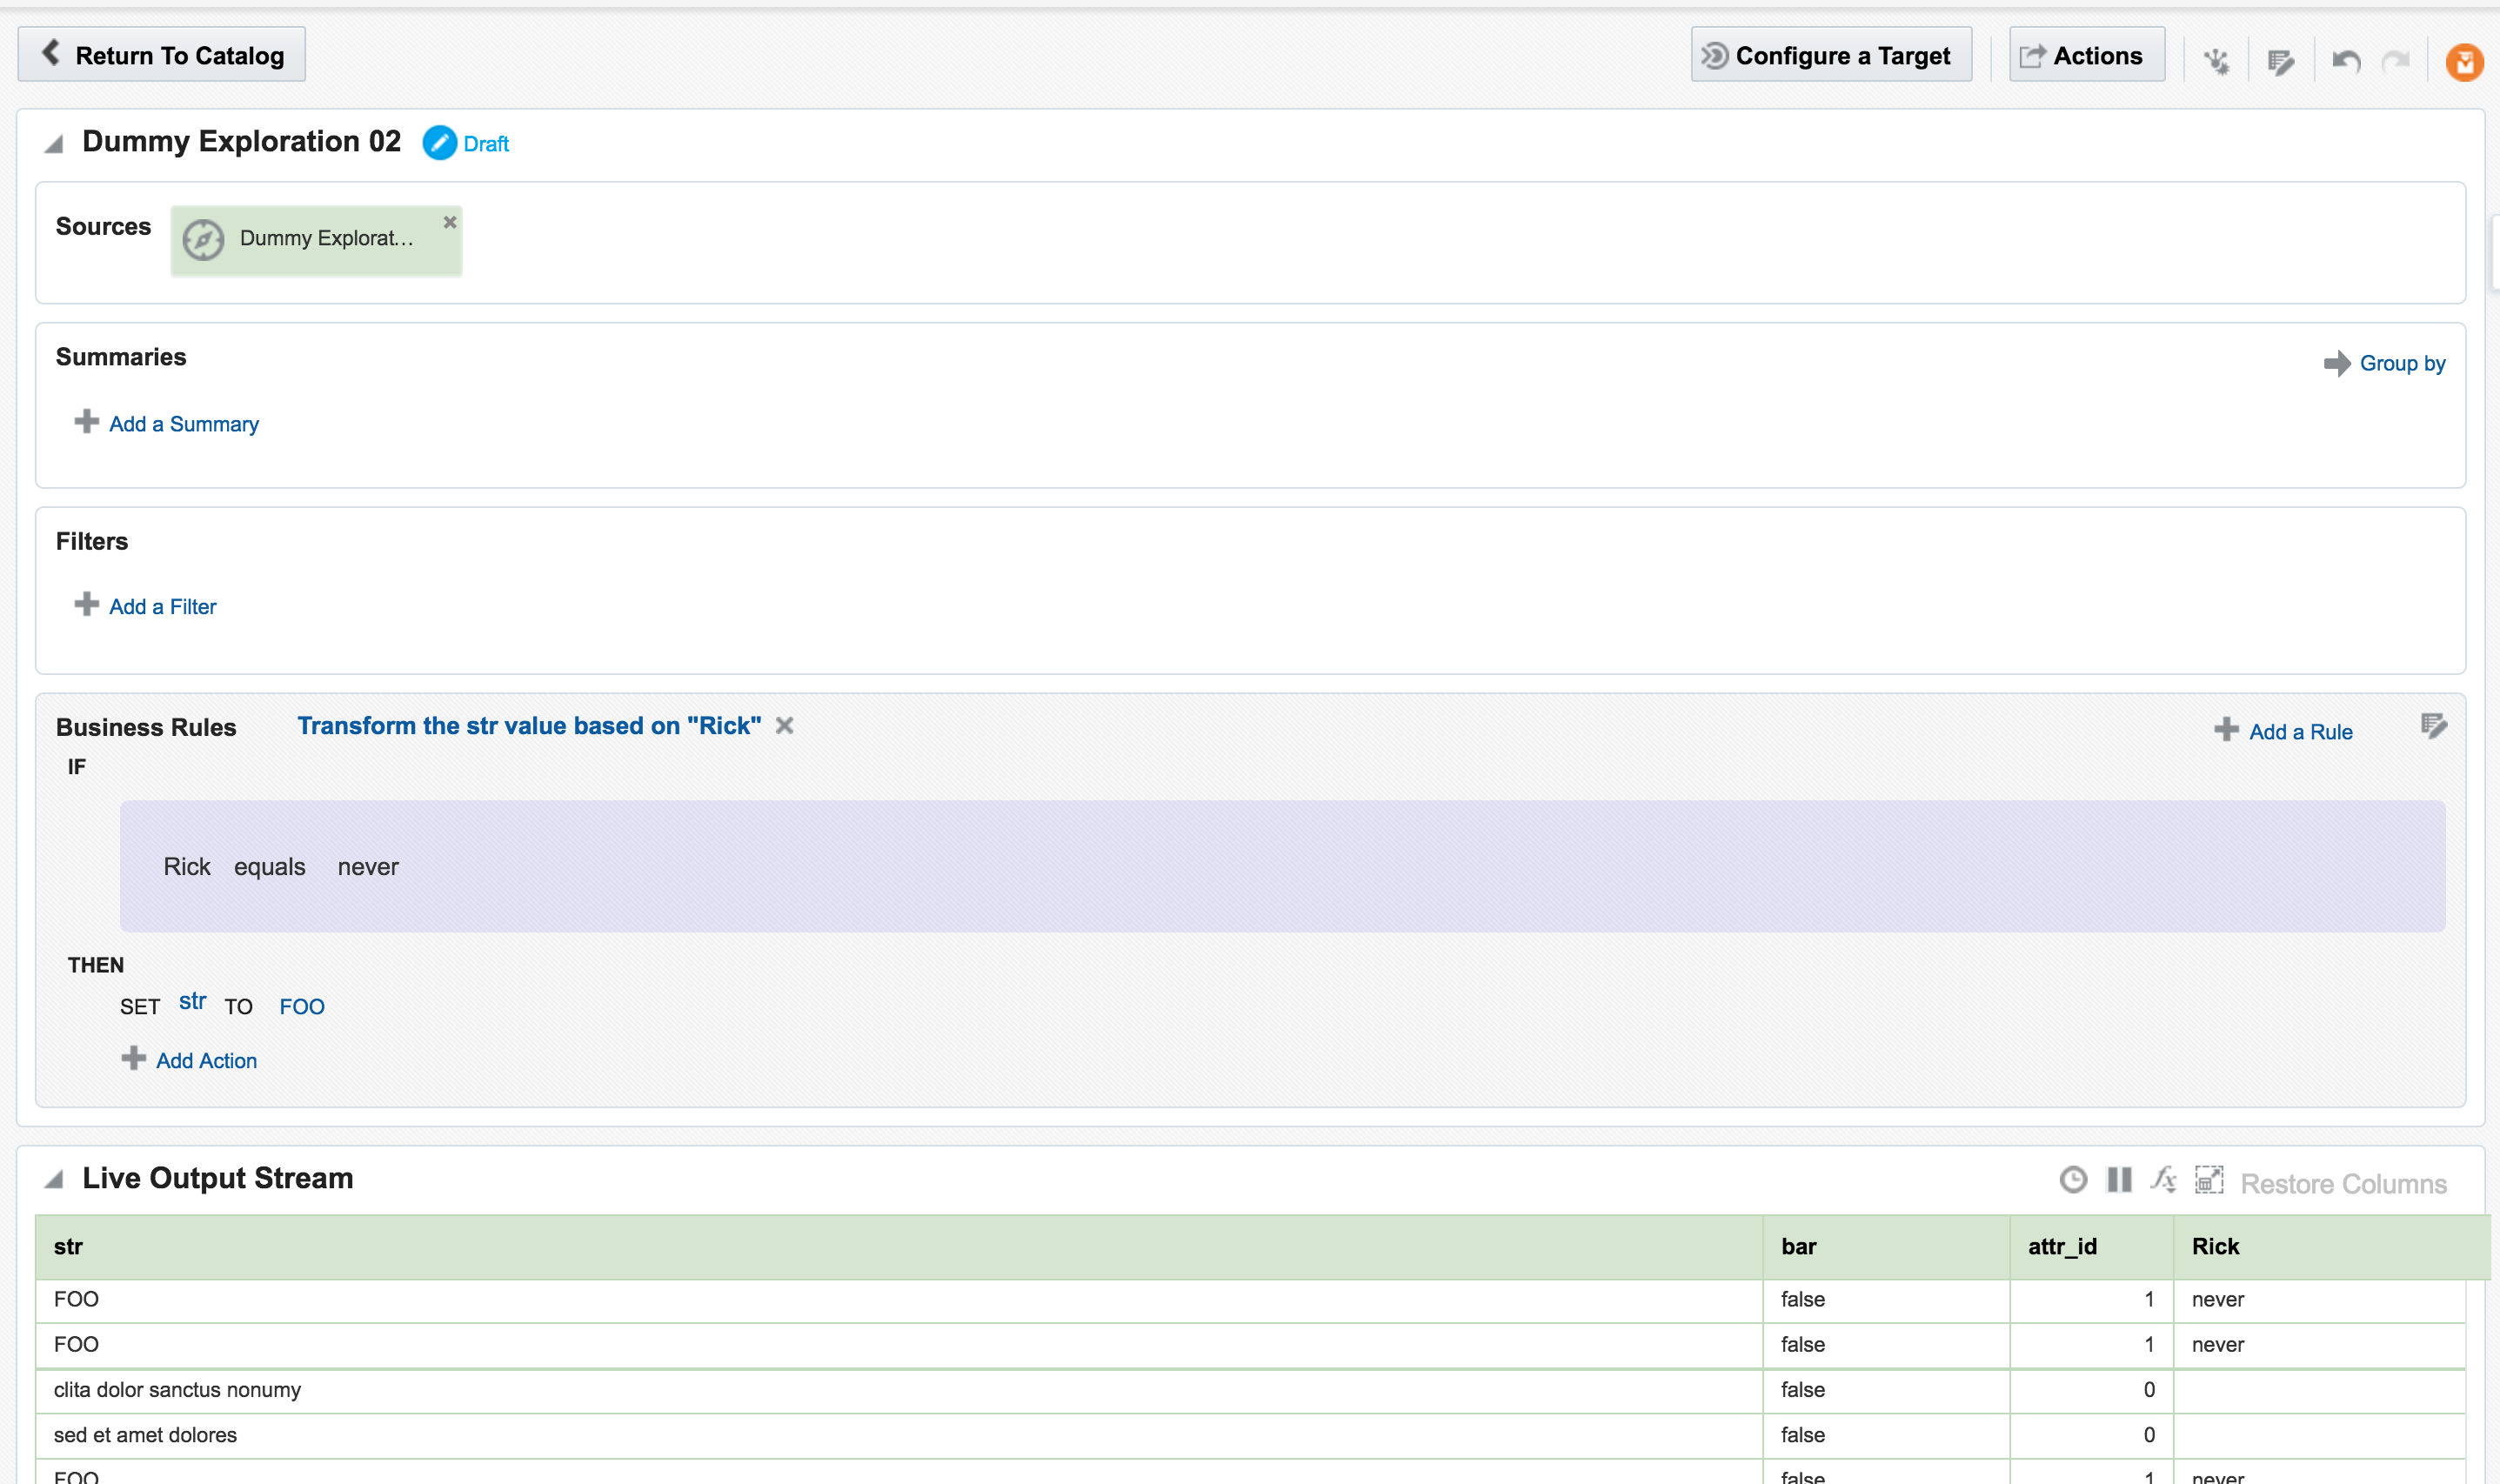
Once an Exploration is Published it can be used as the Source for subsequent Explorations, enabling you to map out a pipeline based on multiple source streams and transformations. Here we're taking the exploration created just above that joined the two streams together, and using the output as the source for a new Exploration:
In the next post I will look at how Oracle Stream Analytics can be used to analyse, enrich, and publish data to and from Kafka. Stay tuned!