Financial Reports - which tool to use? Part 1

One of the treats of working in the Business Intelligence world is that we are asked to analyze different aspects of a business. In fact, we are asked to analyze many different types of businesses, too. Most of us using BI tools have come from some previous background. Be it Marketing, Finance, Supply Chain or any other, we most likely had work experience before we got here. Maybe one of our jobs even led to Business Intelligence. The fact is, we are not experts in all areas. It would take several lives to make such a claim, because each area can be very complex and take years to master. The truth, for most of us, is that we have our favorite areas. They are often related to what we are most familiar with.

Over time, I came to really appreciate how simple numbers can be, and developed this - hard to understand - favoritism towards financial reports. While some business areas can be artistic and even vague, numbers are never vague. I have a great appreciation for that. Working with numbers is always precise. In the end, they have to match. No matter how great your report looks, if the numbers don’t add up the report is always wrong. Plus, financial layouts are generally very defined going in, so there is little room for error.
Financials in OBIEE##
So, the endeavor begins when you are a BI consultant and everything is supposed to add up properly and look very nice. OBIEE is an extremely powerful tool, and this gives users the impression that it can solve all problems. While it can solve most problems, it falls short on some key features needed for easy financial reporting. That is not to say that Financials can’t be handled in OBIEE - but it is definitely to say that it is not easy.
So, if financial reports are not easy to create in OBIEE, than we are left with two very simple options:
-
Struggle through it and make it happen
-
Choose another tool
I have made the mistake of choosing option 1 some times, but quickly realized that option 2 couldn’t be as bad. Countless times, I have been asked to create financial reports in OBIEE. Of course, they needed to tie up and match a specific format: they needed to have blank lines inserted between one section and another, and the alignment of the categories was very important. They often required very detailed variance calculations, so that a company could see where they stood as far as change overtime. Variance percentages are key on these types of reports, and if you have dealt with them in OBIEE, you know that different types of variances and their grand totals can often pose challenges for report writers.
So, in order to accomplish the formatting needed, you end up adding extra code here and there, in essence trying to make OBIEE do something that it’s not supposed to do. Soon, you are experiencing performance issues and a new array of considerations are in place. You start removing your “special code”, then you loose your formatting. The numbers on your financial statement are still correct, but your report looks something like this:

While, in reality, you were trying to get here:
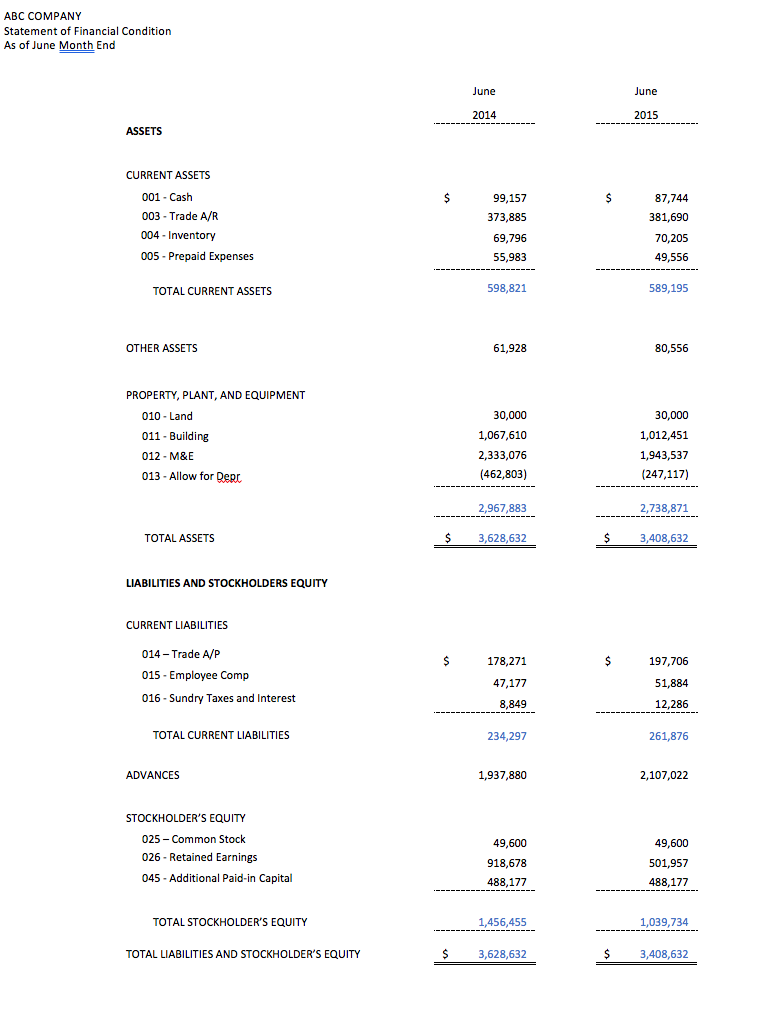
** The Balance Sheet above was created using HFR for illustration of formatting only.
Looking at a different OBIEE financial report (below), you will see that a lot of formatting can be done in these reports, but unless you spend a huge amount of time on it, they will always look like OBIEE reports, if you know what I mean.
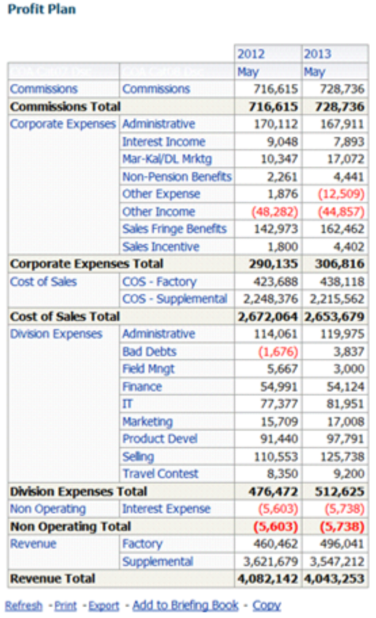
In this example, the first column is out of order - as far as Income Statements go. This was left alone on purpose to display one of the issues with creating these statements in OBIEE. The tool does not easily allow you to choose which items will go in each row. So, in the criteria tab, in Answers, you choose the order of the columns, but if you need the rows in order, you will need to either:
-
Use a hidden column created just for sorting purposes
-
Leverage selection steps, or
-
Create a measure column for each row that you will need, use a pivot table, and add the Measure Labels as rows on your pivot
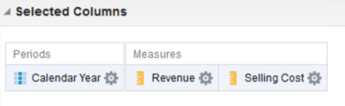
I will illustrate the third option, as it is my preferred way of ordering rows. Suppose that you have a very simple criteria tab such as this:
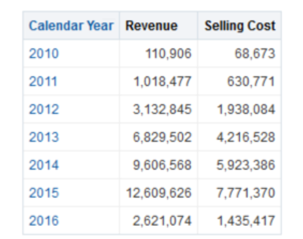
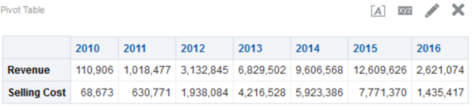
Naturally, your results would default like this on a table:
If you use a Pivot table instead, you can drag your Measure Labels onto the Rows:
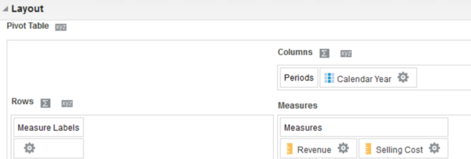
And now, you will be able to see your measures as rows. You can easily reorder them as needed by just moving the order of the columns in the Measures section of your Layout editor.
This seems like a simple solution if you know precisely what all your rows should be, and even better, if you don’t have a huge amount of measures on the report. In real life, this type of row ordering is high maintenance:
-
You must label each measure to match the account category name for each row
-
You must filter each measure by its account category (or account number)
-
If the account category name changes in your DB, you must manually rename your columns to match the new naming convention
-
If you add or delete account categories, you must manually add and delete columns from your report
OBIEE 12c offers a great improvement in this area: the ability to “save columns” is described very well by Jason Baer on this blog:
GHOST_URL/2016/01/my-favorite-obiee-12c-feature-that-almost-no-one-is-talking-about/
With the new release of the product you can save as many financial columns as you would like in the web catalog, which allows you to reuse them. As a consequence, you will streamline report maintenance by updating the columns’ format and formula directly from the catalog (instead of inside every report). In fact, if you are spending too much time maintaining your existing reports out of OBIEE 11g, you will automatically benefit from an upgrade to 12c just based on this single feature. Check here for more info: https://www.rittmanmead.com/obiee-12c-upgrade/
This is a great improvement, but you will still need to deal with an overall lack of flexibility for dynamically adding and deleting columns, setting orders, adding blank space, indenting and calculating variances along with proper grand totals.
After spending more time than you should in order to create a simple report, you really start considering other tools. If you are already working in the Oracle stack, the obvious choices will be BI Publisher and Hyperion Financial Reporting (HFR).
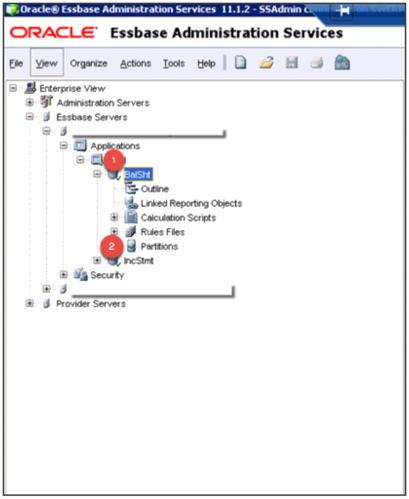
Financials in Essbase/HFR##
Hyperion Financial Reporting (HFR) brings a powerful solution to financial statements, because it allows you to create pixel perfect reports that are pre-aggregated in an Essbase cube. Just with that, two big problems were just solved: formatting and performance.
In the example below, you see that HFR allows you to place metrics on both sides of the Account Category (butterfly layout - difficult to accomplish in OBIEE):
In addition to formatting and performance, there are some definite pros to consider when choosing HFR:
-
The calculations in HFR dynamically reference cells, as in excel. So, if a cell changes, the cells that are referencing the original cell will automatically be updated
-
HFR has the ability to create financial books and batches, and also has a powerful bursting feature
HFR is a great solution for Income Statements, Balance Sheets and other reports that come from Essbase cubes. In a simplistic way, an Essbase cube is a combination of tables that have been joined and pre-aggregated. Since most tables coming out of a financial module in a system can often be joined, you should be able to create Essbase cubes to use as a source for your HFR reports. You will rarely have a requirement that cannot be handled by HFR and Essbase, but some situations may be problematic, for example, if your report requires a measure to be entered at run-time, if results from multiple cubes need to be added, or if your layout is very complex. This is why :
In an HFR report, you start by inserting a grid onto your report and then you associate that grid with a specific Essbase cube. If you need data from two cubes on the report, you can insert another grid and associate that with the second cube. You can also create a report that leverages calculations between existing grids (for the purpose of doing math with two or more separate cubes):
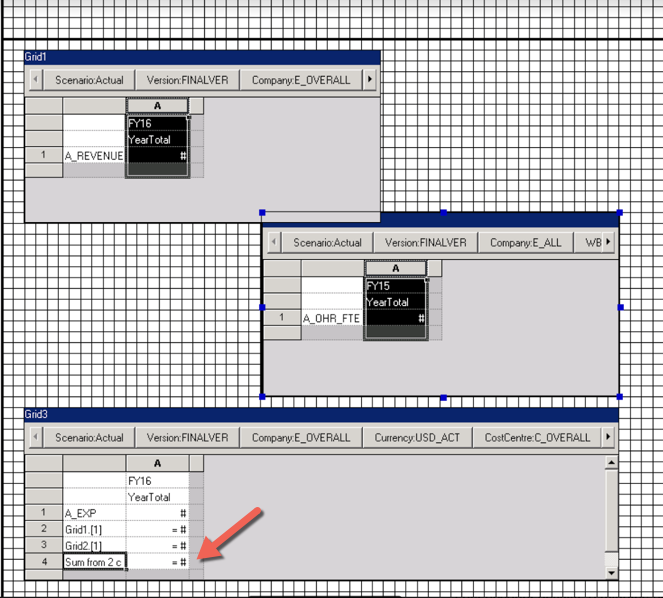
Many thanks to my collegue, Mark Cann GHOST_URL/author/mark-cann/, for working through this solution with me
The challenge here is that you may end up with multiple layout grids on your HFR report, which will complicate the report creation and maintenance going forward. It is important to know that if your requirements call for strange off-setting of cells and multiple different looking blocks, then HFR may not be the best tool for the job. If you choose HFR for this purpose, you will spend too much time trying to make things right.
*This is a simple Essbase implementation with 2 cubes (or databases): a Balance Sheet and an Income Statement cube.
The fact is, some financial reports are very tricky and do not come solely from a Financial module. For example, if your company is evaluated monthly for a line of credit, your bank may require to look at several components of your business in order to determine the amount that you can borrow. They will base their decision not only on your monthly revenue, but also your liabilities, such as accounts payables, and some of your assets, such as inventory. What they ask for really depends on their internal lending requirements, and also on the type of business that you have. These are, therefore, highly customized reports that never come out-of-the box anywhere. For this reason, most companies spend a lot of man hours creating these reports as a huge excel report, after the employees have managed to pull information from many different modules together.
These excel “monsters” do the job. They are accepted by the banks, and will get you that loan. On the downside, they need to be redone every month and will drag resource hours out of profitable projects. The flat excel files are also prone to mistakes, as the values are manually keyed in each time. If you make a mistake favorable to the company, your bank will look at it as a very negative issue. If you make an unfavorable mistake, you will not be able to borrow as much as you qualify for. This is a no win situation, so the reports must be accurate every time.

To check for accuracy, there is nothing like testing overtime. But, since you must rework the report each month, you don’t have that opportunity.
The solution is to create a template that will pull from all of these different modules, calculate the numbers, add the results automatically to a pixel perfect formatted report. Over the development cycle, these mappings and calculations will be thoroughly tested, and then they will only be reused going forward.
While you may spend some time pulling this logic together, you will only have to click a few buttons after you are done, for months or years to come. In fact, I have clients that have been running reports such as this one for years. They have been saving a couple of weeks in report creation every month.
Let’s look at an example of what I am talking about:
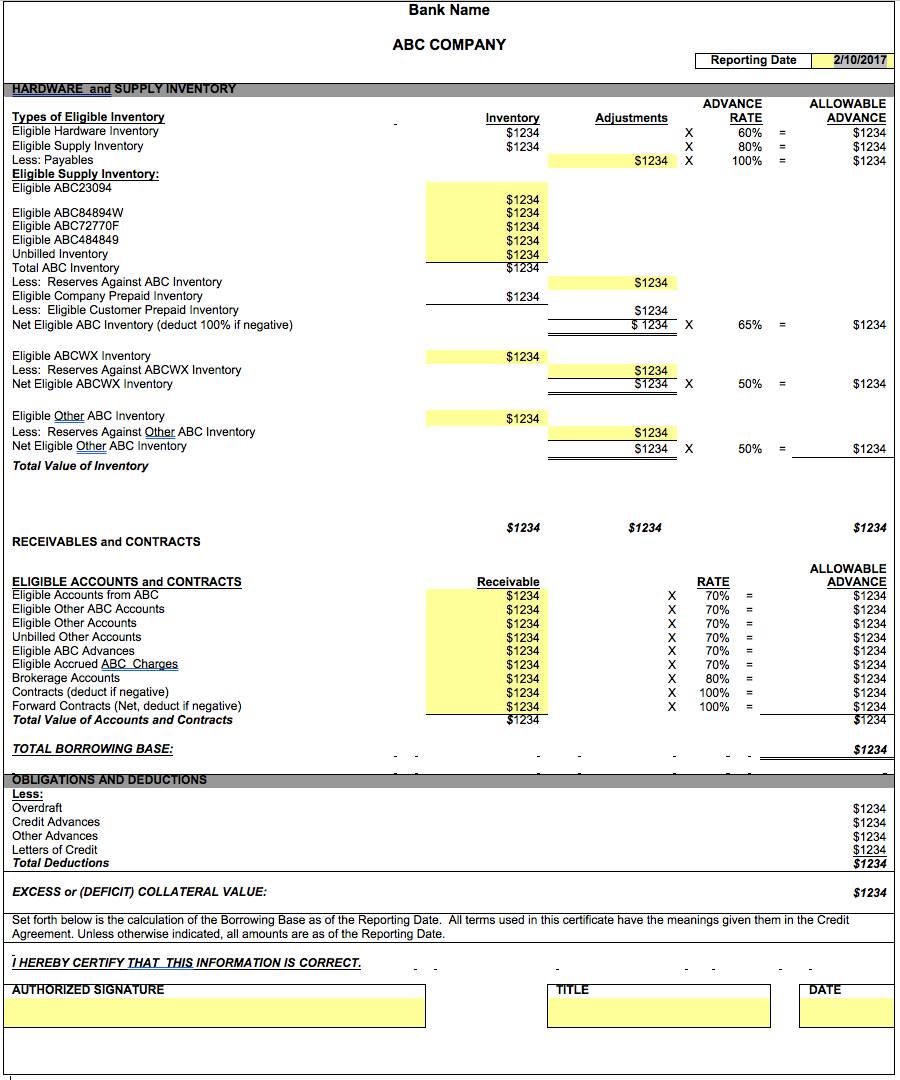
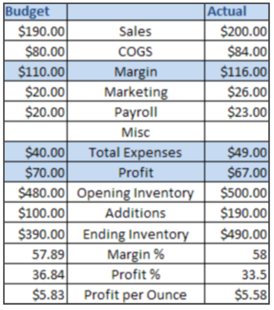
On this report, each number (disguised as $1234) has been mapped to a calculation that will be pulled dynamically, according to the date entered on the prompt. The inventory amounts are adjusted according to banking requirements, and a rate is allocated depending on the row. This amount is later added/subtracted from receivables and existing contracts. Most of these numbers were created as separate OBIEE analyses. Some amounts could even be tied into web services to get the daily futures prices to estimate the value of contracts when the report runs. All lines are considered in the final equation before the total borrowing amount can be calculated. Per this bank’s requirement, this form needed to be printed and signed, then submitted monthly.
Lending/financing reports may be the most tricky, and the most time consuming for companies to generate every month. The reports may be required by the bank, or by a company that is leasing or financing valuable equipment to your company. These reports need to show your prospective lender everything about your business. They will often need to be done in a format that is specified by your lender. These formats are not negotiable, in fact, some lenders still use old forms that used to be read by a machine.
Here is another small snippet of a financing report that I had to create recently. Now, which tool would you use for 10 different pages of something like this, which required some of the amounts to be entered in the prompt? *Note: the report had to look “exactly” like this:
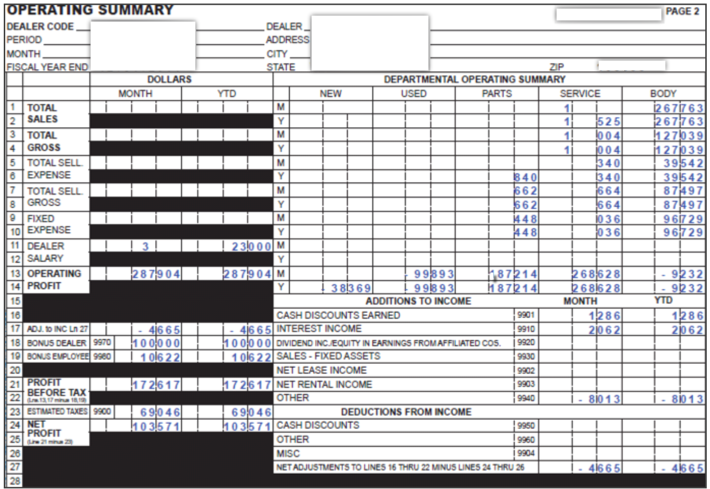
Well, as I mentioned in the beginning of this article, OBIEE would not be your partner in this type of endeavor. I can guarantee that this relationship would fail: strange formatting with black boxes, line numbers, need for Headers (footers too, not shown here), indenting, etc.
You may consider Essbase/HFR combo, for formatting and performance, but you will soon realize that:
-
Performance does not tend to be an issue with these reports, as they are generally submitted to lenders on a monthly basis, and therefore can be scheduled to run automatically in the middle of the night.
-
As mentioned earlier, HFR requires a layout grid to be inserted before the report can be designed. Here, you would end up with multiple grids to handle the calculation of different cells from multiple cubes - which can be cumbersome to create and maintain.
-
The measures in an HFR report should come from the pre-aggregated cube. In this example, some of the measures were entered as part of the prompt and are calculated at run time. At this point, you must scratch the Essbase/HFR option for this one!
So, now you are still stuck with your monster excel spreadsheet, then retyping the numbers onto the required form.
Before you marry this solution, let me present you with the tool that can do everything: BI Publisher.
Stay tuned for the second part of this blog, when I will share why I believe that BIP can solve the most challenging reporting requirements out there!