A Performance Analytics Application Case Study: Challenges and Successes
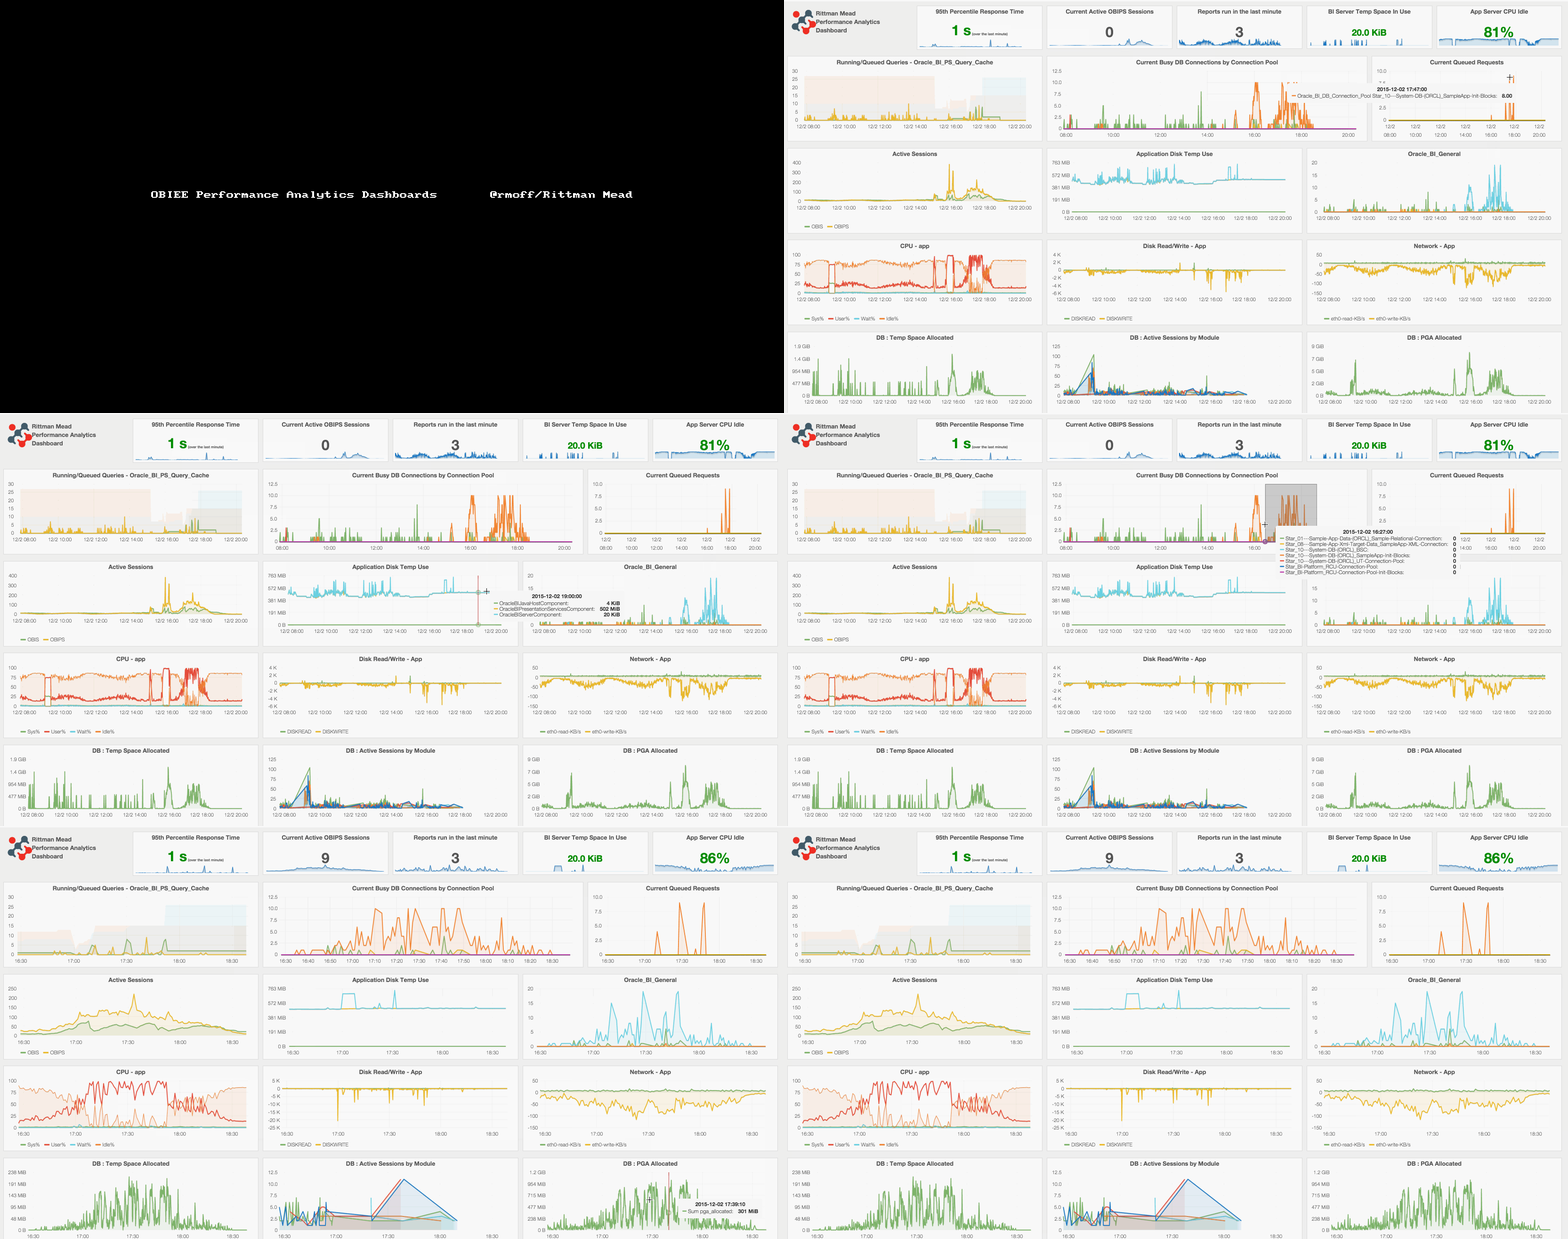
The Performance Analytics application is a collection of open source technologies that aids users in: identifying performance bottlenecks, identifying causes for slow report execution, discovering areas for performance optimization, and gathering meaningful insights into the health of an OBIEE environment.
This post focuses on lessons learned after a successful Performance Analytics application installation, where within one day of being operational it enabled us to identify and isolate a long-standing memory issue. Here's how.

Overview
Rittman Mead recently undertook an engagement with the remit to:
- Carry out a health check on the current state of an OBIEE platform, architecture, and development process
- Install the Rittman Mead Performance Analytics application, enabling rapid and accurate diagnostics of OBIEE issues
The client was on OBIEE 11g, having previously upgraded from 10g. OBIEE Production environment was a three-node cluster running the latest version of the 11g release. It served around 150 users daily, of a registered user base of around 1000.
The client had a long-standing issue with memory alerts on the master node of OBIEE cluster, but no evident architectural, hardware capacity, or software configuration issues were found after completing the health check.
Challenges and successes
Gather all relevant data
Performance Analytics gathers data from a variety of sources in order to provide a full stack view of the OBIEE environment.
-
Active Session History (ASH) - The Active Session History data is read from the v$ACTIVE_SESSION_HISTORY system database view. Access to this data allows Performance Analytics users to have an understanding of the performance and state of the database at a given point it time as it provides information such as the SQL operation being performed, which application is executing the query, whether the query is actively being performed or is waiting for service, what state of execution the query is in, and many other useful statistics.
-
Operating System Metrics - Unix-based Operating Systems contain several commands used to gather information about the performance or status of the server such as vmstat, iostat, netstat, top and df. Performance Analytics utilizes the output of these commands to display the current status of the OS at a given point in time.
-
Usage Tracking - The Oracle BI Server supports the collection of usage tracking data. When usage tracking is enabled, the Oracle BI Server collects usage tracking data for each query, and it writes statistics to a usage tracking log file or inserts them directly into a database table. Access to this data allows Performance Analytics users to have an understanding of the performance of the BI Server and specific reports in the OBIEE environment at any given point in time.
-
OBIEE metrics - OBIEE has the capability to expose internal performance data through the Dynamic Monitoring Service (DMS). The data exposed contains information such as Connection Pool statistics, JVM statistics, the number of active threads, and much more. Access to this data allows Performance Analytics to record the current status of many of the OBIEE components and intricacies found within the tool.
Performance Analytics was deployed using Docker in a couple of days, requiring absolutely no software installation on any machine other than the monitoring server. All configuration settings are held in one file, and it was sufficient to add connection details of each server to it in order to gather all aforementioned data.
Accurately diagnose issues
By combining operating system metrics (CPU, memory, etc.) with internal OBIEE metrics and those from the database, Performance Analytics gives a "single pane of glass" view on the behaviour of the whole stack. This enables correlations in behaviour to be easily identified, and issues drilled into using the analysis capabilities of the tool.
Within a day of being installed, Performance Analytics enabled the client to accurately diagnose a long-standing issue with memory alerts on OBIEE master node. The cause was traced to the export to Excel of a large dataset by a single user.
Workload Planning
Performance Analytics allows to capture system status and workload over time, so you can see how the system is responding to peak loads in real-time.
With Performance Analytics the client is now able to estimate maximum workload the current architecture can support before starting to see issues and whether it is going to cope with the next years workload.
Conclusion
Performance Analytics just paid for itself.
Performance Analytics collects all relevant data and makes it accessible from one central location, allowing users to investigate performance inquiries promptly and simply. Instead of forcing users to dig through database records or a linux server manually, they can access all of the same data through a set of dashboards engineered to facilitate discovery from the collected data.
If you’d like to find out more about the Performance Analytics service offered by Rittman Mead, please get in touch.
